Implied Volatility RangeThe Implied Volatility Range is a forward-looking tool that transforms option market data into probability ranges for future prices. Based on the lognormal distribution of asset prices assumed in modern option pricing models, it converts the implied volatility curve into a volatility cone with dynamic labels that show the market’s expectations for the price distribution at a specific point in time. At the selected future date, it displays projected price levels and their percentage change from today’s close across 1, 2, and 3 standard deviation (σ) ranges:
1σ range = ~68.2% probability the price will remain within this range.
2σ range = ~95.4% probability the price will remain within this range.
3σ range = ~99.7% probability the price will remain within this range.
What makes this indicator especially useful is its ability to incorporate implied volatility skew. When only ATM IV (%) is entered, the indicator displays the standard Black–Scholes lognormal distribution. By adding High IV (%) and Low IV (%) values tied to strikes above and below the current price, the indicator interpolates between these inputs to approximate the implied volatility skew. This adjustment produces a market-implied probability distribution that indicates whether the option market is leaning bullish or bearish, based on the data entered in the menu:
ATM IV (%) = Implied volatility at the current spot price (at-the-money).
High IV (%) = Implied volatility at a strike above the current spot price.
High Strike = Strike price corresponding to the High IV input (OTM call).
Low IV (%) = Implied volatility at a strike below the current spot price.
Low Strike = Strike price corresponding to the Low IV input (OTM put).
Expiration (Day, Month, Year) = Option expiration date for the projection.
Once these inputs are entered, the indicator calculates implied probability ranges and, if both High IV and Low IV values are provided, adjusts for skew to approximate the option market’s distribution. If no implied volatility data is supplied, the indicator defaults to a lognormal distribution based on historical volatility, using past realized volatility over the same forward horizon. This keeps the tool functional even without implied volatility inputs, though in that case the output represents only an approximation of ATM IV, not the actual market view.
In summary, the Implied Volatility Range is a powerful tool that translates implied volatility inputs into a clear and practical estimate of the market’s expectations for future prices. It allows traders to visualize the probability of price ranges while also highlighting directional bias, a dimension often difficult to interpret from traditional implied volatility charts. It should be emphasized, however, that this tool reflects only the market’s expectations at a specific point in time, which may change as new information and trading activity reshape implied volatility.
Impliedvolatility

Synthetic VX3! & VX4! continuous /VX futuresTradingView is missing continuous 3rd and 4th month VIX (/VX) futures, so I decided to try to make a synthetic one that emulates what continuous maturity futures would look like. This is useful for backtesting/historical purposes as it enables traders to see how their further out VX contracts would've performed vs the front month contract.
The indicator pulls actual realtime data (if you subscribe to the CBOE data package) or 15 minute delayed data for the VIX spot (the actual non-tradeable VIX index), the continuous front month (VX1!), and the continuous second month (VX2!) continually rolled contracts. Then the indicator's script applies a formula to fairly closely estimate how 3rd and 4th month continuous contracts would've moved.
It uses an exponential mean‑reversion to a long‑run level formula using:
σ(T) = θ+(σ0−θ)e−kT
You can expect it to be off by ~5% or so (in times of backwardation it might be less accurate).

Sigma-Level1-Sigma-Level Indicator (for 28 FX Pairs)
This TradingView indicator calculates and visualizes the 1-sigma price projection range for the current FX pair, based on implied volatility (IV) and a user-defined reference price.
🔧 User Inputs
1. Implied Volatility (IV) Selection
You can choose which volatility term to apply:
ON (Overnight)
1W (1 Week)
1M (1 Month)
Each currency pair uses manually entered IV values (in %), grouped by base currency (USD, EUR, GBP, etc.).
www.investing.com
2. Base Price Selection
You can define the price level used as the anchor for the sigma projection:
CurrentPrice — live market price
YesterdayClose — close of the previous day
LastHourClose — close of the last 1-hour candle
LastFriday — weekly close from last Friday
LastMonthClose — close of the previous monthly candle
LastYearClose — close of the previous yearly candle
These values are retrieved using the appropriate timeframe (D, W, M, 12M, or 60 for hourly).
📐 How the Calculation Works
The indicator calculates the 1σ range using this formula:
1σ Range = basePrice × (IV / √N) / 100
Where:
basePrice is the selected anchor price.
IV is the selected implied volatility for the current pair.
N is the number of periods per year, depending on the IV term:
√252 for ON (trading days)
√52 for 1W (weeks)
√12 for 1M (months)
The upper and lower bands are then:
1σ Up = basePrice + range
1σ Down = basePrice - range
These bands are plotted only during the current calendar week.
🖼️ Visual Output
Green Line: 1σ Upper Boundary
Red Line: 1σ Lower Boundary
Labels show the exact 1σ values at the most recent bar
⚠️ Disclaimer
This indicator is for informational and analytical purposes only. It does not constitute financial advice, a trading signal, or a guarantee of future performance. Always perform your own research and consult with a qualified financial advisor before making trading decisions.

Options Oscillator [Lite] IVRank, IVx, Call/Put Volatility Skew The first TradingView indicator that provides REAL IVRank, IVx, and CALL/PUT skew data based on REAL option chain for 5 U.S. market symbols.
🔃 Auto-Updating Option Metrics without refresh!
🍒 Developed and maintained by option traders for option traders.
📈 Specifically designed for TradingView users who trade options.
🔶 Ticker Information:
This 'Lite' indicator is currently only available for 5 liquid U.S. market smbols : NASDAQ:TSLA AMEX:DIA NASDAQ:AAPL NASDAQ:AMZN and NYSE:ORCL
🔶 How does the indicator work and why is it unique?
This Pine Script indicator is a complex tool designed to provide various option metrics and visualization tools for options market traders. The indicator extracts raw options data from an external data provider (ORATS), processes and refines the delayed data package using pineseed, and sends it to TradingView, visualizing the data using specific formulas (see detailed below) or interpolated values (e.g., delta distances). This method of incorporating options data into a visualization framework is unique and entirely innovative on TradingView.
The indicator aims to offer a comprehensive view of the current state of options for the implemented instruments, including implied volatility (IV), IV rank (IVR), options skew, and expected market movements, which are objectively measured as detailed below.
The options metrics we display may be familiar to options traders from various major brokerage platforms such as TastyTrade, IBKR, TOS, Tradier, TD Ameritrade, Schwab, etc.
🟨 The following data is displayed in the oscillator 🟨
We use Tastytrade formulas, so our numbers mostly align with theirs!
🔶 𝗜𝗩𝗥𝗮𝗻𝗸
The Implied Volatility Rank (IVR) helps options traders assess the current level of implied volatility (IV) in comparison to the past 52 weeks. IVR is a useful metric to determine whether options are relatively cheap or expensive. This can guide traders on whether to buy or sell options.
IV Rank formula = (current IV - 52 week IV low) / (52 week IV high - 52 week IV low)
IVRank is default blue and you can adjust their settings:
🔶 𝗜𝗩𝘅 𝗮𝘃𝗴
The implied volatility (IVx) shown in the option chain is calculated like the VIX. The Cboe uses standard and weekly SPX options to measure expected S&P 500 volatility. A similar method is used for calculating IVx for each expiration cycle.
We aggregate the IVx values for the 35-70 day monthly expiration cycle, and use that value in the oscillator and info panel.
We always display which expiration the IVx values are averaged for when you hover over the IVx cell.
IVx main color is purple, but you can change the settings:
🔹IVx 5 days change %
We are also displaying the five-day change of the IV Index (IVx value). The IV Index 5-Day Change column provides quick insight into recent expansions or decreases in implied volatility over the last five trading days.
Traders who expect the value of options to decrease might view a decrease in IVX as a positive signal. Strategies such as Strangle and Ratio Spread can benefit from this decrease.
On the other hand, traders anticipating further increases in IVX will focus on the rising IVX values. Strategies like Calendar Spread or Diagonal Spread can take advantage of increasing implied volatility.
This indicator helps traders quickly assess changes in implied volatility, enabling them to make informed decisions based on their trading strategies and market expectations.
Important Note:
The IVx value alone does not provide sufficient context. There are stocks that inherently exhibit high IVx values. Therefore, it is crucial to consider IVx in conjunction with the Implied Volatility Rank (IVR), which measures the IVx relative to its own historical values. This combined view helps in accurately assessing the significance of the IVx in relation to the specific stock's typical volatility behavior.
This indicator offers traders a comprehensive view of implied volatility, assisting them in making informed decisions by highlighting both the absolute and relative volatility measures.
🔶 𝗖𝗔𝗟𝗟/𝗣𝗨𝗧 𝗣𝗿𝗶𝗰𝗶𝗻𝗴 𝗦𝗸𝗲𝘄 𝗵𝗶𝘀𝘁𝗼𝗴𝗿𝗮𝗺
At TanukiTrade, Vertical Pricing Skew refers to the difference in pricing between put and call options with the same expiration date at the same distance (at tastytrade binary expected move). We analyze this skew to understand market sentiment. This is the same formula used by TastyTrade for calculations.
We calculate the interpolated strike price based on the expected move, taking into account the neighboring option prices and their distances. This allows us to accurately determine whether the CALL or PUT options are more expensive.
🔹 What Causes Pricing Skew? The Theory Behind It
The asymmetric pricing of PUT and CALL options is driven by the natural dynamics of the market. The theory is that when CALL options are more expensive than PUT options at the same distance from the current spot price, market participants are buying CALLs and selling PUTs, expecting a faster upward movement compared to a downward one .
In the case of PUT skew, it's the opposite: participants are buying PUTs and selling CALLs , as they expect a potential downward move to happen more quickly than an upward one.
An options trader can take advantage of this phenomenon by leveraging PUT pricing skew. For example, if they have a bullish outlook and both IVR and IVx are high and IV started decreasing, they can capitalize on this PUT skew with strategies like a jade lizard, broken wing butterfly, or short put.
🔴 PUT Skew 🔴
Put options are more expensive than call options, indicating the market expects a faster downward move (▽). This alone doesn't indicate which way the market will move (because nobody knows that), but the options chain pricing suggests that if the market moves downward, it could do so faster in velocity compared to a potential upward movement.
🔹 SPY PUT SKEW example:
If AMEX:SPY PUT option prices are 46% higher than CALLs at the same distance for the optimal next monthly expiry (DTE). This alone doesn't indicate which way the market will move (because nobody knows that), but the options chain pricing suggests that if the market moves downward, it could do so 46% faster in velocity compared to a potential upward movement
🟢 CALL Skew 🟢
Call options are more expensive than put options, indicating the market expects a faster upward move (△). This alone doesn't indicate which way the market will move (because nobody knows that), but the options chain pricing suggests that if the market moves upward, it could do so faster in velocity compared to a potential downward movement.
🔹 INTC CALL SKEW example:
If NASDAQ:INTC CALL option prices are 49% higher than PUTs at the same distance for the optimal next monthly expiry (DTE). This alone doesn't indicate which way the market will move (because nobody knows that), but the options chain pricing suggests that if the market moves upward, it could do so 49% faster in velocity compared to a potential downward movement .
🔶 USAGE example:
The script is compatible with our other options indicators.
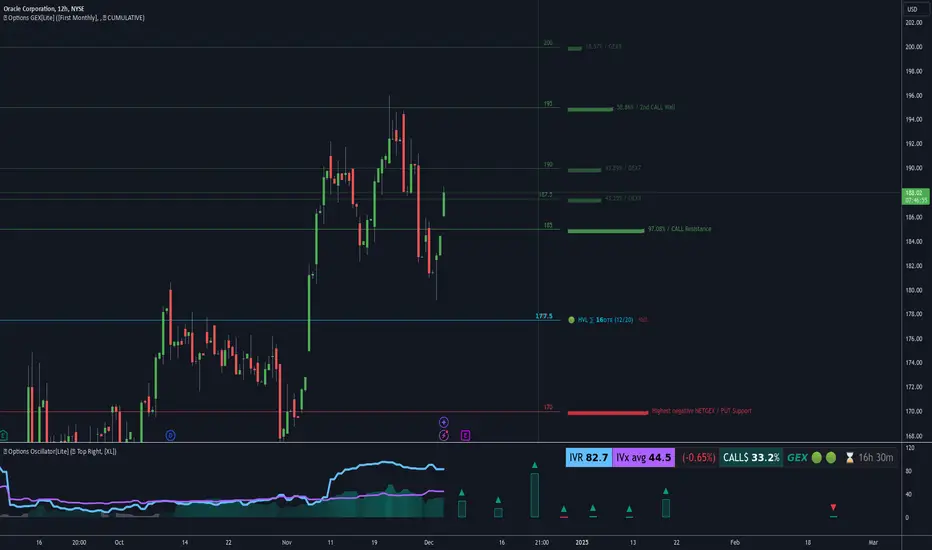
For example: Since the main metrics are already available in this Options Oscillator, you can hide the main IVR panel of our Options Overlay indicator, freeing up more space on the chart. The following image shows this:
🔶 ADDITIONAL IMPORTANT COMMENTS
🔹 Historical Data:
Yes, we only using historical internal metrics dating back to 2024-07-01, when the TanukiTrade options brand launched. For now, we're using these, but we may expand the historical data in the future.
🔹 What distance does the indicator use to measure the call/put pricing skew?:
It is important to highlight that this oscillator displays the call/put pricing skew changes for the next optimal monthly expiration on a histogram.
The Binary Expected Move distance is calculated using the TastyTrade method for the next optimal monthly expiration: Formula = (ATM straddle price x 0.6) + (1st OTM strangle price x 0.3) + (2nd OTM strangle price x 0.1)
We interpolate the exact difference based on the neighboring strikes at the binary expected move distance using the TastyTrade method, and compare the interpolated call and put prices at this specific point.
🔹 - Why is there a slight difference between the displayed data and my live brokerage data?
There are two reasons for this, and one is beyond our control.
◎ Option-data update frequency:
According to TradingView's regulations and guidelines, we can update external data a maximum of 5 times per day. We strive to use these updates in the most optimal way:
(1st update) 15 minutes after U.S. market open
(2nd, 3rd, 4th updates) 1.5–3 hours during U.S. market open hours
(5th update) 10 minutes before U.S. market close.
You don’t need to refresh your window, our last refreshed data-pack is always automatically applied to your indicator, and you can see the time elapsed since the last update at the bottom of the corner on daily TF.
◎ Brokerage Calculation Differences:
Every brokerage has slight differences in how they calculate metrics like IV and IVx. If you open three windows for TOS, TastyTrade, and IBKR side by side, you will notice that the values are minimally different. We had to choose a standard, so we use the formulas and mathematical models described by TastyTrade when analyzing the options chain and drawing conclusions.
🔹 - EOD data:
The indicator always displays end-of-day (EOD) data for IVR, IV, and CALL/PUT pricing skew. During trading hours, it shows the current values for the ongoing day with each update, and at market close, these values become final. From that point on, the data is considered EOD, provided the day confirms as a closed daily candle.
🔹 - U.S. market only:
Since we only deal with liquid option chains: this option indicator only works for the USA options market and do not include future contracts; we have implemented each selected symbol individually.
Disclaimer:
Our option indicator uses approximately 15min-3 hour delayed option market snapshot data to calculate the main option metrics. Exact realtime option contract prices are never displayed; only derived metrics and interpolated delta are shown to ensure accurate and consistent visualization. Due to the above, this indicator can only be used for decision support; exclusive decisions cannot be made based on this indicator. We reserve the right to make errors.This indicator is designed for options traders who understand what they are doing. It assumes that they are familiar with options and can make well-informed, independent decisions. We work with public data and are not a data provider; therefore, we do not bear any financial or other liability.
Options Oscillator [PRO] IVRank, IVx, Call/Put Volatility Skew𝗧𝗵𝗲 𝗳𝗶𝗿𝘀𝘁 𝗧𝗿𝗮𝗱𝗶𝗻𝗴𝗩𝗶𝗲𝘄 𝗶𝗻𝗱𝗶𝗰𝗮𝘁𝗼𝗿 𝘁𝗵𝗮𝘁 𝗽𝗿𝗼𝘃𝗶𝗱𝗲𝘀 𝗥𝗘𝗔𝗟 𝗜𝗩𝗥𝗮𝗻𝗸, 𝗜𝗩𝘅, 𝗮𝗻𝗱 𝗖𝗔𝗟𝗟/𝗣𝗨𝗧 𝘀𝗸𝗲𝘄 𝗱𝗮𝘁𝗮 𝗯𝗮𝘀𝗲𝗱 𝗼𝗻 𝗥𝗘𝗔𝗟 𝗼𝗽𝘁𝗶𝗼𝗻 𝗰𝗵𝗮𝗶𝗻 𝗳𝗼𝗿 𝗼𝘃𝗲𝗿 𝟭𝟲𝟱+ 𝗺𝗼𝘀𝘁 𝗹𝗶𝗾𝘂𝗶𝗱 𝗨.𝗦. 𝗺𝗮𝗿𝗸𝗲𝘁 𝘀𝘆𝗺𝗯𝗼𝗹𝘀
🔃 Auto-Updating Option Metrics without refresh!
🍒 Developed and maintained by option traders for option traders.
📈 Specifically designed for TradingView users who trade options.
🔶 Ticker Information:
This indicator is currently only available for over 165+ most liquid U.S. market symbols (eg. SP:SPX AMEX:SPY NASDAQ:QQQ NASDAQ:TLT NASDAQ:NVDA , etc.. ), and we are continuously expanding the compatible watchlist here: www.tradingview.com
🔶 How does the indicator work and why is it unique?
This Pine Script indicator is a complex tool designed to provide various option metrics and visualization tools for options market traders. The indicator extracts raw options data from an external data provider (ORATS), processes and refines the delayed data package using pineseed, and sends it to TradingView, visualizing the data using specific formulas (see detailed below) or interpolated values (e.g., delta distances). This method of incorporating options data into a visualization framework is unique and entirely innovative on TradingView.
The indicator aims to offer a comprehensive view of the current state of options for the implemented instruments, including implied volatility (IV), IV rank (IVR), options skew, and expected market movements, which are objectively measured as detailed below.
The options metrics we display may be familiar to options traders from various major brokerage platforms such as TastyTrade, IBKR, TOS, Tradier, TD Ameritrade, Schwab, etc.
🟨 The following data is displayed in the oscillator 🟨
We use Tastytrade formulas, so our numbers mostly align with theirs!
🔶 𝗜𝗩𝗥𝗮𝗻𝗸
The Implied Volatility Rank (IVR) helps options traders assess the current level of implied volatility (IV) in comparison to the past 52 weeks. IVR is a useful metric to determine whether options are relatively cheap or expensive. This can guide traders on whether to buy or sell options.
IV Rank formula = (current IV - 52 week IV low) / (52 week IV high - 52 week IV low)
IVRank is default blue and you can adjust their settings:
🔶 𝗜𝗩𝘅 𝗮𝘃𝗴
The implied volatility (IVx) shown in the option chain is calculated like the VIX. The Cboe uses standard and weekly SPX options to measure expected S&P 500 volatility. A similar method is used for calculating IVx for each expiration cycle.
We aggregate the IVx values for the 35-70 day monthly expiration cycle, and use that value in the oscillator and info panel.
We always display which expiration the IVx values are averaged for when you hover over the IVx cell.
IVx main color is purple, but you can change the settings:
🔹 IVx 5 days change %
We are also displaying the five-day change of the IV Index (IVx value). The IV Index 5-Day Change column provides quick insight into recent expansions or decreases in implied volatility over the last five trading days.
Traders who expect the value of options to decrease might view a decrease in IVX as a positive signal. Strategies such as Strangle and Ratio Spread can benefit from this decrease.
On the other hand, traders anticipating further increases in IVX will focus on the rising IVX values. Strategies like Calendar Spread or Diagonal Spread can take advantage of increasing implied volatility.
This indicator helps traders quickly assess changes in implied volatility, enabling them to make informed decisions based on their trading strategies and market expectations.
Important Note:
The IVx value alone does not provide sufficient context. There are stocks that inherently exhibit high IVx values. Therefore, it is crucial to consider IVx in conjunction with the Implied Volatility Rank (IVR), which measures the IVx relative to its own historical values. This combined view helps in accurately assessing the significance of the IVx in relation to the specific stock's typical volatility behavior.
This indicator offers traders a comprehensive view of implied volatility, assisting them in making informed decisions by highlighting both the absolute and relative volatility measures.
🔶 𝗖𝗔𝗟𝗟/𝗣𝗨𝗧 𝗣𝗿𝗶𝗰𝗶𝗻𝗴 𝗦𝗸𝗲𝘄 𝗵𝗶𝘀𝘁𝗼𝗴𝗿𝗮𝗺
At TanukiTrade, Vertical Pricing Skew refers to the difference in pricing between put and call options with the same expiration date at the same distance (at tastytrade binary expected move). We analyze this skew to understand market sentiment. This is the same formula used by TastyTrade for calculations.
We calculate the interpolated strike price based on the expected move, taking into account the neighboring option prices and their distances. This allows us to accurately determine whether the CALL or PUT options are more expensive.
🔹 What Causes Pricing Skew? The Theory Behind It
The asymmetric pricing of PUT and CALL options is driven by the natural dynamics of the market. The theory is that when CALL options are more expensive than PUT options at the same distance from the current spot price, market participants are buying CALLs and selling PUTs, expecting a faster upward movement compared to a downward one .
In the case of PUT skew, it's the opposite: participants are buying PUTs and selling CALLs , as they expect a potential downward move to happen more quickly than an upward one.
An options trader can take advantage of this phenomenon by leveraging PUT pricing skew. For example, if they have a bullish outlook and both IVR and IVx are high and IV started decreasing, they can capitalize on this PUT skew with strategies like a jade lizard, broken wing butterfly, or short put.
🔴 PUT Skew 🔴
Put options are more expensive than call options, indicating the market expects a faster downward move (▽). This alone doesn't indicate which way the market will move (because nobody knows that), but the options chain pricing suggests that if the market moves downward, it could do so faster in velocity compared to a potential upward movement.
🔹 SPY PUT SKEW example:
If AMEX:SPY PUT option prices are 46% higher than CALLs at the same distance for the optimal next monthly expiry (DTE). This alone doesn't indicate which way the market will move (because nobody knows that), but the options chain pricing suggests that if the market moves downward, it could do so 46% faster in velocity compared to a potential upward movement
🟢 CALL Skew 🟢
Call options are more expensive than put options, indicating the market expects a faster upward move (△). This alone doesn't indicate which way the market will move (because nobody knows that), but the options chain pricing suggests that if the market moves upward, it could do so faster in velocity compared to a potential downward movement.
🔹 INTC CALL SKEW example:
If NASDAQ:INTC CALL option prices are 49% higher than PUTs at the same distance for the optimal next monthly expiry (DTE). This alone doesn't indicate which way the market will move (because nobody knows that), but the options chain pricing suggests that if the market moves upward, it could do so 49% faster in velocity compared to a potential downward movement .
🔶 USAGE example:
The script is compatible with our other options indicators.
For example: Since the main metrics are already available in this Options Oscillator, you can hide the main IVR panel of our Options Overlay indicator, freeing up more space on the chart. The following image shows this:
🔶 ADDITIONAL IMPORTANT COMMENTS
🔹 Historical Data:
Yes, we only using historical internal metrics dating back to 2024-07-01, when the TanukiTrade options brand launched. For now, we're using these, but we may expand the historical data in the future.
🔹 What distance does the indicator use to measure the call/put pricing skew?:
It is important to highlight that this oscillator displays the call/put pricing skew changes for the next optimal monthly expiration on a histogram.
The Binary Expected Move distance is calculated using the TastyTrade method for the next optimal monthly expiration: Formula = (ATM straddle price x 0.6) + (1st OTM strangle price x 0.3) + (2nd OTM strangle price x 0.1)
We interpolate the exact difference based on the neighboring strikes at the binary expected move distance using the TastyTrade method, and compare the interpolated call and put prices at this specific point.
🔹 - Why is there a slight difference between the displayed data and my live brokerage data?
There are two reasons for this, and one is beyond our control.
◎ Option-data update frequency:
According to TradingView's regulations and guidelines, we can update external data a maximum of 5 times per day. We strive to use these updates in the most optimal way:
(1st update) 15 minutes after U.S. market open
(2nd, 3rd, 4th updates) 1.5–3 hours during U.S. market open hours
(5th update) 10 minutes before U.S. market close.
You don’t need to refresh your window, our last refreshed data-pack is always automatically applied to your indicator, and you can see the time elapsed since the last update at the bottom of the corner on daily TF.
◎ Brokerage Calculation Differences:
Every brokerage has slight differences in how they calculate metrics like IV and IVx. If you open three windows for TOS, TastyTrade, and IBKR side by side, you will notice that the values are minimally different. We had to choose a standard, so we use the formulas and mathematical models described by TastyTrade when analyzing the options chain and drawing conclusions.
🔹 - EOD data:
The indicator always displays end-of-day (EOD) data for IVR, IV, and CALL/PUT pricing skew. During trading hours, it shows the current values for the ongoing day with each update, and at market close, these values become final. From that point on, the data is considered EOD, provided the day confirms as a closed daily candle.
🔹 - U.S. market only:
Since we only deal with liquid option chains: this option indicator only works for the USA options market and do not include future contracts; we have implemented each selected symbol individually.
Disclaimer:
Our option indicator uses approximately 15min-3 hour delayed option market snapshot data to calculate the main option metrics. Exact realtime option contract prices are never displayed; only derived metrics and interpolated delta are shown to ensure accurate and consistent visualization. Due to the above, this indicator can only be used for decision support; exclusive decisions cannot be made based on this indicator. We reserve the right to make errors.This indicator is designed for options traders who understand what they are doing. It assumes that they are familiar with options and can make well-informed, independent decisions. We work with public data and are not a data provider; therefore, we do not bear any financial or other liability.

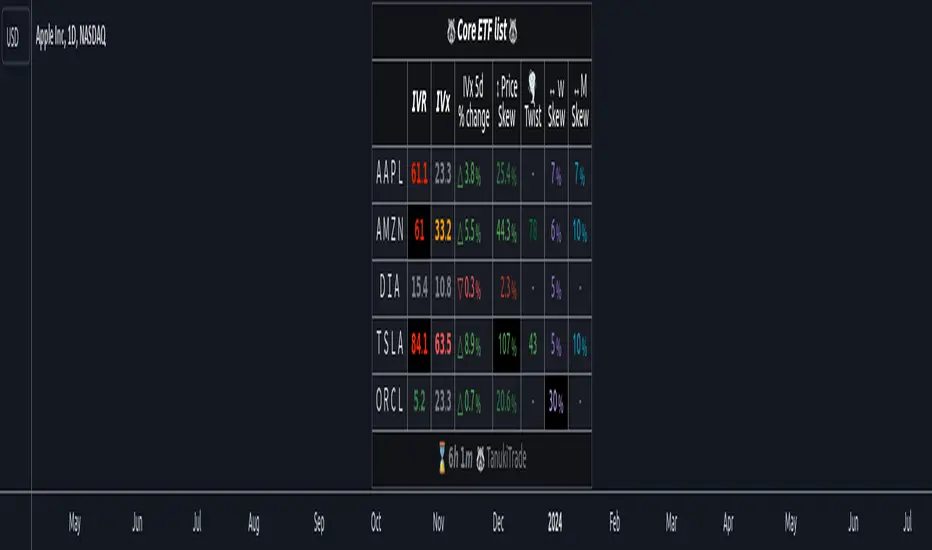
Options Screener [Pro] - IVRank, IVx, Deltas, Exp.move, Skew
𝗢𝗽𝘁𝗶𝗼𝗻 𝘀𝗰𝗿𝗲𝗲𝗻𝗲𝗿 𝗼𝗻 𝗧𝗿𝗮𝗱𝗶𝗻𝗴𝗩𝗶𝗲𝘄 𝘄𝗶𝘁𝗵 𝗿𝗲𝗮𝗹 𝗱𝗮𝘁𝗮, 𝗮𝘃𝗮𝗶𝗹𝗮𝗯𝗹𝗲 𝗳𝗼𝗿 𝗼𝘃𝗲𝗿 𝟭𝟱𝟬+ 𝗹𝗶𝗾𝘂𝗶𝗱 𝗨𝗦 𝗺𝗮𝗿𝗸𝗲𝘁 𝘀𝘆𝗺𝗯𝗼𝗹𝘀!
𝗢𝘂𝗿 𝘀𝗰𝗿𝗲𝗲𝗻𝗲𝗿 𝗽𝗿𝗼𝘃𝗶𝗱𝗲𝘀 𝗲𝘀𝘀𝗲𝗻𝘁𝗶𝗮𝗹 𝗸𝗲𝘆 𝗺𝗲𝘁𝗿𝗶𝗰𝘀 𝘀𝘂𝗰𝗵 𝗮𝘀:
✅ IVRank
✅ IVx
✅ 5-Day IVx Change
✅ Vertical Pricing Skew
✅ Horizontal IVx Skew
✅ Delta Skew
like TastyTrade, TOS, IBKR etc.
Designed to help you assess option market conditions and make well-informed trading decisions, this tool is an essential addition for every serious options trader!
Ticker Information:
This screener is currently implemented for more than 150 liquid US market tickers and we are continuously expanding the list:
SP:SPX AMEX:SPY NASDAQ:QQQ NASDAQ:TLT AMEX:GLD
NYSE:AA NASDAQ:AAL NASDAQ:AAPL NYSE:ABBV NASDAQ:ABNB NASDAQ:AMD NASDAQ:AMZN AMEX:ARKK NASDAQ:AVGO NYSE:AXP NYSE:BA NYSE:BABA NYSE:BAC NASDAQ:BIDU AMEX:BITO NYSE:BMY NYSE:BP NASDAQ:BYND NYSE:C NYSE:CAT NYSE:CCJ NYSE:CCL NASDAQ:COIN NYSE:COP NASDAQ:COST NYSE:CRM NASDAQ:CRWD NASDAQ:CSCO NYSE:CVNA NYSE:CVS NYSE:CVX NYSE:DAL NASDAQ:DBX AMEX:DIA NYSE:DIS NASDAQ:DKNG NASDAQ:EBAY NASDAQ:ETSY NASDAQ:EXPE NYSE:F NYSE:FCX NYSE:FDX AMEX:FXI AMEX:GDX AMEX:GDXJ NYSE:GE NYSE:GM NYSE:GME NYSE:GOLD NASDAQ:GOOG NASDAQ:GOOGL NYSE:GPS NYSE:GS NASDAQ:HOOD NYSE:IBM NASDAQ:IEF NASDAQ:INTC AMEX:IWM NASDAQ:JD NYSE:JNJ NYSE:JPM NYSE:JWN NYSE:KO NYSE:LLY NYSE:LOW NYSE:LVS NYSE:MA NASDAQ:MARA NYSE:MCD NYSE:MET NASDAQ:META NYSE:MGM NYSE:MMM NYSE:MPC NYSE:MRK NASDAQ:MRNA NYSE:MRO NASDAQ:MRVL NYSE:MS NASDAQ:MSFT AMEX:MSOS NYSE:NCLH NASDAQ:NDX NYSE:NET NASDAQ:NFLX NYSE:NIO NYSE:NKE NASDAQ:NVDA NASDAQ:ON NYSE:ORCL NYSE:OXY NASDAQ:PEP NYSE:PFE NYSE:PINS NYSE:PLTR NASDAQ:PTON NASDAQ:PYPL NASDAQ:QCOM NYSE:RBLX NYSE:RCL NASDAQ:RIOT NASDAQ:RIVN NASDAQ:ROKU NASDAQ:SBUX NYSE:SHOP AMEX:SLV NASDAQ:SMCI NASDAQ:SMH NYSE:SNAP NYSE:SQ NYSE:T NYSE:TGT NASDAQ:TQQQ NASDAQ:TSLA NYSE:TSM NASDAQ:TTD NASDAQ:TXN NYSE:U NASDAQ:UAL NYSE:UBER AMEX:UNG NYSE:UPS NASDAQ:UPST AMEX:USO NYSE:V AMEX:VXX NYSE:VZ NASDAQ:WBA NYSE:WFC NYSE:WMT NASDAQ:WYNN NYSE:X AMEX:XHB AMEX:XLE AMEX:XLF AMEX:XLI AMEX:XLK AMEX:XLP AMEX:XLU AMEX:XLV AMEX:XLY NYSE:XOM NYSE:XPEV CBOE:XSP NASDAQ:ZM
How does the screener work and why is it unique?
This Pine Script screener is an expert tool created to provide various option metrics and visualization tools for options market traders. The screener extracts raw options data from an external data provider (ORATS), processes, and refines the delayed data package using pineseed, and sends it to TradingView. The data is calculated using specific formulas or interpolated values, such as delta distances. This method of integrating options data into a screener framework is unique and innovative on TradingView.
The screener aims to offer a comprehensive view of the current state of options for the implemented instruments, including implied volatility index (IVx), IV rank (IVR), options skew, and expected market movements, which are objectively measured as detailed below.
The options metrics displayed may be familiar to options traders from various major brokerage platforms such as TastyTrade, IBKR, TOS, Tradier, TD Ameritrade, Schwab, etc.
🟨 𝗗𝗘𝗧𝗔𝗜𝗟𝗘𝗗 𝗗𝗢𝗖𝗨𝗠𝗘𝗡𝗧𝗔𝗧𝗜𝗢𝗡 🟨
~~~~~~~~~~~~~~~~~~~~~~~~~~~~~~~~~~~~~~~~~~~~~~~~~~
~~~~~~~~~~~~~~~~~~~~~~~~~~~~~~~~~~~~~~~~~~~~~~~~~~
🔶 Auto-Updating Option Metrics
~~~~~~~~~~~~~~~~~~~~~~~~~~~~~~~~~~~~~~~~~~~~~~~~~~
~~~~~~~~~~~~~~~~~~~~~~~~~~~~~~~~~~~~~~~~~~~~~~~~~~
🔹 IVR (IV Rank)
The Implied Volatility Rank (IVR) indicator helps options traders assess the current level of implied volatility (IV) in comparison to the past 52 weeks. IVR is a useful metric to determine whether options are relatively cheap or expensive. This can guide traders on whether to buy or sell options. We calculate IVrank, like TastyTrade does.
IVR Calculation: IV Rank = (current IV - 52 week IV low) / (52 week IV high - 52 week IV low)
IVR Levels and Interpretations:
IVR 0-10 (Green): Very low implied volatility rank. Options might be "cheap," potentially a good time to buy options.
IVR 10-35 (White): Normal implied volatility rank. Options pricing is relatively standard.
IVR 35-50 (Orange): Almost high implied volatility rank.
IVR 50-75 (Red): Definitely high implied volatility rank. Options might be "expensive," potentially a good time to sell options for higher premiums.
IVR above 75 (Highlighted Red): Ultra high implied volatility rank. Indicates very high levels, suggesting a favorable time for selling options.
Extra: If the IVx value is also greater than 30, the background will be dark highlighted, because a high IVR alone doesn’t mean much without high IVx.
🔹IVx (Implied Volatility Index)
The Implied Volatility Index (IVx) displayed in the option chain is calculated similarly to the VIX. The Cboe employs standard and weekly SPX options to measure the expected volatility of the S&P 500. A similar method is utilized to calculate IVx for each option expiration cycle.
For our purposes, we aggregate the IVx values specifically for the 35-70 day monthly expiration cycle . This aggregated value is then presented in the screener and info panel, providing a clear and concise measure of implied volatility over this period.
We will display a warning if the option chain is heavily skewed and valid, symmetric 16 delta options are not found at optimal monthly expirations.
IVx Color coding:
IVx above 30 is displayed in orange.
IVx above 60 is displayed in red
Important Note: The IVx value alone does not provide sufficient context. There are stocks that inherently exhibit high IVx values. Therefore, it is crucial to consider IVx in conjunction with the Implied Volatility Rank (IVR), which measures the IVx relative to its own historical values. This combined view helps in accurately assessing the significance of the IVx in relation to the specific stock's typical volatility behavior.
This indicator offers traders a comprehensive view of implied volatility, assisting them in making informed decisions by highlighting both the absolute and relative volatility measures.
🔹IVx 5 days change %
We are displaying the five-day change of the IV Index (IVx value). The IV Index 5-Day Change column provides quick insight into recent expansions or decreases in implied volatility over the last five trading days.
Traders who expect the value of options to decrease might view a decrease in IVX as a positive signal. Strategies such as Strangle and Ratio Spread can benefit from this decrease.
On the other hand, traders anticipating further increases in IVX will focus on the rising IVX values. Strategies like Calendar Spread or Diagonal Spread can take advantage of increasing implied volatility.
This indicator helps traders quickly assess changes in implied volatility, enabling them to make informed decisions based on their trading strategies and market expectations.
🔹 Vertical Pricing Skew
At TanukiTrade, Vertical Pricing Skew refers to the difference in pricing between put and call options with the same expiration date at the same distance (at expected move). We analyze this skew to understand market sentiment. This is the same formula used by TastyTrade for calculations.
PUT Skew (red): Put options are more expensive than call options, indicating the market expects a downward move (▽). If put options are more expensive by more than 20% at the same expected move distance, we color it lighter red.
CALL Skew (green): Call options are more expensive than put options, indicating the market expects an upward move (△). If call options are priced more than 30% higher at the examined expiration, we color it lighter green.
We focus on options with 35-70 days to expiration (DTE) for optimal analysis. We always evaluate the skew at the expected move using linear interpolation to determine the theoretical pricing of options. If the pricing have more than C50%/P35% we are highlighting the cell.
This approach helps us gauge market expectations accurately, providing insights into potential price movements.
🔹 Horizontal IVx Skew
In options pricing, it is typically expected that the implied volatility (IVx) increases for options with later expiration dates. This means that options further out in time are generally more expensive. At TanukiTrade, we refer to the phenomenon where this expectation is reversed—when the IVx decreases between two consecutive expirations—as Horizontal Skew or IVx Skew.
Horizontal IVx Skew occurs when: Front Month IVx < Back Month IVx
This scenario can create opportunities for traders who prefer diagonal or calendar strategies. Based on our experience, we categorize Horizontal Skew into two types:
Weekly Horizontal Skew: When IVx skew is observed between two consecutive non-monthly expirations , the displayed value is the rounded-up percentage difference. On hover, the approximate location of this skew is also displayed. The precise location can be seen on the Overlay indicator.
Monthly Horizontal Skew: When IVx skew is observed between two consecutive monthly expirations , the displayed value is the rounded-up percentage difference. On hover, the approximate location of this skew is also displayed. The precise location can be seen on the Overlay indicator.
The Monthly Vertical IVx skew is consistently stronger (more liquid) on average symbols than the weekly vertical IVx skew. Weekly Horizontal IVx Skew may not carry relevant information for symbols not included in the 'Weeklies & Volume Masters' preset.
If the options chain follows the normal IVx pattern, no skew value is displayed.
Additionally , if the Implied Volatility Rank (IVR) is low (indicated by green), the Horizontal Skew background turns black, because this environment is good for Calendar+Diagonal.
Additionally , if the % of the skew is greater than 10, the Horizontal Skew font color turns lighter.
🔹 Delta Skew 🌪️ (Twist)
We have a metric that examines which monthly expiration indicates a "Delta Skew Twist" where the 16 delta deviates from the monthly STD. This is important because, under normal circumstances, the 16 delta is positioned between the expected move and the standard deviation (STD1) line. However, if the interpolated 16 delta line exceeds the STD1 line either upwards or downwards, it represents a special case of vertical skew.
Normal case : exp.move < delta16 < std1
Delta Skew Twist: exp.move < std1 < delta16
If the Days to Expiration of the twist is less than 75, we use a lighter color.
~~~~~~~~~~~~~~~~~~~~~~~~~~~~~~~~~~~~~~~~~~~~~~~~~~
~~~~~~~~~~~~~~~~~~~~~~~~~~~~~~~~~~~~~~~~~~~~~~~~~~
🔶 HOW WE CALCULATE
~~~~~~~~~~~~~~~~~~~~~~~~~~~~~~~~~~~~~~~~~~~~~~~~~~
~~~~~~~~~~~~~~~~~~~~~~~~~~~~~~~~~~~~~~~~~~~~~~~~~~
🔹 Expected Move
The expected move is the predicted dollar change in the underlying stock's price by a given option's expiration date, with 68% certainty. It is calculated using the expiration's pricing and implied volatility levels.
Expected Move Calculation
Expected Move = (ATM straddle price x 0.6) + (1st OTM strangle price x 0.3) + (2nd OTM strangle price x 0.1)
For example , if stock XYZ is trading at 121 and the ATM straddle is 4.40, the 120/122 strangle is 3.46, and the 119/123 strangle is 2.66, the expected move is calculated as follows: 4.40 x 0.60 = 2.64; 3.46 x 0.30 = 1.04; 2.66 x 0.10 = 0.27; Expected move = 2.64 + 1.04 + 0.27 = ±3.9
🔹 Standard deviation
One standard deviation of a stock encompasses approximately 68.2% of outcomes in a distribution of occurrences based on current implied volatility.
We use the expected move formula to calculate the one standard deviation range of a stock. This calculation is based on the days-to-expiration (DTE) of our option contract, the stock price, and the implied volatility of a stock:
Calculation:
Standard Deviation = Closing Price * Implied Volatility * sqrt(Days to Expiration / 365)
According to options literature, there is a 68% probability that the underlying asset will fall within this one standard deviation range at expiration.
∑ Quant Observation: The values of the expected move and the 1st standard deviation (1STD) will not match because they use different calculation methods, even though both are referred to as representing 68% of the underlying asset's movement in options literature. The expected move is based on direct market pricing of ATM options. The 1STD, on the other hand, uses the averaged implied volatility (IVX) for the given expiration to determine its value. Based on our experience, it is better to consider the area between the expected move and the 1STD as the true representation of the original 68% rule.
~~~~~~~~~~~~~~~~~~~~~~~~~~~~~~~~~~~~~~~~~~~~~~~~~~
~~~~~~~~~~~~~~~~~~~~~~~~~~~~~~~~~~~~~~~~~~~~~~~~~~
🔶 USAGE
~~~~~~~~~~~~~~~~~~~~~~~~~~~~~~~~~~~~~~~~~~~~~~~~~~
~~~~~~~~~~~~~~~~~~~~~~~~~~~~~~~~~~~~~~~~~~~~~~~~~~
🔹 Create a new empty layout for the screener!
You can access this from the dropdown menu in the upper right corner. In the popup window, name it as you like, for example, "Option Screener."
🔹 Hide the candlestick chart
Make the chart invisible using the "Hide" option from the three-dot dropdown menu located in the upper left corner.
🔹 Other Unwanted Elements
If other unnecessary elements are distracting you (e.g., economic data, volume, default grid), you can easily remove them from the layout. Right-click on the empty chart area. Here, click on the gear (Settings) icon and remove everything from the "Events" tab, as well as from the "Trading" tab. Under the "Canvas" tab, it is recommended to set the "Grid lines" setting to "None."
~~~~~~~~~~~~~~~~~~~~~~~~~~~~~~~~~~~~~~~~~~~~~~~~~~
~~~~~~~~~~~~~~~~~~~~~~~~~~~~~~~~~~~~~~~~~~~~~~~~~~
🔶 Screener Settings
~~~~~~~~~~~~~~~~~~~~~~~~~~~~~~~~~~~~~~~~~~~~~~~~~~
~~~~~~~~~~~~~~~~~~~~~~~~~~~~~~~~~~~~~~~~~~~~~~~~~~
Naturally, the font size and position can be easily adjusted.
Additionally, there are two basic usage modes: manual input or using the preset list.
🔹If you selected “Manual Below” in the preset dropdown, the tickers you chose from the dropdown (up to a maximum of 40) will be displayed. The panel name will be the one you specified.
🔹If you selected a pre-assembled list , the manually entered list will be ignored, and the preset list will be displayed. (In the future, we will expand the preset list based on your feedback!).
~~~~~~~~~~~~~~~~~~~~~~~~~~~~~~~~~~~~~~~~~~~~~~~~~~
~~~~~~~~~~~~~~~~~~~~~~~~~~~~~~~~~~~~~~~~~~~~~~~~~~
🔶 Best Practices for TanukiTrade Option Screener:
~~~~~~~~~~~~~~~~~~~~~~~~~~~~~~~~~~~~~~~~~~~~~~~~~~
~~~~~~~~~~~~~~~~~~~~~~~~~~~~~~~~~~~~~~~~~~~~~~~~~~
🔹 Every Preset on a New Layout:
If you following the steps above, you easy can setup this screener in one window with one split layout:
🔹 Split Layout:
- Left Side: The underlying asset with our Options IV Overlay (IVR, Deltas, Expected Move, STD1, Skew visualized) along with the Enhanced Murrey Math Indicator and Option Expiry.
- Right Side: Searching for opportunities using our Options Screener.
Opportunities Search
🔹 Everything in One Layout + One Window:
This is the all-in-one view:
- The underlying asset with our Options IV Overlay (IVR, Deltas, Expected Move, STD1, Skew visualized)
- Enhanced Murrey Math Indicator and Option Expiry
- Options Screener on the left
~~~~~~~~~~~~~~~~~~~~~~~~~~~~~~~~~~~~~~~~
🔶 ADDITIONAL IMPORTANT COMMENTS
- U.S. market only:
Since we only deal with liquid option chains: this option indicator only works for the USA options market and do not include future contracts; we have implemented each selected symbol individually.
- Why is there a slight difference between the displayed data and my live brokerage data? There are two reasons for this, and one is beyond our control.
- Brokerage Calculation Differences:
Every brokerage has slight differences in how they calculate metrics like IV and IVx. If you open three windows for TOS, TastyTrade, and IBKR side by side, you will notice that the values are minimally different. We had to choose a standard, so we use the formulas and mathematical models described by TastyTrade when analyzing the options chain and drawing conclusions.
- Option-data update frequency:
According to TradingView's regulations and guidelines, we can update external data a maximum of 5 times per day. We strive to use these updates in the most optimal way:
(1st update) 15 minutes after U.S. market open
(2nd, 3rd, 4th updates) 1.5–3 hours during U.S. market open hours
(5th update) 10 minutes before market close.
You don’t need to refresh your window, our last refreshed data-pack is always automatically applied to your indicator , and you can see the time elapsed since the last update at the bottom of your indicator.
- Weekly illiquid expiries:
The Weekly Horizontal IVx Skew may not carry relevant information for instruments not included in the 'Weeklies & Volume Masters' preset package.
-Timeframe Issues:
Our option indicator visualizes relevant data on a daily resolution. If you see strange or incorrect data (e.g., when the options data was last updated), always switch to a daily (1D) timeframe. If you still see strange data, please contact us.
Disclaimer:
Our option indicator uses approximately 15min-3 hour delayed option market snapshot data to calculate the main option metrics. Exact realtime option contract prices are never displayed; only derived metrics and interpolated delta are shown to ensure accurate and consistent visualization. Due to the above, this indicator can only be used for decision support; exclusive decisions cannot be made based on this indicator . We reserve the right to make errors.This indicator is designed for options traders who understand what they are doing. It assumes that they are familiar with options and can make well-informed, independent decisions. We work with public data and are not a data provider; therefore, we do not bear any financial or other liability.

Options SCREENER [Lite] - IVRank, IVx, Deltas, Exp.move, Skew
𝗢𝗽𝘁𝗶𝗼𝗻 𝘀𝗰𝗿𝗲𝗲𝗻𝗲𝗿 𝗼𝗻 𝗧𝗿𝗮𝗱𝗶𝗻𝗴𝗩𝗶𝗲𝘄 𝘄𝗶𝘁𝗵 𝗿𝗲𝗮𝗹 𝗱𝗮𝘁𝗮, 𝗼𝗻𝗹𝘆 𝗳𝗼𝗿 𝟱 𝗹𝗶𝗾𝘂𝗶𝗱 𝗨𝗦 𝗺𝗮𝗿𝗸𝗲𝘁 𝘀𝘆𝗺𝗯𝗼𝗹𝘀
𝗢𝘂𝗿 𝘀𝗰𝗿𝗲𝗲𝗻𝗲𝗿 𝗽𝗿𝗼𝘃𝗶𝗱𝗲𝘀 𝗲𝘀𝘀𝗲𝗻𝘁𝗶𝗮𝗹 𝗸𝗲𝘆 𝗺𝗲𝘁𝗿𝗶𝗰𝘀 𝘀𝘂𝗰𝗵 𝗮𝘀:
✅ IVRank
✅ IVx
✅ 5-Day IVx Change
✅ Vertical Pricing Skew
✅ Horizontal IVx Skew
✅ Delta Skew
like TastyTrade, TOS, IBKR etc.
Designed to help you assess option market conditions and make well-informed trading decisions, this tool is an essential addition for every serious options trader!
Ticker Information:
This screener is currently implemented only for 5 liquid US market tickers:
NASDAQ:AAPL NASDAQ:AMZN AMEX:DIA NYSE:ORCL and NASDAQ:TSLA
How does the screener work and why is it unique?
This Pine Script screener is an expert tool created to provide various option metrics and visualization tools for options market traders. The screener extracts raw options data from an external data provider (ORATS), processes, and refines the delayed data package using pineseed, and sends it to TradingView. The data is calculated using specific formulas or interpolated values, such as delta distances. This method of integrating options data into a screener framework is unique and innovative on TradingView.
The screener aims to offer a comprehensive view of the current state of options for the implemented instruments, including implied volatility index (IVx), IV rank (IVR), options skew, and expected market movements, which are objectively measured as detailed below.
The options metrics displayed may be familiar to options traders from various major brokerage platforms such as TastyTrade, IBKR, TOS, Tradier, TD Ameritrade, Schwab, etc.
🟨 𝗗𝗘𝗧𝗔𝗜𝗟𝗘𝗗 𝗗𝗢𝗖𝗨𝗠𝗘𝗡𝗧𝗔𝗧𝗜𝗢𝗡 🟨
~~~~~~~~~~~~~~~~~~~~~~~~~~~~~~~~~~~~~~~~~~~~~~~~~~
~~~~~~~~~~~~~~~~~~~~~~~~~~~~~~~~~~~~~~~~~~~~~~~~~~
🔶 Auto-Updating Option Metrics
~~~~~~~~~~~~~~~~~~~~~~~~~~~~~~~~~~~~~~~~~~~~~~~~~~
~~~~~~~~~~~~~~~~~~~~~~~~~~~~~~~~~~~~~~~~~~~~~~~~~~
🔹 IVR (IV Rank)
The Implied Volatility Rank (IVR) indicator helps options traders assess the current level of implied volatility (IV) in comparison to the past 52 weeks. IVR is a useful metric to determine whether options are relatively cheap or expensive. This can guide traders on whether to buy or sell options. We calculate IVrank, like TastyTrade does.
IVR Calculation: IV Rank = (current IV - 52 week IV low) / (52 week IV high - 52 week IV low)
IVR Levels and Interpretations:
IVR 0-10 (Green): Very low implied volatility rank. Options might be "cheap," potentially a good time to buy options.
IVR 10-35 (White): Normal implied volatility rank. Options pricing is relatively standard.
IVR 35-50 (Orange): Almost high implied volatility rank.
IVR 50-75 (Red): Definitely high implied volatility rank. Options might be "expensive," potentially a good time to sell options for higher premiums.
IVR above 75 (Highlighted Red): Ultra high implied volatility rank. Indicates very high levels, suggesting a favorable time for selling options.
Extra: If the IVx value is also greater than 30, the background will be dark highlighted, because a high IVR alone doesn’t mean much without high IVx.
🔹IVx (Implied Volatility Index)
The Implied Volatility Index (IVx) displayed in the option chain is calculated similarly to the VIX. The Cboe employs standard and weekly SPX options to measure the expected volatility of the S&P 500. A similar method is utilized to calculate IVx for each option expiration cycle.
For our purposes, we aggregate the IVx values specifically for the 35-70 day monthly expiration cycle . This aggregated value is then presented in the screener and info panel, providing a clear and concise measure of implied volatility over this period.
We will display a warning if the option chain is heavily skewed and valid, symmetric 16 delta options are not found at optimal monthly expirations.
IVx Color coding:
IVx above 30 is displayed in orange.
IVx above 60 is displayed in red
Important Note: The IVx value alone does not provide sufficient context. There are stocks that inherently exhibit high IVx values. Therefore, it is crucial to consider IVx in conjunction with the Implied Volatility Rank (IVR), which measures the IVx relative to its own historical values. This combined view helps in accurately assessing the significance of the IVx in relation to the specific stock's typical volatility behavior.
This indicator offers traders a comprehensive view of implied volatility, assisting them in making informed decisions by highlighting both the absolute and relative volatility measures.
🔹IVx 5 days change %
We are displaying the five-day change of the IV Index (IVx value). The IV Index 5-Day Change column provides quick insight into recent expansions or decreases in implied volatility over the last five trading days.
Traders who expect the value of options to decrease might view a decrease in IVX as a positive signal. Strategies such as Strangle and Ratio Spread can benefit from this decrease.
On the other hand, traders anticipating further increases in IVX will focus on the rising IVX values. Strategies like Calendar Spread or Diagonal Spread can take advantage of increasing implied volatility.
This indicator helps traders quickly assess changes in implied volatility, enabling them to make informed decisions based on their trading strategies and market expectations.
🔹 Vertical Pricing Skew
At TanukiTrade, Vertical Pricing Skew refers to the difference in pricing between put and call options with the same expiration date at the same distance (at expected move). We analyze this skew to understand market sentiment. This is the same formula used by TastyTrade for calculations.
PUT Skew (red): Put options are more expensive than call options, indicating the market expects a downward move (▽). If put options are more expensive by more than 20% at the same expected move distance, we color it lighter red.
CALL Skew (green): Call options are more expensive than put options, indicating the market expects an upward move (△). If call options are priced more than 30% higher at the examined expiration, we color it lighter green.
We focus on options with 35-70 days to expiration (DTE) for optimal analysis. We always evaluate the skew at the expected move using linear interpolation to determine the theoretical pricing of options. If the pricing have more than C50%/P35% we are highlighting the cell.
This approach helps us gauge market expectations accurately, providing insights into potential price movements.
🔹 Horizontal IVx Skew
In options pricing, it is typically expected that the implied volatility (IVx) increases for options with later expiration dates. This means that options further out in time are generally more expensive. At TanukiTrade, we refer to the phenomenon where this expectation is reversed—when the IVx decreases between two consecutive expirations—as Horizontal Skew or IVx Skew.
Horizontal IVx Skew occurs when: Front Month IVx < Back Month IVx
This scenario can create opportunities for traders who prefer diagonal or calendar strategies. Based on our experience, we categorize Horizontal Skew into two types:
Weekly Horizontal Skew: When IVx skew is observed between two consecutive non-monthly expirations , the displayed value is the rounded-up percentage difference. On hover, the approximate location of this skew is also displayed. The precise location can be seen on the Overlay indicator.
Monthly Horizontal Skew: When IVx skew is observed between two consecutive monthly expirations , the displayed value is the rounded-up percentage difference. On hover, the approximate location of this skew is also displayed. The precise location can be seen on the Overlay indicator.
The Monthly Vertical IVx skew is consistently stronger (more liquid) on average symbols than the weekly vertical IVx skew. Weekly Horizontal IVx Skew may not carry relevant information for symbols not included in the 'Weeklies & Volume Masters' preset.
If the options chain follows the normal IVx pattern, no skew value is displayed.
Additionally , if the Implied Volatility Rank (IVR) is low (indicated by green), the Horizontal Skew background turns black, because this environment is good for Calendar+Diagonal.
Additionally , if the % of the skew is greater than 10, the Horizontal Skew font color turns lighter.
🔹 Delta Skew 🌪️ (Twist)
We have a metric that examines which monthly expiration indicates a "Delta Skew Twist" where the 16 delta deviates from the monthly STD. This is important because, under normal circumstances, the 16 delta is positioned between the expected move and the standard deviation (STD1) line. However, if the interpolated 16 delta line exceeds the STD1 line either upwards or downwards, it represents a special case of vertical skew.
Normal case : exp.move < delta16 < std1
Delta Skew Twist: exp.move < std1 < delta16
If the Days to Expiration of the twist is less than 75, we use a lighter color.
~~~~~~~~~~~~~~~~~~~~~~~~~~~~~~~~~~~~~~~~~~~~~~~~~~
~~~~~~~~~~~~~~~~~~~~~~~~~~~~~~~~~~~~~~~~~~~~~~~~~~
🔶 HOW WE CALCULATE
~~~~~~~~~~~~~~~~~~~~~~~~~~~~~~~~~~~~~~~~~~~~~~~~~~
~~~~~~~~~~~~~~~~~~~~~~~~~~~~~~~~~~~~~~~~~~~~~~~~~~
🔹 Expected Move
The expected move is the predicted dollar change in the underlying stock's price by a given option's expiration date, with 68% certainty. It is calculated using the expiration's pricing and implied volatility levels.
Expected Move Calculation
Expected Move = (ATM straddle price x 0.6) + (1st OTM strangle price x 0.3) + (2nd OTM strangle price x 0.1)
For example , if stock XYZ is trading at 121 and the ATM straddle is 4.40, the 120/122 strangle is 3.46, and the 119/123 strangle is 2.66, the expected move is calculated as follows: 4.40 x 0.60 = 2.64; 3.46 x 0.30 = 1.04; 2.66 x 0.10 = 0.27; Expected move = 2.64 + 1.04 + 0.27 = ±3.9
🔹 Standard deviation
One standard deviation of a stock encompasses approximately 68.2% of outcomes in a distribution of occurrences based on current implied volatility.
We use the expected move formula to calculate the one standard deviation range of a stock. This calculation is based on the days-to-expiration (DTE) of our option contract, the stock price, and the implied volatility of a stock:
Calculation:
Standard Deviation = Closing Price * Implied Volatility * sqrt(Days to Expiration / 365)
According to options literature, there is a 68% probability that the underlying asset will fall within this one standard deviation range at expiration.
∑ Quant Observation: The values of the expected move and the 1st standard deviation (1STD) will not match because they use different calculation methods, even though both are referred to as representing 68% of the underlying asset's movement in options literature. The expected move is based on direct market pricing of ATM options. The 1STD, on the other hand, uses the averaged implied volatility (IVX) for the given expiration to determine its value. Based on our experience, it is better to consider the area between the expected move and the 1STD as the true representation of the original 68% rule.
~~~~~~~~~~~~~~~~~~~~~~~~~~~~~~~~~~~~~~~~~~~~~~~~~~
~~~~~~~~~~~~~~~~~~~~~~~~~~~~~~~~~~~~~~~~~~~~~~~~~~
🔶 USAGE
~~~~~~~~~~~~~~~~~~~~~~~~~~~~~~~~~~~~~~~~~~~~~~~~~~
~~~~~~~~~~~~~~~~~~~~~~~~~~~~~~~~~~~~~~~~~~~~~~~~~~
🔹 Create a new empty layout for the screener!
You can access this from the dropdown menu in the upper right corner. In the popup window, name it as you like, for example, "Option Screener."
🔹 Hide the candlestick chart
Make the chart invisible using the "Hide" option from the three-dot dropdown menu located in the upper left corner.
🔹 Other Unwanted Elements
If other unnecessary elements are distracting you (e.g., economic data, volume, default grid), you can easily remove them from the layout. Right-click on the empty chart area. Here, click on the gear (Settings) icon and remove everything from the "Events" tab, as well as from the "Trading" tab. Under the "Canvas" tab, it is recommended to set the "Grid lines" setting to "None."
~~~~~~~~~~~~~~~~~~~~~~~~~~~~~~~~~~~~~~~~~~~~~~~~~~
~~~~~~~~~~~~~~~~~~~~~~~~~~~~~~~~~~~~~~~~~~~~~~~~~~
🔶 Screener Settings
~~~~~~~~~~~~~~~~~~~~~~~~~~~~~~~~~~~~~~~~~~~~~~~~~~
~~~~~~~~~~~~~~~~~~~~~~~~~~~~~~~~~~~~~~~~~~~~~~~~~~
Naturally, the font size and position can be easily adjusted.
Additionally, there are two basic usage modes: manual input or using the preset list.
🔹If you selected “Manual Below” in the preset dropdown, the tickers you chose from the dropdown (up to a maximum of 40) will be displayed. The panel name will be the one you specified.
🔹If you selected a pre-assembled list , the manually entered list will be ignored, and the preset list will be displayed. (In the future, we will expand the preset list based on your feedback!).
~~~~~~~~~~~~~~~~~~~~~~~~~~~~~~~~~~~~~~~~~~~~~~~~~~
~~~~~~~~~~~~~~~~~~~~~~~~~~~~~~~~~~~~~~~~~~~~~~~~~~
🔶 Best Practices for TanukiTrade Option Screener:
~~~~~~~~~~~~~~~~~~~~~~~~~~~~~~~~~~~~~~~~~~~~~~~~~~
~~~~~~~~~~~~~~~~~~~~~~~~~~~~~~~~~~~~~~~~~~~~~~~~~~
🔹 Every Preset on a New Layout:
If you following the steps above, you easy can setup this screener in one window with one split layout:
🔹 Split Layout:
- Left Side: The underlying asset with our Options IV Overlay (IVR, Deltas, Expected Move, STD1, Skew visualized) along with the Enhanced Murrey Math Indicator and Option Expiry.
- Right Side: Searching for opportunities using our Options Screener.
Opportunities Search
🔹 Everything in One Layout + One Window:
This is the all-in-one view:
- The underlying asset with our Options IV Overlay (IVR, Deltas, Expected Move, STD1, Skew visualized)
- Enhanced Murrey Math Indicator and Option Expiry
- Options Screener on the left
~~~~~~~~~~~~~~~~~~~~~~~~~~~~~~~~~~~~~~~~
🔶 ADDITIONAL IMPORTANT COMMENTS
- U.S. market only:
Since we only deal with liquid option chains: this option indicator only works for the USA options market and do not include future contracts; we have implemented each selected symbol individually.
- Why is there a slight difference between the displayed data and my live brokerage data? There are two reasons for this, and one is beyond our control.
- Brokerage Calculation Differences:
Every brokerage has slight differences in how they calculate metrics like IV and IVx. If you open three windows for TOS, TastyTrade, and IBKR side by side, you will notice that the values are minimally different. We had to choose a standard, so we use the formulas and mathematical models described by TastyTrade when analyzing the options chain and drawing conclusions.
- Option-data update frequency:
According to TradingView's regulations and guidelines, we can update external data a maximum of 5 times per day. We strive to use these updates in the most optimal way:
(1st update) 15 minutes after U.S. market open
(2nd, 3rd, 4th updates) 1.5–3 hours during U.S. market open hours
(5th update) 10 minutes before market close.
You don’t need to refresh your window, our last refreshed data-pack is always automatically applied to your indicator , and you can see the time elapsed since the last update at the bottom of your indicator.
- Weekly illiquid expiries:
The Weekly Horizontal IVx Skew may not carry relevant information for instruments not included in the 'Weeklies & Volume Masters' preset package.
-Timeframe Issues:
Our option indicator visualizes relevant data on a daily resolution. If you see strange or incorrect data (e.g., when the options data was last updated), always switch to a daily (1D) timeframe. If you still see strange data, please contact us.
Disclaimer:
Our option indicator uses approximately 15min-3 hour delayed option market snapshot data to calculate the main option metrics. Exact realtime option contract prices are never displayed; only derived metrics and interpolated delta are shown to ensure accurate and consistent visualization. Due to the above, this indicator can only be used for decision support; exclusive decisions cannot be made based on this indicator . We reserve the right to make errors.This indicator is designed for options traders who understand what they are doing. It assumes that they are familiar with options and can make well-informed, independent decisions. We work with public data and are not a data provider; therefore, we do not bear any financial or other liability.
Options Overlay [Lite] IVR IV Skew Delta Expmv MurreyMath Expiry𝗡𝗼𝗻-𝗼𝗳𝗳𝗶𝗰𝗶𝗮𝗹 𝗧𝗢𝗦 𝗮𝗻𝗱 𝗧𝗮𝘀𝘁𝘆𝗧𝗿𝗮𝗱𝗲 𝗹𝗶𝗸𝗲 𝗜𝗩𝗥 𝗢𝗽𝘁𝗶𝗼𝗻𝘀 𝘃𝗶𝘀𝘂𝗮𝗹𝗶𝘇𝗮𝘁𝗶𝗼𝗻 𝘁𝗼𝗼𝗹 𝘄𝗶𝘁𝗵 𝗱𝗲𝗹𝗮𝘆𝗲𝗱 𝗼𝗽𝘁𝗶𝗼𝗻 𝗰𝗵𝗮𝗶𝗻 𝗱𝗮𝘁𝗮
Are you an options trader who uses TradingView for technical analysis for the US market?
➡️ Do you want to see the IV Rank of an instrument on TradingView?
➡️ Can’t you check the key options metrics while charting?
➡️ Have you never visualized the options chain before?
➡️ Would you like to see how the IVx has changed for a specific ticker?
If you answered "yes" to any of these questions, then we have the solution for you!
🔃 Auto-Updating Option Metrics without refresh!
🍒 Developed and maintained by option traders for option traders.
📈 Specifically designed for TradingView users who trade options.
Our indicator provides essential key metrics such as:
✅ IVRank
✅ IVx
✅ 5-Day IVx Change
✅ Delta curves and interpolated distances
✅ Expected move curve
✅ Standard deviation (STD1) curve
✅ Vertical Pricing Skew
✅ Horizontal IVx Skew
✅ Delta Skew
like TastyTrade, TOS, IBKR etc, but in a much more visually intuitive way. See detailed descriptions below.
If this isn't enough, we also include a unique grid system designed specifically for options traders. This package features our innovative dynamic grid system:
✅ Enhanced Murrey Math levels (horizontal scale)
✅ Options expirations (vertical scale)
Designed to help you assess market conditions and make well-informed trading decisions, this tool is an essential addition for every serious options trader!
Ticker Information:
This indicator is currently implemented for 5 liquid tickers: NASDAQ:AAPL NASDAQ:AMZN AMEX:DIA NYSE:ORCL and NASDAQ:TSLA
How does the indicator work and why is it unique?
This Pine Script indicator is a complex tool designed to provide various option metrics and visualization tools for options market traders. The indicator extracts raw options data from an external data provider (ORATS), processes and refines the delayed data package using pineseed, and sends it to TradingView, visualizing the data using specific formulas (see detailed below) or interpolated values (e.g., delta distances). This method of incorporating options data into a visualization framework is unique and entirely innovative on TradingView.
The indicator aims to offer a comprehensive view of the current state of options for the implemented instruments, including implied volatility (IV), IV rank (IVR), options skew, and expected market movements, which are objectively measured as detailed below.
The options metrics we display may be familiar to options traders from various major brokerage platforms such as TastyTrade, IBKR, TOS, Tradier, TD Ameritrade, Schwab, etc.
Key Features:
IV Rank (IVR) : The implied volatility rank compares the current IV to the lowest and highest values over the past 52 weeks. The IVR indicator helps determine whether options are relatively cheap or expensive.
IV Average (IVx) : The implied volatility displayed in the options chain, calculated similarly to the VIX. IVx values are aggregated within the 35-70 day expiration cycle.
IV Change (5 days) : The change in implied volatility over the past five trading days. This indicator provides a quick insight into the recent changes in IV.
Expected Move (Exp. Move) : The expected movement for the options expiration cycle, calculated using the price of the ATM (at-the-money) straddle, the first OTM (out-of-the-money) strangle, and the second OTM strangle.
Options Skew : The price difference between put and call options with the same expiration date. Vertical and horizontal skew indicators help understand market sentiment and potential price movements.
Visualization Tools:
Informational IVR Panel : A tabular display mode that presents the selected indicators on the chart. The panel’s placement, size, and content are customizable, including color and tooltip settings.
1 STD, Delta, and Expected Move : Visualization of fundamental classic options metrics corresponding to expirations with bell curves.
Colored Label Tooltips : Detailed tooltips above the bell curves showing options metrics for each expiration.
Adaptive Murrey Math Lines : A horizontal line system based on the principles of Murrey Math Lines, helping identify important price levels and market structures.
Expiration Lines : Displays both monthly and weekly options expirations. The indicator supports various color and style settings, as well as the regulation of the number of expirations displayed.
🟨 𝗗𝗘𝗧𝗔𝗜𝗟𝗘𝗗 𝗗𝗢𝗖𝗨𝗠𝗘𝗡𝗧𝗔𝗧𝗜𝗢𝗡 🟨
🔶 Auto-Updating Option Metrics and Curved Lines
🔹 Interpolated DELTA Curves (16,20,25,30,40)
In our indicator, the curve layer settings allow you to choose the delta value for displaying the delta curve: 16, 20, 25, 30, or even 40. The color of the curve can be customized, and you can also hide the delta curve by selecting the "-" option.
It's important to mention that we display interpolated deltas from the actual option chain of the underlying asset using the Black-Scholes model. This ensures that the 16 delta truly reflects the theoretical, but accurate, 16 delta distance. (For example, deltas shown by brokerages for individual strikes are rounded; a 0.16 delta might actually be 0.1625.)
🔹 Expected Move Curve (Exp.mv)
The expected move is the predicted dollar change in the underlying stock's price by a given option's expiration date, with 68% certainty. It is calculated using the expiration's pricing and implied volatility levels. We chose the TastyTrade method for calculating expected move, as we found it to be the most expressive.
Expected Move Calculation
Expected Move = (ATM straddle price x 0.6) + (1st OTM strangle price x 0.3) + (2nd OTM strangle price x 0.1)
For example , if stock XYZ is trading at 121 and the ATM straddle is 4.40, the 120/122 strangle is 3.46, and the 119/123 strangle is 2.66, the expected move is calculated as follows: 4.40 x 0.60 = 2.64; 3.46 x 0.30 = 1.04; 2.66 x 0.10 = 0.27; Expected move = 2.64 + 1.04 + 0.27 = ±3.9
In this example below, the TastyTrade platform indicates the expected move on the option chain with a brown color, and the exact value is displayed behind the ± symbol for each expiration. By default, we also use brown for this indication, but this can be changed or the curve display can be turned off.
🔹 Standard Deviation Curve (1 STD)
One standard deviation of a stock encompasses approximately 68.2% of outcomes in a distribution of occurrences based on current implied volatility.
We use the expected move formula to calculate the one standard deviation range of a stock. This calculation is based on the days-to-expiration (DTE) of our option contract, the stock price, and the implied volatility of a stock:
Calculation:
Standard Deviation = Closing Price * Implied Volatility * sqrt(Days to Expiration / 365)
According to options literature, there is a 68% probability that the underlying asset will fall within this one standard deviation range at expiration.
If the 1 STD and Exp.mv displays are both enabled, the indicator fills the area between them with a light gray color. This is because both represent probability distributions that appear as a "bell curve" when graphed, making it visually appealing.
Tip and Note:
The 1 STD line might appear jagged at times , which does not indicate a problem with the indicator. This is normal immediately after market open (e.g., during the first data refresh of the day) or if the expirations are illiquid (e.g., weekly expirations). The 1 STD value is calculated based on the aggregated IVx for the expirations, and the aggregated IVx value for weekly expirations updates less frequently due to lower trading volume. In such cases, we recommend enabling the "Only Monthly Expirations" option to smooth out the bell curve.
∑ Quant Observation:
The values of the expected move and the 1st standard deviation (1STD) will not match because they use different calculation methods, even though both are referred to as representing 68% of the underlying asset's movement in options literature. The expected move is based on direct market pricing of ATM options. The 1STD, on the other hand, uses the averaged implied volatility (IVX) for the given expiration to determine its value. Based on our experience, it is better to consider the area between the expected move and the 1STD as the true representation of the original 68% rule.
🔶 IVR Dashboard Panel Rows
🔹 IVR (IV Rank)
The Implied Volatility Rank (IVR) indicator helps options traders assess the current level of implied volatility (IV) in comparison to the past 52 weeks. IVR is a useful metric to determine whether options are relatively cheap or expensive. This can guide traders on whether to buy or sell options. We calculate IVrank, like TastyTrade does.
IVR Calculation:
IV Rank = (current IV - 52 week IV low) / (52 week IV high - 52 week IV low)
IVR Levels and Interpretations:
IVR 0-10 (Green): Very low implied volatility rank. Options might be "cheap," potentially a good time to buy options.
IVR 10-35 (White): Normal implied volatility rank. Options pricing is relatively standard.
IVR 35-50 (Orange): Almost high implied volatility rank.
IVR 50-75 (Red): Definitely high implied volatility rank. Options might be "expensive," potentially a good time to sell options for higher premiums.
IVR above 75 (Highlighted Red): Ultra high implied volatility rank. Indicates very high levels, suggesting a favorable time for selling options.
The panel refreshes automatically if the symbol is implemented. You can hide the panel or change the position and size.
🔹IVx (Implied Volatility Index)
The Implied Volatility Index (IVx) displayed in the option chain is calculated similarly to the VIX. The Cboe uses standard and weekly SPX options to measure the expected volatility of the S&P 500. A similar method is utilized to calculate IVx for each option expiration cycle.
For our purposes on the IVR Panel, we aggregate the IVx values specifically for the 35-70 day monthly expiration cycle . This aggregated value is then presented in the screener and info panel, providing a clear and concise measure of implied volatility over this period.
IVx Color coding:
IVx above 30 is displayed in orange.
IVx above 60 is displayed in red
IVx on curve:
The IVx values for each expiration can be viewed by hovering the mouse over the colored tooltip labels above the Curve.
IVx avg on IVR panel :
If the option is checked in the IVR panel settings, the IVR panel will display the average IVx values up to the optimal expiration.
Important Note:
The IVx value alone does not provide sufficient context. There are stocks that inherently exhibit high IVx values. Therefore, it is crucial to consider IVx in conjunction with the Implied Volatility Rank (IVR), which measures the IVx relative to its own historical values. This combined view helps in accurately assessing the significance of the IVx in relation to the specific stock's typical volatility behavior.
This indicator offers traders a comprehensive view of implied volatility, assisting them in making informed decisions by highlighting both the absolute and relative volatility measures.
🔹IVx 5 days change %
We are displaying the five-day change of the IV Index (IVx value). The IV Index 5-Day Change column provides quick insight into recent expansions or decreases in implied volatility over the last five trading days.
Traders who expect the value of options to decrease might view a decrease in IVX as a positive signal. Strategies such as Strangle and Ratio Spread can benefit from this decrease.
On the other hand, traders anticipating further increases in IVX will focus on the rising IVX values. Strategies like Calendar Spread or Diagonal Spread can take advantage of increasing implied volatility.
This indicator helps traders quickly assess changes in implied volatility, enabling them to make informed decisions based on their trading strategies and market expectations.
🔹 Vertical Pricing Skew
At TanukiTrade, Vertical Pricing Skew refers to the difference in pricing between put and call options with the same expiration date at the same distance (at expected move). We analyze this skew to understand market sentiment. This is the same formula used by TastyTrade for calculations.
We calculate the interpolated strike price based on the expected move , taking into account the neighboring option prices and their distances. This allows us to accurately determine whether the CALL or PUT options are more expensive.
PUT Skew (red): Put options are more expensive than call options, indicating the market expects a downward move (▽). If put options are more expensive by more than 20% at the same expected move distance, we color it lighter red.
CALL Skew (green): Call options are more expensive than put options, indicating the market expects an upward move (△). If call options are priced more than 30% higher at the examined expiration, we color it lighter green.
Vertical Skew on Curve:
The degree of vertical pricing skew for each expiration can be viewed by hovering over the points above the curve. Hover with mouse for more information.
Vertical Skew on IVR panel:
We focus on options with 35-70 days to expiration (DTE) for optimal analysis in case of vertical skew. Hover with mouse for more information.
This approach helps us gauge market expectations accurately, providing insights into potential price movements. Remember, we always evaluate the skew at the expected move using linear interpolation to determine the theoretical pricing of options.
🔹 Delta Skew 🌪️ (Twist)
We have a new metric that examines which monthly expiration indicates a "Delta Skew Twist" where the 16 delta deviates from the monthly STD. This is important because, under normal circumstances, the 16 delta is positioned between the expected move and the standard deviation (STD1) line (see Exp.mv & 1STD exact definitions above). However, if the interpolated 16 delta line exceeds the STD1 line either upwards or downwards, it represents a special case of vertical skew on the option chain.
Normal case : exp.move < delta16 < std1
Delta Skew Twist: exp.move < std1 < delta16
We indicate this with direction-specific colors (red/green) on the delta line. We also color the section of the delta curve affected by the delta skew in this case, even if you choose to display a lower delta, such as 30, instead of 16.
If "Colored Labels with Tooltips" is enabled, we also display a 🌪️ symbol in the tooltip for the expirations affected by Delta Skew.
If you have enabled the display of 'Vertical Pricing Skew' on the IVR Panel, a 🌪️ symbol will also appear next to the value of the vertical skew, and the tooltip will indicate from which expiration Delta Skew is observed.
🔹 Horizontal IVx Skew
In options pricing, it is typically expected that the implied volatility (IVx) increases for options with later expiration dates. This means that options further out in time are generally more expensive. At TanukiTrade, we refer to the phenomenon where this expectation is reversed—when the IVx decreases between two consecutive expirations—as Horizontal Skew or IVx Skew.
Horizontal IVx Skew occurs when: Front Expiry IVx < Back Expiry IVx
This scenario can create opportunities for traders who prefer diagonal or calendar strategies . Based on our experience, we categorize Horizontal Skew into two types:
Weekly Horizontal Skew:
When IVx skew is observed between two consecutive non-monthly expirations, the displayed value is the rounded-up percentage difference. On hover, the approximate location of this skew is also displayed. The precise location can be seen on this indicator.
Monthly Horizontal Skew:
When IVx skew is observed between two consecutive monthly expirations , the displayed value is the rounded-up percentage difference. On hover, the approximate location of this skew is also displayed. The precise location can be seen on our Overlay indicator.
The Monthly Vertical IVx skew is consistently more liquid than the weekly vertical IVx skew. Weekly Horizontal IVx Skew may not carry relevant information for symbols not included in the 'Weeklies & Volume Masters' preset in our Options Screener indicator.
If the options chain follows the normal IVx pattern, no skew value is displayed.
Color codes or tooltip labels above curve:
Gray - No horizontal skew;
Purple - Weekly horizontal skew;
BigBlue - Monthly horizontal skew
The display of monthly and weekly IVx skew can be toggled on or off on the IVR panel. However, if you want to disable the colored tooltips above the curve, this can only be done using the "Colored labels with tooltips" switch.
We indicate this range with colorful information bubbles above the upper STD line.
🔶 The Option Trader’s GRID System: Adaptive MurreyMath + Expiry Lines
At TanukiTrade, we utilize Enhanced MurreyMath and Expiry lines to create a dynamic grid system, unlike the basic built-in vertical grids in TradingView, which provide no insight into specific price levels or option expirations.
These grids are beneficial because they provide a structured layout, making important price levels visible on the chart. The grid automatically resizes as the underlying asset's volatility changes, helping traders identify expected movements for various option expirations.
The Option Trader’s GRID System part of this indicator can be used without limitations for all instruments . There are no type or other restrictions, and it automatically scales to fit every asset. Even if we haven't implemented the option metrics for a particular underlying asset, the GRID system will still function!
🔹 SETUP OF YOUR OPTIONS GRID SYSTEM
You can setup your new grid system in 3 easy steps!
STEP1: Hide default horizontal grid lines in TradingView
Right-click on an empty area of your chart, then select “Settings.” In the Chart settings -> Canvas -> Grid lines section, disable the display of horizontal lines to avoid distraction.
SETUP STEP2: Scaling fix
Right-click on the price scale on the right side, then select "Scale price chart only" to prevent the chart from scaling to the new horizontal lines!
STEP3: Enable Tanuki Options Grid
As a final step, make sure that both the vertical (MurreyMath) and horizontal (Expiry) lines are enabled in the Grid section of our indicator.
You are done, enjoy the new grid system!
🔹 HORIZONTAL: Enhanced MurreyMath Lines
Murrey Math lines are based on the principles observed by William Gann, renowned for his market symmetry forecasts. Gann's techniques, such as Gann Angles, have been adapted by Murrey to make them more accessible to ordinary investors. According to Murrey, markets often correct at specific price levels, and breakouts or returns to these levels can signal good entry points for trades.
At TanukiTrade, we enhance these price levels based on our experience , ensuring a clear display. We acknowledge that while MurreyMath lines aren't infallible predictions, they are useful for identifying likely price movements over a given period (e.g., one month) if the market trend aligns.
Our opinion: MurreyMath lines are not crystal balls (like no other tool). They should be used to identify that if we are trading in the right direction, the price is likely to reach the next unit step within a unit time (e.g. monthly expiration).
One unit step is the distance between Murrey Math lines, such as between the 0/8 and 1/8 lines. This interval helps identify different quadrants and is crucial for recognizing support and resistance levels.
Some option traders use Murrey Math lines to gauge the movement speed of an instrument over a unit time. A quadrant encompasses 4 unit steps.
Key levels, according to TanukiTrade, include:
Of course, the lines can be toggled on or off, and their default color can also be changed.
🔹 VERTICAL: Expiry Lines
The indicator can display monthly and weekly expirations as dashed lines, with customizable colors. Weekly expirations will always appear in a lighter shade compared to monthly expirations.
Monthly Expiry Lines:
You can turn off the lines indicating monthly expirations, or set the direction (past/future/both) and the number of lines to be drawn.
Weekly Expiry Lines:
You can display weekly expirations pointing to the future. You can also turn them off or specify how many weeks ahead the lines should be drawn.
Of course, the lines can be toggled on or off, and their default color can also be changed.
TIP: Hide default vertical grid lines in TradingView
Right-click on an empty area of your chart, then select “Settings.” In the Chart settings -> Canvas -> Grid lines section, disable the display of vertical lines to avoid distraction. Same, like steps above at MurreyMath lines.
🔶 ADDITIONAL IMPORTANT COMMENTS
- U.S. market only:
Since we only deal with liquid option chains: this option indicator only works for the USA options market and do not include future contracts; we have implemented each selected symbol individually.
- Why is there a slight difference between the displayed data and my live brokerage data? There are two reasons for this, and one is beyond our control.
- Brokerage Calculation Differences:
Every brokerage has slight differences in how they calculate metrics like IV and IVx. If you open three windows for TOS, TastyTrade, and IBKR side by side, you will notice that the values are minimally different. We had to choose a standard, so we use the formulas and mathematical models described by TastyTrade when analyzing the options chain and drawing conclusions.
- Option-data update frequency:
According to TradingView's regulations and guidelines, we can update external data a maximum of 5 times per day. We strive to use these updates in the most optimal way:
(1st update) 15 minutes after U.S. market open
(2nd, 3rd, 4th updates) 1.5–3 hours during U.S. market open hours
(5th update) 10 minutes before market close.
You don’t need to refresh your window, our last refreshed data-pack is always automatically applied to your indicator , and you can see the time elapsed since the last update at the bottom of your indicator.
- Skewed Curves:
The delta, expected move, and standard deviation curves also appear relevantly on a daily or intraday timeframe. Data loss is experienced above a daily timeframe: this is a TradingView limitation.
- Weekly illiquid expiries:
Especially for instruments where weekly options are illiquid: the weekly expiration STD1 data is not relevant. In these cases, we recommend checking in the "Display only Monthly labels" checkbox to avoid displaying not relevant weekly options expirations.
-Timeframe Issues:
Our option indicator visualizes relevant data on a daily resolution. If you see strange or incorrect data (e.g., when the options data was last updated), always switch to a daily (1D) timeframe. If you still see strange data, please contact us.
Disclaimer:
Our option indicator uses approximately 15min-3 hour delayed option market snapshot data to calculate the main option metrics. Exact realtime option contract prices are never displayed; only derived metrics and interpolated delta are shown to ensure accurate and consistent visualization. Due to the above, this indicator can only be used for decision support; exclusive decisions cannot be made based on this indicator . We reserve the right to make errors.This indicator is designed for options traders who understand what they are doing. It assumes that they are familiar with options and can make well-informed, independent decisions. We work with public data and are not a data provider; therefore, we do not bear any financial or other liability.
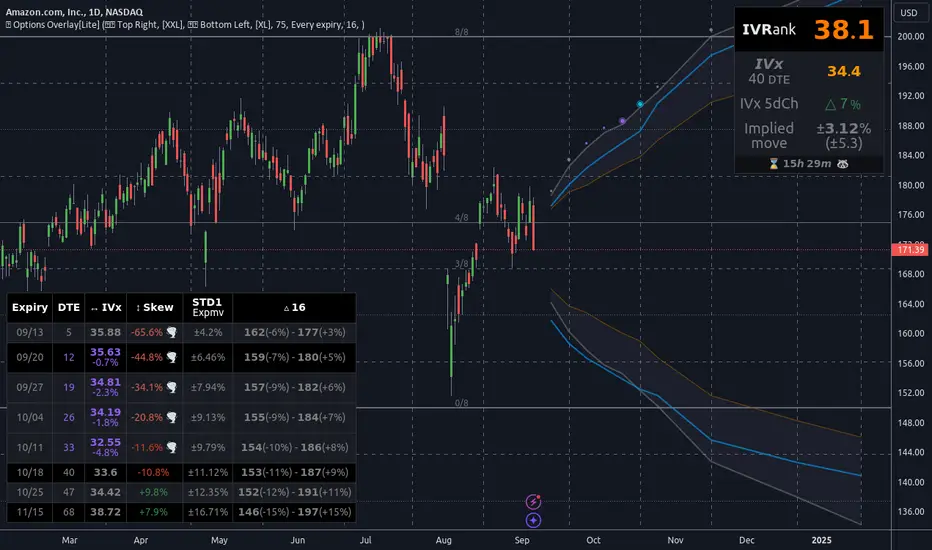
MeanReversion - LogReturn/Vola ZScoreShows the z-Score of log-return (blue line) and volatility (black line). In statistics, the z-score is the number of standard deviations by which a value of a raw score is above or below the mean value.
This indicator aggregates z-score based on two indicators:
MeanReversion by Logarithmic Returns
MeanReversion by Volatility
Change the time period in bars for longer or shorter time frames. At a daily chart 252 mean on trading year, 21 mean one trading month.

Rectified BB% for option tradingThis indicator shows the bollinger bands against the price all expressed in percentage of the mean BB value. With one sight you can see the amplitude of BB and the variation of the price, evaluate a reenter of the price in the BB.
The relative price is visualized as a candle with open/high/low/close value exspressed as percentage deviation from the BB mean
The indicator include a modified RSI, remapped from 0/100 to -100/100.
You can choose the BB parameters (length, standard deviation multiplier) and the RSI parameter (length, overbougth threshold, ovrsold threshold)
You can exclude/include the candles and the RSI line.
The indicator can be used to sell options when the volatility is high (the bollinger band is wide) and the price is reentering inside the bands.
If the price is forming a supply or demand area it can be a good opportunity to sell a bull put or a bear call
The RSI can be used as confirm of the supply/demand formation
If the bollinger band is narrow and the RSI is overbought/oversold it indicate a better opportunity to buy options
the indicator is designed to work with daily timeframe and default parameters.

Ichimoku Z-Score Stochastic Oscillator with Kumo Depth Analysis---
Ichimoku Z-Score Stochastic Oscillator with Kumo Depth Analysis
---
Script Overview
Welcome to the Advanced Ichimoku Z-Score Stochastic Oscillator with Kumo Depth Analysis. This unique strategy is designed to provide a comprehensive, multi-timeframe trading view by leveraging the Ichimoku Cloud, Z-Score, Stochastic Oscillator, and an innovative implied volatility measure – the Kumo Depth. By integrating these powerful tools into one script, traders can make more informed decisions by considering trend strength, volatility, and volume in one holistic view.
Rationale & Strategy
The script was created with the rationale that trading decisions should not only be based on price action and volume, but also on market trend strength and implied volatility. The script integrates these various elements:
The Ichimoku Cloud, a versatile indicator that provides support and resistance levels, trend direction, and momentum all at once.
The Z-Score, a statistical measurement of a value's relationship to the mean (average) of a group of values.
The Stochastic Oscillator, a momentum indicator that uses support and resistance levels to determine probable trend reversals.
The Kumo Depth Analysis, an innovative measure of implied volatility and market trend strength derived from the thickness of the Ichimoku Cloud.
How It Works
This script works by providing visual buy and sell signals based on the confluence of the aforementioned tools.
Ichimoku Cloud and Z-Score: The script first calculates the Ichimoku Cloud lines for both a higher and lower timeframe and measures how much current prices deviate from the cloud using Z-Score.
Stochastic Oscillator: This Z-Score is then inputted into a Stochastic Oscillator, thus giving the oscillator a more normalized range.
Kumo Depth Analysis: Simultaneously, the thickness of the Ichimoku Cloud (Kumo) is calculated as an implied volatility indicator. This depth is normalized and used as a filter to ensure we are trading in a market with substantial trend strength.
Signals: Buy and sell signals are triggered based on the crossover and crossunder of the Stochastic Oscillator lines. Signals are then filtered based on their location relative to the Ichimoku Cloud (price should be above the cloud for buy signals and below for sell signals) and the normalized Kumo Depth.
How to Use
Signal Types: The script provides both strong and weak signals. Strong signals are accompanied by high volume, while weak signals are not. Strong buy signals are indicated with a green triangle at the top, strong sell signals with a red triangle at the bottom. Weak signals are shown as blue and yellow circles, respectively.
Trend Strength: The trend strength is shown by the normalized Kumo Depth. The greater the Kumo Depth, the stronger the trend.
Timeframes: You can customize the timeframes used for the calculations in the input settings.
Adjustments: Users can adjust parameters such as the Ichimoku settings, Stochastic Oscillator settings, timeframes, and Kumo Depth settings to suit their trading style and the characteristics of the asset they are trading.
This script is a complete trading strategy tool providing multi-timeframe, trend-following, and volume-based signals. It's best suited for traders who understand the concepts of trend trading, stochastic oscillators, and volatility measures and want to incorporate them all into one powerful, comprehensive trading strategy.

VolatilityCone by ImpliedVolatilityThis volatility cone draws the implied volatility as standard deviations from a measurement date.
For best results set measurement date to high volume bars.
How to use:
1) Select VolatilityCone from Indicators
2) Click to the chart to set the measurement date
3) Determine the impliedvolatility for the measurement date of your symbol
e.g.
For S&P500 use VIX value at measurement date for implied volatility

Integrated Implied Volatility C/FThe integrated version of IV CAP/FLOOR Premium and Bitcoin IV C/F.
Illustrating Cap-Floor bands based on statistical calculations using the implied volatility of Bitcoin, foreign currency pairs, commodities, bonds, and indexes.

Implied Volatility Suite (TG Fork)Displays the Implied Volatility, which is usually calculated from options, but here is calculated indirectly from spot price directly, either using a model or model-free using the VIXfix.
The model-free VIXfix based approach can detect times of high volatility, which usually coincides with panic and hence lowest prices. Inversely, the model-based approach can detect times of highest greed.
Forked and updated by Tartigradia to fix some issues in the calculations, convert to pinescript v5 and reverse engineered to reproduce the "Implied Volatility Rank & Model Free IVR" indicator by the same author (but closed source) and allow to plot both model-based and model-free implied volatilities simultaneously.
If you like this indicator, please show the original author SegaRKO some love:
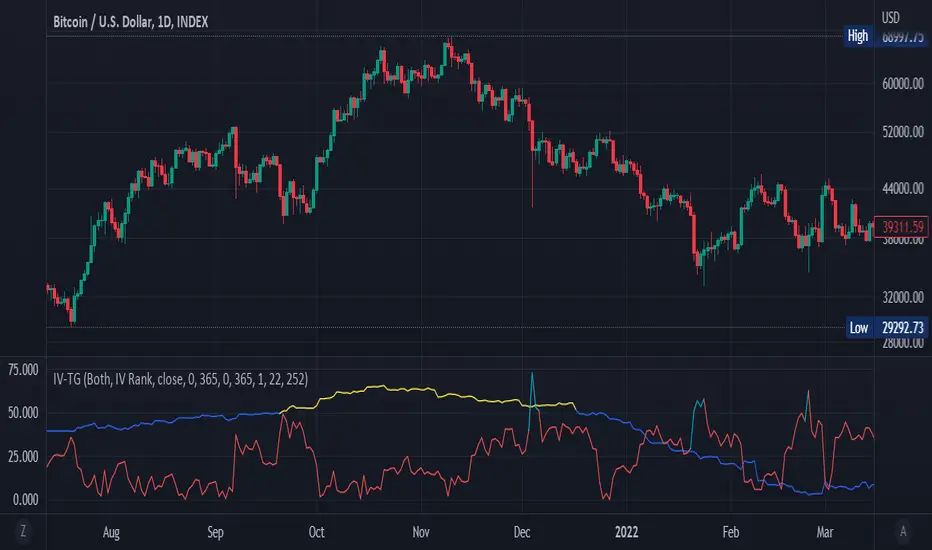
Implied Move with NASA Ideas & Price LineThis script allows you to customize the Implied Move Percentage and fully customize the way it is shown.
Can be used on any stock that has earnings and works based on the Implied Move (Percent).
Basically, it lets you visualize how the stock moved after reporting earnings and seeing if it reached the implied move or not.
This is helpful as it's important to know what earnings are worth keeping an eye on and which should be avoided.
There is also an added custom text input which was inspired to make from a frogman named NASA.
It lets you input whatever text you want on whatever price you want.
To summarize, it's basically a Post-It Note that you can add to any price level for any stock.
Alerts can be set if wanted, They can be alerted for the Implied Moves (If the stock price goes Above/ Below the set percentage) and NASA Ideas (if the stock price goes Above/ Below the set price).
There is also an added custom price line which is mostly for having a nonintrusive price line and label.
This price line and label can be switched to show the (Open, High, Low, Close, Extended High, Extended Low, Yesterday's Open, Yesterday's High, Yesterday's Low, and Yesterday's Close).

Asay (1982) Margined Futures Option Pricing Model [Loxx]Asay (1982) Margined Futures Option Pricing Model is an adaptation of the Black-Scholes-Merton Option Pricing Model including Analytical Greeks and implied volatility calculations. The following information is an excerpt from Espen Gaarder Haug's book "Option Pricing Formulas". This version is to price Options on Futures where premium is fully margined. This means the Risk-free Rate, dividend, and cost to carry are all zero. The options sensitivities (Greeks) are the partial derivatives of the Black-Scholes-Merton ( BSM ) formula. Analytical Greeks for our purposes here are broken down into various categories:
Delta Greeks: Delta, DDeltaDvol, Elasticity
Gamma Greeks: Gamma, GammaP, DGammaDvol, Speed
Vega Greeks: Vega , DVegaDvol/Vomma, VegaP
Theta Greeks: Theta
Probability Greeks: StrikeDelta, Risk Neutral Density
(See the code for more details)
Black-Scholes-Merton Option Pricing
The Black-Scholes-Merton model can be "generalized" by incorporating a cost-of-carry rate b. This model can be used to price European options on stocks, stocks paying a continuous dividend yield, options on futures , and currency options:
c = S * e^((b - r) * T) * N(d1) - X * e^(-r * T) * N(d2)
p = X * e^(-r * T) * N(-d2) - S * e^((b - r) * T) * N(-d1)
where
d1 = (log(S / X) + (b + v^2 / 2) * T) / (v * T^0.5)
d2 = d1 - v * T^0.5
b = r ... gives the Black and Scholes (1973) stock option model.
b = r — q ... gives the Merton (1973) stock option model with continuous dividend yield q.
b = 0 ... gives the Black (1976) futures option model.
b = 0 and r = 0 ... gives the Asay (1982) margined futures option model. <== this is the one used for this indicator!
b = r — rf ... gives the Garman and Kohlhagen (1983) currency option model.
Inputs
S = Stock price.
X = Strike price of option.
T = Time to expiration in years.
r = Risk-free rate
d = dividend yield
v = Volatility of the underlying asset price
cnd (x) = The cumulative normal distribution function
nd(x) = The standard normal density function
convertingToCCRate(r, cmp ) = Rate compounder
gImpliedVolatilityNR(string CallPutFlag, float S, float x, float T, float r, float b, float cm , float epsilon) = Implied volatility via Newton Raphson
gBlackScholesImpVolBisection(string CallPutFlag, float S, float x, float T, float r, float b, float cm ) = implied volatility via bisection
Implied Volatility: The Bisection Method
The Newton-Raphson method requires knowledge of the partial derivative of the option pricing formula with respect to volatility ( vega ) when searching for the implied volatility . For some options (exotic and American options in particular), vega is not known analytically. The bisection method is an even simpler method to estimate implied volatility when vega is unknown. The bisection method requires two initial volatility estimates (seed values):
1. A "low" estimate of the implied volatility , al, corresponding to an option value, CL
2. A "high" volatility estimate, aH, corresponding to an option value, CH
The option market price, Cm , lies between CL and cH . The bisection estimate is given as the linear interpolation between the two estimates:
v(i + 1) = v(L) + (c(m) - c(L)) * (v(H) - v(L)) / (c(H) - c(L))
Replace v(L) with v(i + 1) if c(v(i + 1)) < c(m), or else replace v(H) with v(i + 1) if c(v(i + 1)) > c(m) until |c(m) - c(v(i + 1))| <= E, at which point v(i + 1) is the implied volatility and E is the desired degree of accuracy.
Implied Volatility: Newton-Raphson Method
The Newton-Raphson method is an efficient way to find the implied volatility of an option contract. It is nothing more than a simple iteration technique for solving one-dimensional nonlinear equations (any introductory textbook in calculus will offer an intuitive explanation). The method seldom uses more than two to three iterations before it converges to the implied volatility . Let
v(i + 1) = v(i) + (c(v(i)) - c(m)) / (dc / dv (i))
until |c(m) - c(v(i + 1))| <= E at which point v(i + 1) is the implied volatility , E is the desired degree of accuracy, c(m) is the market price of the option, and dc/ dv (i) is the vega of the option evaluaated at v(i) (the sensitivity of the option value for a small change in volatility ).
Things to know
Only works on the daily timeframe and for the current source price.
You can adjust the text size to fit the screen
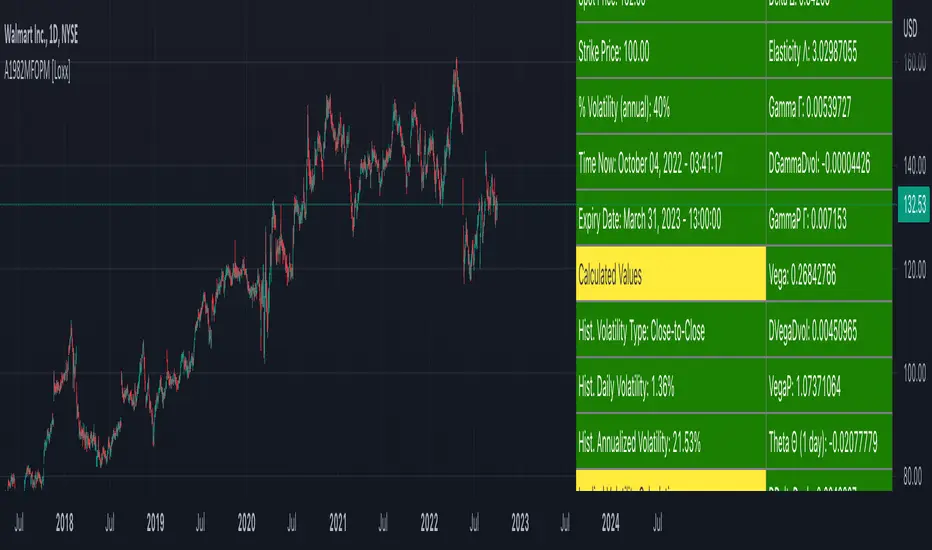
Black-76 Options on Futures [Loxx]Black-76 Options on Futures is an adaptation of the Black-Scholes-Merton Option Pricing Model including Analytical Greeks and implied volatility calculations. The following information is an excerpt from Espen Gaarder Haug's book "Option Pricing Formulas". This version is to price Options on Futures. The options sensitivities (Greeks) are the partial derivatives of the Black-Scholes-Merton ( BSM ) formula. Analytical Greeks for our purposes here are broken down into various categories:
Delta Greeks: Delta, DDeltaDvol, Elasticity
Gamma Greeks: Gamma, GammaP, DGammaDvol, Speed
Vega Greeks: Vega , DVegaDvol/Vomma, VegaP
Theta Greeks: Theta
Rate/Carry Greeks: Rho futures option
Probability Greeks: StrikeDelta, Risk Neutral Density
(See the code for more details)
Black-Scholes-Merton Option Pricing
The Black-Scholes-Merton model can be "generalized" by incorporating a cost-of-carry rate b. This model can be used to price European options on stocks, stocks paying a continuous dividend yield, options on futures , and currency options:
c = S * e^((b - r) * T) * N(d1) - X * e^(-r * T) * N(d2)
p = X * e^(-r * T) * N(-d2) - S * e^((b - r) * T) * N(-d1)
where
d1 = (log(S / X) + (b + v^2 / 2) * T) / (v * T^0.5)
d2 = d1 - v * T^0.5
b = r ... gives the Black and Scholes (1973) stock option model.
b = r — q ... gives the Merton (1973) stock option model with continuous dividend yield q.
b = 0 ... gives the Black (1976) futures option model. <== this is the one used for this indicator!
b = 0 and r = 0 ... gives the Asay (1982) margined futures option model.
b = r — rf ... gives the Garman and Kohlhagen (1983) currency option model.
Inputs
S = Stock price.
X = Strike price of option.
T = Time to expiration in years.
r = Risk-free rate
d = dividend yield
v = Volatility of the underlying asset price
cnd (x) = The cumulative normal distribution function
nd(x) = The standard normal density function
convertingToCCRate(r, cmp ) = Rate compounder
gImpliedVolatilityNR(string CallPutFlag, float S, float x, float T, float r, float b, float cm , float epsilon) = Implied volatility via Newton Raphson
gBlackScholesImpVolBisection(string CallPutFlag, float S, float x, float T, float r, float b, float cm ) = implied volatility via bisection
Implied Volatility: The Bisection Method
The Newton-Raphson method requires knowledge of the partial derivative of the option pricing formula with respect to volatility ( vega ) when searching for the implied volatility . For some options (exotic and American options in particular), vega is not known analytically. The bisection method is an even simpler method to estimate implied volatility when vega is unknown. The bisection method requires two initial volatility estimates (seed values):
1. A "low" estimate of the implied volatility , al, corresponding to an option value, CL
2. A "high" volatility estimate, aH, corresponding to an option value, CH
The option market price, Cm , lies between CL and cH . The bisection estimate is given as the linear interpolation between the two estimates:
v(i + 1) = v(L) + (c(m) - c(L)) * (v(H) - v(L)) / (c(H) - c(L))
Replace v(L) with v(i + 1) if c(v(i + 1)) < c(m), or else replace v(H) with v(i + 1) if c(v(i + 1)) > c(m) until |c(m) - c(v(i + 1))| <= E, at which point v(i + 1) is the implied volatility and E is the desired degree of accuracy.
Implied Volatility: Newton-Raphson Method
The Newton-Raphson method is an efficient way to find the implied volatility of an option contract. It is nothing more than a simple iteration technique for solving one-dimensional nonlinear equations (any introductory textbook in calculus will offer an intuitive explanation). The method seldom uses more than two to three iterations before it converges to the implied volatility . Let
v(i + 1) = v(i) + (c(v(i)) - c(m)) / (dc / dv (i))
until |c(m) - c(v(i + 1))| <= E at which point v(i + 1) is the implied volatility , E is the desired degree of accuracy, c(m) is the market price of the option, and dc/ dv (i) is the vega of the option evaluaated at v(i) (the sensitivity of the option value for a small change in volatility ).
Things to know
Only works on the daily timeframe and for the current source price.
You can adjust the text size to fit the screen
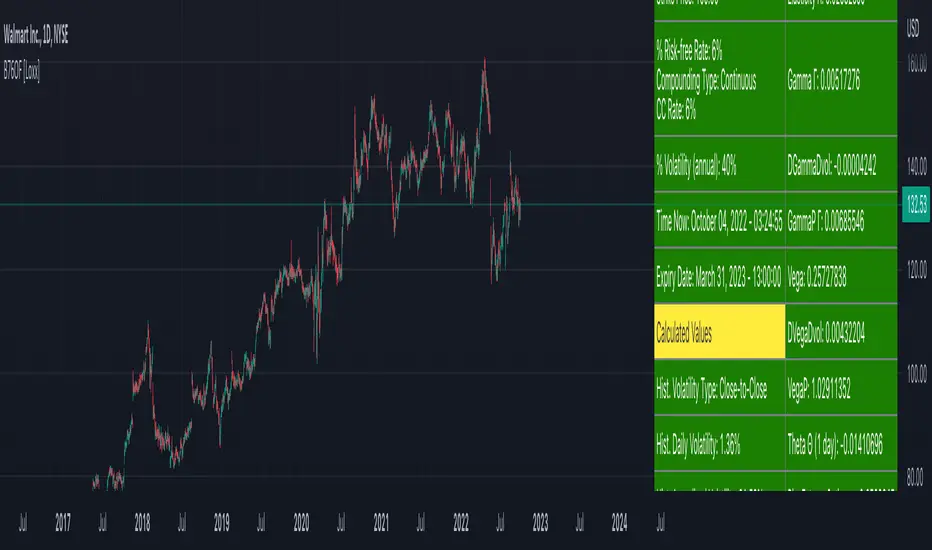
Garman and Kohlhagen (1983) for Currency Options [Loxx]Garman and Kohlhagen (1983) for Currency Options is an adaptation of the Black-Scholes-Merton Option Pricing Model including Analytical Greeks and implied volatility calculations. The following information is an excerpt from Espen Gaarder Haug's book "Option Pricing Formulas". This version of BSMOPM is to price Currency Options. The options sensitivities (Greeks) are the partial derivatives of the Black-Scholes-Merton ( BSM ) formula. Analytical Greeks for our purposes here are broken down into various categories:
Delta Greeks: Delta, DDeltaDvol, Elasticity
Gamma Greeks: Gamma, GammaP, DGammaDSpot/speed, DGammaDvol/Zomma
Vega Greeks: Vega , DVegaDvol/Vomma, VegaP, Speed
Theta Greeks: Theta
Rate/Carry Greeks: Rho, Rho futures option, Carry Rho, Phi/Rho2
Probability Greeks: StrikeDelta, Risk Neutral Density
(See the code for more details)
Black-Scholes-Merton Option Pricing for Currency Options
The Garman and Kohlhagen (1983) modified Black-Scholes model can be used to price European currency options; see also Grabbe (1983). The model is mathematically equivalent to the Merton (1973) model presented earlier. The only difference is that the dividend yield is replaced by the risk-free rate of the foreign currency rf:
c = S * e^(-rf * T) * N(d1) - X * e^(-r * T) * N(d2)
p = X * e^(-r * T) * N(-d2) - S * e^(-rf * T) * N(-d1)
where
d1 = (log(S / X) + (r - rf + v^2 / 2) * T) / (v * T^0.5)
d2 = d1 - v * T^0.5
For more information on currency options, see DeRosa (2000)
Inputs
S = Stock price.
X = Strike price of option.
T = Time to expiration in years.
r = Risk-free rate
rf = Risk-free rate of the foreign currency
v = Volatility of the underlying asset price
cnd (x) = The cumulative normal distribution function
nd(x) = The standard normal density function
convertingToCCRate(r, cmp ) = Rate compounder
gImpliedVolatilityNR(string CallPutFlag, float S, float x, float T, float r, float b, float cm , float epsilon) = Implied volatility via Newton Raphson
gBlackScholesImpVolBisection(string CallPutFlag, float S, float x, float T, float r, float b, float cm ) = implied volatility via bisection
Implied Volatility: The Bisection Method
The Newton-Raphson method requires knowledge of the partial derivative of the option pricing formula with respect to volatility ( vega ) when searching for the implied volatility . For some options (exotic and American options in particular), vega is not known analytically. The bisection method is an even simpler method to estimate implied volatility when vega is unknown. The bisection method requires two initial volatility estimates (seed values):
1. A "low" estimate of the implied volatility , al, corresponding to an option value, CL
2. A "high" volatility estimate, aH, corresponding to an option value, CH
The option market price, Cm , lies between CL and cH . The bisection estimate is given as the linear interpolation between the two estimates:
v(i + 1) = v(L) + (c(m) - c(L)) * (v(H) - v(L)) / (c(H) - c(L))
Replace v(L) with v(i + 1) if c(v(i + 1)) < c(m), or else replace v(H) with v(i + 1) if c(v(i + 1)) > c(m) until |c(m) - c(v(i + 1))| <= E, at which point v(i + 1) is the implied volatility and E is the desired degree of accuracy.
Implied Volatility: Newton-Raphson Method
The Newton-Raphson method is an efficient way to find the implied volatility of an option contract. It is nothing more than a simple iteration technique for solving one-dimensional nonlinear equations (any introductory textbook in calculus will offer an intuitive explanation). The method seldom uses more than two to three iterations before it converges to the implied volatility . Let
v(i + 1) = v(i) + (c(v(i)) - c(m)) / (dc / dv (i))
until |c(m) - c(v(i + 1))| <= E at which point v(i + 1) is the implied volatility , E is the desired degree of accuracy, c(m) is the market price of the option, and dc/ dv (i) is the vega of the option evaluaated at v(i) (the sensitivity of the option value for a small change in volatility ).
Things to know
Only works on the daily timeframe and for the current source price.
You can adjust the text size to fit the screen
Related indicators:
BSM OPM 1973 w/ Continuous Dividend Yield
Black-Scholes 1973 OPM on Non-Dividend Paying Stocks
Generalized Black-Scholes-Merton w/ Analytical Greeks
Generalized Black-Scholes-Merton Option Pricing Formula
Sprenkle 1964 Option Pricing Model w/ Num. Greeks
Modified Bachelier Option Pricing Model w/ Num. Greeks
Bachelier 1900 Option Pricing Model w/ Numerical Greeks

Black-Scholes 1973 OPM on Non-Dividend Paying Stocks [Loxx]Black-Scholes 1973 OPM on Non-Dividend Paying Stocks is an adaptation of the Black-Scholes-Merton Option Pricing Model including Analytical Greeks and implied volatility calculations. Making b equal to r yields the BSM model where dividends are not considered. The following information is an excerpt from Espen Gaarder Haug's book "Option Pricing Formulas". The options sensitivities (Greeks) are the partial derivatives of the Black-Scholes-Merton ( BSM ) formula. For our purposes here are, Analytical Greeks are broken down into various categories:
Delta Greeks: Delta, DDeltaDvol, Elasticity
Gamma Greeks: Gamma, GammaP, DGammaDSpot/speed, DGammaDvol/Zomma
Vega Greeks: Vega , DVegaDvol/Vomma, VegaP
Theta Greeks: Theta
Rate/Carry Greeks: Rho
Probability Greeks: StrikeDelta, Risk Neutral Density
(See the code for more details)
Black-Scholes-Merton Option Pricing
The BSM formula and its binomial counterpart may easily be the most used "probability model/tool" in everyday use — even if we con- sider all other scientific disciplines. Literally tens of thousands of people, including traders, market makers, and salespeople, use option formulas several times a day. Hardly any other area has seen such dramatic growth as the options and derivatives businesses. In this chapter we look at the various versions of the basic option formula. In 1997 Myron Scholes and Robert Merton were awarded the Nobel Prize (The Bank of Sweden Prize in Economic Sciences in Memory of Alfred Nobel). Unfortunately, Fischer Black died of cancer in 1995 before he also would have received the prize.
It is worth mentioning that it was not the option formula itself that Myron Scholes and Robert Merton were awarded the Nobel Prize for, the formula was actually already invented, but rather for the way they derived it — the replicating portfolio argument, continuous- time dynamic delta hedging, as well as making the formula consistent with the capital asset pricing model (CAPM). The continuous dynamic replication argument is unfortunately far from robust. The popularity among traders for using option formulas heavily relies on hedging options with options and on the top of this dynamic delta hedging, see Higgins (1902), Nelson (1904), Mello and Neuhaus (1998), Derman and Taleb (2005), as well as Haug (2006) for more details on this topic. In any case, this book is about option formulas and not so much about how to derive them.
Provided here are the various versions of the Black-Scholes-Merton formula presented in the literature. All formulas in this section are originally derived based on the underlying asset S follows a geometric Brownian motion
dS = mu * S * dt + v * S * dz
where t is the expected instantaneous rate of return on the underlying asset, a is the instantaneous volatility of the rate of return, and dz is a Wiener process.
The formula derived by Black and Scholes (1973) can be used to value a European option on a stock that does not pay dividends before the option's expiration date. Letting c and p denote the price of European call and put options, respectively, the formula states that
c = S * N(d1) - X * e^(-r * T) * N(d2)
p = X * e^(-r * T) * N(d2) - S * N(d1)
where
d1 = (log(S / X) + (r + v^2 / 2) * T) / (v * T^0.5)
d2 = (log(S / X) + (r - v^2 / 2) * T) / (v * T^0.5) = d1 - v * T^0.5
**This version of the Black-Scholes formula can also be used to price American call options on a non-dividend-paying stock, since it will never be optimal to exercise the option before expiration.**
Inputs
S = Stock price.
X = Strike price of option.
T = Time to expiration in years.
r = Risk-free rate
b = Cost of carry
v = Volatility of the underlying asset price
cnd (x) = The cumulative normal distribution function
nd(x) = The standard normal density function
convertingToCCRate(r, cmp ) = Rate compounder
gImpliedVolatilityNR(string CallPutFlag, float S, float x, float T, float r, float b, float cm , float epsilon) = Implied volatility via Newton Raphson
gBlackScholesImpVolBisection(string CallPutFlag, float S, float x, float T, float r, float b, float cm ) = implied volatility via bisection
Implied Volatility: The Bisection Method
The Newton-Raphson method requires knowledge of the partial derivative of the option pricing formula with respect to volatility ( vega ) when searching for the implied volatility . For some options (exotic and American options in particular), vega is not known analytically. The bisection method is an even simpler method to estimate implied volatility when vega is unknown. The bisection method requires two initial volatility estimates (seed values):
1. A "low" estimate of the implied volatility , al, corresponding to an option value, CL
2. A "high" volatility estimate, aH, corresponding to an option value, CH
The option market price, Cm , lies between CL and cH . The bisection estimate is given as the linear interpolation between the two estimates:
v(i + 1) = v(L) + (c(m) - c(L)) * (v(H) - v(L)) / (c(H) - c(L))
Replace v(L) with v(i + 1) if c(v(i + 1)) < c(m), or else replace v(H) with v(i + 1) if c(v(i + 1)) > c(m) until |c(m) - c(v(i + 1))| <= E, at which point v(i + 1) is the implied volatility and E is the desired degree of accuracy.
Implied Volatility: Newton-Raphson Method
The Newton-Raphson method is an efficient way to find the implied volatility of an option contract. It is nothing more than a simple iteration technique for solving one-dimensional nonlinear equations (any introductory textbook in calculus will offer an intuitive explanation). The method seldom uses more than two to three iterations before it converges to the implied volatility . Let
v(i + 1) = v(i) + (c(v(i)) - c(m)) / (dc / dv (i))
until |c(m) - c(v(i + 1))| <= E at which point v(i + 1) is the implied volatility , E is the desired degree of accuracy, c(m) is the market price of the option, and dc/ dv (i) is the vega of the option evaluaated at v(i) (the sensitivity of the option value for a small change in volatility ).
Things to know
Only works on the daily timeframe and for the current source price.
You can adjust the text size to fit the screen

Generalized Black-Scholes-Merton Option Pricing Formula [Loxx]Generalized Black-Scholes-Merton Option Pricing Formula is an adaptation of the Black-Scholes-Merton Option Pricing Model including Numerical Greeks aka "Option Sensitivities" and implied volatility calculations. The following information is an excerpt from Espen Gaarder Haug's book "Option Pricing Formulas".
Black-Scholes-Merton Option Pricing
The BSM formula and its binomial counterpart may easily be the most used "probability model/tool" in everyday use — even if we con- sider all other scientific disciplines. Literally tens of thousands of people, including traders, market makers, and salespeople, use option formulas several times a day. Hardly any other area has seen such dramatic growth as the options and derivatives businesses. In this chapter we look at the various versions of the basic option formula. In 1997 Myron Scholes and Robert Merton were awarded the Nobel Prize (The Bank of Sweden Prize in Economic Sciences in Memory of Alfred Nobel). Unfortunately, Fischer Black died of cancer in 1995 before he also would have received the prize.
It is worth mentioning that it was not the option formula itself that Myron Scholes and Robert Merton were awarded the Nobel Prize for, the formula was actually already invented, but rather for the way they derived it — the replicating portfolio argument, continuous- time dynamic delta hedging, as well as making the formula consistent with the capital asset pricing model (CAPM). The continuous dynamic replication argument is unfortunately far from robust. The popularity among traders for using option formulas heavily relies on hedging options with options and on the top of this dynamic delta hedging, see Higgins (1902), Nelson (1904), Mello and Neuhaus (1998), Derman and Taleb (2005), as well as Haug (2006) for more details on this topic. In any case, this book is about option formulas and not so much about how to derive them.
Provided here are the various versions of the Black-Scholes-Merton formula presented in the literature. All formulas in this section are originally derived based on the underlying asset S follows a geometric Brownian motion
dS = mu * S * dt + v * S * dz
where t is the expected instantaneous rate of return on the underlying asset, a is the instantaneous volatility of the rate of return, and dz is a Wiener process.
The formula derived by Black and Scholes (1973) can be used to value a European option on a stock that does not pay dividends before the option's expiration date. Letting c and p denote the price of European call and put options, respectively, the formula states that
c = S * N(d1) - X * e^(-r * T) * N(d2)
p = X * e^(-r * T) * N(d2) - S * N(d1)
where
d1 = (log(S / X) + (r + v^2 / 2) * T) / (v * T^0.5)
d2 = (log(S / X) + (r - v^2 / 2) * T) / (v * T^0.5) = d1 - v * T^0.5
Inputs
S = Stock price.
X = Strike price of option.
T = Time to expiration in years.
r = Risk-free rate
b = Cost of carry
v = Volatility of the underlying asset price
cnd (x) = The cumulative normal distribution function
nd(x) = The standard normal density function
convertingToCCRate(r, cmp ) = Rate compounder
gImpliedVolatilityNR(string CallPutFlag, float S, float x, float T, float r, float b, float cm, float epsilon) = Implied volatility via Newton Raphson
gBlackScholesImpVolBisection(string CallPutFlag, float S, float x, float T, float r, float b, float cm) = implied volatility via bisection
Implied Volatility: The Bisection Method
The Newton-Raphson method requires knowledge of the partial derivative of the option pricing formula with respect to volatility (vega) when searching for the implied volatility. For some options (exotic and American options in particular), vega is not known analytically. The bisection method is an even simpler method to estimate implied volatility when vega is unknown. The bisection method requires two initial volatility estimates (seed values):
1. A "low" estimate of the implied volatility, al, corresponding to an option value, CL
2. A "high" volatility estimate, aH, corresponding to an option value, CH
The option market price, Cm, lies between CL and cH. The bisection estimate is given as the linear interpolation between the two estimates:
v(i + 1) = v(L) + (c(m) - c(L)) * (v(H) - v(L)) / (c(H) - c(L))
Replace v(L) with v(i + 1) if c(v(i + 1)) < c(m), or else replace v(H) with v(i + 1) if c(v(i + 1)) > c(m) until |c(m) - c(v(i + 1))| <= E, at which point v(i + 1) is the implied volatility and E is the desired degree of accuracy.
Implied Volatility: Newton-Raphson Method
The Newton-Raphson method is an efficient way to find the implied volatility of an option contract. It is nothing more than a simple iteration technique for solving one-dimensional nonlinear equations (any introductory textbook in calculus will offer an intuitive explanation). The method seldom uses more than two to three iterations before it converges to the implied volatility. Let
v(i + 1) = v(i) + (c(v(i)) - c(m)) / (dc / dv(i))
until |c(m) - c(v(i + 1))| <= E at which point v(i + 1) is the implied volatility, E is the desired degree of accuracy, c(m) is the market price of the option, and dc/dv(i) is the vega of the option evaluaated at v(i) (the sensitivity of the option value for a small change in volatility).
Numerical Greeks or Greeks by Finite Difference
Analytical Greeks are the standard approach to estimating Delta, Gamma etc... That is what we typically use when we can derive from closed form solutions. Normally, these are well-defined and available in text books. Previously, we relied on closed form solutions for the call or put formulae differentiated with respect to the Black Scholes parameters. When Greeks formulae are difficult to develop or tease out, we can alternatively employ numerical Greeks - sometimes referred to finite difference approximations. A key advantage of numerical Greeks relates to their estimation independent of deriving mathematical Greeks. This could be important when we examine American options where there may not technically exist an exact closed form solution that is straightforward to work with. (via VinegarHill FinanceLabs)
Things to know
Only works on the daily timeframe and for the current source price.
You can adjust the text size to fit the screen
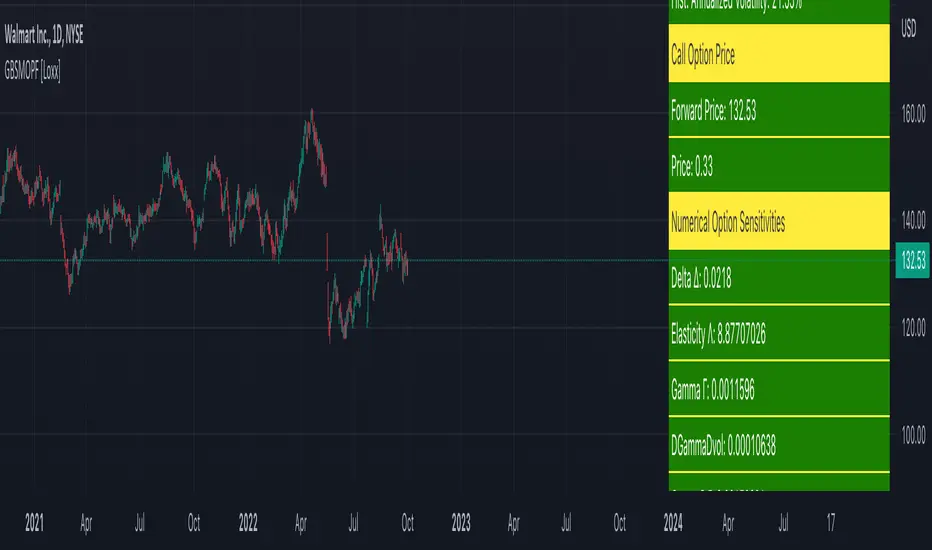
Boyle Trinomial Options Pricing Model [Loxx]Boyle Trinomial Options Pricing Model is an options pricing indicator that builds an N-order trinomial tree to price American and European options. This is different form the Binomial model in that the Binomial assumes prices can only go up and down wheres the Trinomial model assumes prices can go up, down, or sideways (shoutout to the "crab" market enjoyers). This method also allows for dividend adjustment.
The Trinomial Tree via VinegarHill Finance Labs
A two-jump process for the asset price over each discrete time step was developed in the binomial lattice. Boyle expanded this frame of reference and explored the feasibility of option valuation by allowing for an extra jump in the stochastic process. In keeping with Black Scholes, Boyle examined an asset (S) with a lognormal distribution of returns. Over a small time interval, this distribution can be approximated by a three-point jump process in such a way that the expected return on the asset is the riskless rate, and the variance of the discrete distribution is equal to the variance of the corresponding lognormal distribution. The three point jump process was introduced by Phelim Boyle (1986) as a trinomial tree to price options and the effect has been momentous in the finance literature. Perhaps shamrock mythology or the well-known ballad associated with Brendan Behan inspired the Boyle insight to include a third jump in lattice valuation. His trinomial paper has spawned a huge amount of ground breaking research. In the trinomial model, the asset price S is assumed to jump uS or mS or dS after one time period (dt = T/n), where u > m > d. Joshi (2008) point out that the trinomial model is characterized by the following five parameters: (1) the probability of an up move pu, (2) the probability of an down move pd, (3) the multiplier on the stock price for an up move u, (4) the multiplier on the stock price for a middle move m, (5) the multiplier on the stock price for a down move d. A recombining tree is computationally more efficient so we require:
ud = m*m
M = exp (r∆t),
V = exp (σ 2∆t),
dt or ∆t = T/N
where where N is the total number of steps of a trinomial tree. For a tree to be risk-neutral, the mean and variance across each time steps must be asymptotically correct. Boyle (1986) chose the parameters to be:
m = 1, u = exp(λσ√ ∆t), d = 1/u
pu =( md − M(m + d) + (M^2)*V )/ (u − d)(u − m) ,
pd =( um − M(u + m) + (M^2)*V )/ (u − d)(m − d)
Boyle suggested that the choice of value for λ should exceed 1 and the best results were obtained when λ is approximately 1.20. One approach to constructing trinomial trees is to develop two steps of a binomial in combination as a single step of a trinomial tree. This can be engineered with many binomials CRR(1979), JR(1979) and Tian (1993) where the volatility is constant.
Further reading:
A Lattice Framework for Option Pricing with Two State
Trinomial tree via wikipedia
Inputs
Spot price: select from 33 different types of price inputs
Calculation Steps: how many iterations to be used in the Trinomial model. In practice, this number would be anywhere from 5000 to 15000, for our purposes here, this is limited to 220.
Strike Price: the strike price of the option you're wishing to model
Market Price: this is the market price of the option; choose, last, bid, or ask to see different results
Historical Volatility Period: the input period for historical volatility ; historical volatility isn't used in the Trinomial model, this is to serve as a comparison, even though historical volatility is from price movement of the underlying asset where as implied volatility is the volatility of the option
Historical Volatility Type: choose from various types of implied volatility , search my indicators for details on each of these
Option Base Currency: this is to calculate the risk-free rate, this is used if you wish to automatically calculate the risk-free rate instead of using the manual input. this uses the 10 year bold yield of the corresponding country
% Manual Risk-free Rate: here you can manually enter the risk-free rate
Use manual input for Risk-free Rate? : choose manual or automatic for risk-free rate
% Manual Yearly Dividend Yield: here you can manually enter the yearly dividend yield
Adjust for Dividends?: choose if you even want to use use dividends
Automatically Calculate Yearly Dividend Yield? choose if you want to use automatic vs manual dividend yield calculation
Time Now Type: choose how you want to calculate time right now, see the tool tip
Days in Year: choose how many days in the year, 365 for all days, 252 for trading days, etc
Hours Per Day: how many hours per day? 24, 8 working hours, or 6.5 trading hours
Expiry date settings: here you can specify the exact time the option expires
Included
Option pricing panel
Loxx's Expanded Source Types
Related indicators
Implied Volatility Estimator using Black Scholes
Cox-Ross-Rubinstein Binomial Tree Options Pricing Model

Implied Volatility Estimator using Black Scholes [Loxx]Implied Volatility Estimator using Black Scholes derives a estimation of implied volatility using the Black Scholes options pricing model. The Bisection algorithm is used for our purposes here. This includes the ability to adjust for dividends.
Implied Volatility
The implied volatility (IV) of an option contract is that value of the volatility of the underlying instrument which, when input in an option pricing model (such as Black–Scholes), will return a theoretical value equal to the current market price of that option. The VIX , in contrast, is a model-free estimate of Implied Volatility. The latter is viewed as being important because it represents a measure of risk for the underlying asset. Elevated Implied Volatility suggests that risks to underlying are also elevated. Ordinarily, to estimate implied volatility we rely upon Black-Scholes (1973). This implies that we are prepared to accept the assumptions of Black Scholes (1973).
Inputs
Spot price: select from 33 different types of price inputs
Strike Price: the strike price of the option you're wishing to model
Market Price: this is the market price of the option; choose, last, bid, or ask to see different results
Historical Volatility Period: the input period for historical volatility ; historical volatility isn't used in the Bisection algo, this is to serve as a comparison, even though historical volatility is from price movement of the underlying asset where as implied volatility is the volatility of the option
Historical Volatility Type: choose from various types of implied volatility , search my indicators for details on each of these
Option Base Currency: this is to calculate the risk-free rate, this is used if you wish to automatically calculate the risk-free rate instead of using the manual input. this uses the 10 year bold yield of the corresponding country
% Manual Risk-free Rate: here you can manually enter the risk-free rate
Use manual input for Risk-free Rate? : choose manual or automatic for risk-free rate
% Manual Yearly Dividend Yield: here you can manually enter the yearly dividend yield
Adjust for Dividends?: choose if you even want to use use dividends
Automatically Calculate Yearly Dividend Yield? choose if you want to use automatic vs manual dividend yield calculation
Time Now Type: choose how you want to calculate time right now, see the tool tip
Days in Year: choose how many days in the year, 365 for all days, 252 for trading days, etc
Hours Per Day: how many hours per day? 24, 8 working hours, or 6.5 trading hours
Expiry date settings: here you can specify the exact time the option expires
*** the algorithm inputs for low and high aren't to be changed unless you're working through the mathematics of how Bisection works.
Included
Option pricing panel
Loxx's Expanded Source Types
Related Indicators
Cox-Ross-Rubinstein Binomial Tree Options Pricing Model

ATR and IV Volatility TableThis is a volatility tool designed to get the daily bottom and top values calculated using a daily ATR and IV values.
ATR values can be calculated directly, however for IV I recommend to take the values from external sources for the asset that you want to trade.
Regarding of the usage, I always recommend to go at the end of the previous close day of the candle(with replay function) or beginning of the daily open candle and get the expected values for movements.
For example for 26April for SPX, we have an ATR of 77 points and the close of the candle was 4296.
So based on ATR for 27 April our TOP is going to be 4296 + 77 , while our BOT is going to be 4296-77
At the same time lets assume the IV for today is going to be around 25% -> this is translated to 25 / (sqrt (252)) = 1.57 aprox
So based on IV our TOP is going to be 4296 + 4296 * 0.0157 , while our BOT is going to be 4296 - 4296 * 0.0157
I found out from my calculations that 80-85% of the times these bot and top points act as an amazing support and resistence points for day trading, so I fully recommend you to start including them into your analysis.
If you have any questions let me know !
