Breaker Blocks & Unicorns (with Deviations) by RiseBreaker Block and Unicorns (with Deviations) - The Highest Probability ICT Pattern
This advanced indicator identifies and tracks ICT Breaker Blocks, while incorporating powerful supplementary features including Unicorn patterns and customizable deviation levels.
These patterns develop through a precise market structure sequence culminating in structural breaks. Following Breaker Block confirmation, users can optionally enable highly customizable deviation levels. Additionally, the indicator can scan active Breaker Blocks for overlapping Fair Value Gaps (FVGs) and Inverted Fair Value Gaps (IFVGs)-(also known as "Unicorns") that represent high-probability trading opportunities, highly regarded in the ICT community.
This comprehensive tool provides unmatched functionality for traders and analysts seeking to track, backtest, and execute Breaker Block strategies. With its extensive feature set and granular customization options, it delivers capabilities that surpass existing alternatives in the market.
What is an ICT Breaker Block?
To explain this, we must understand the ABC sequence that form this pattern. It consists of:
Initial range (from A -> B)
First break point, commonly called "Manipulation" (C)
Second break, which is when the pattern is formed.
Each of these "points" consist of pivot levels, with an adjustable strength.
Breaker Blocks are invalidated and made inactive if price breaks the "C point", or manipulation.
Unicorns
Unicorns are Fair Value Gaps or Inverted Fair Value Gaps that overlap a Breaker Block. Breakers have their associated Unicorn, which is updated until price retraces into said gap.
Standard Deviations
This indicator has options to display deviations based on Breaker Blocks:
Breaker Deviations -> using the initial range (A -> B).
Manipulation Deviations -> using the manipulation (B -> C).
Input Settings:
This tool offers a lot of customizable options, which could be overwhelming to some users. Below you will find an in-depth definition of every input's purpose, to complement the tooltips that can be found directly in the indicator's settings.
Mode ⚙️
Default -> Displays every Breaker Block pattern found.
Bullish -> Displays every Bullish Breaker Block found.
Bearish -> Displays every Bearish Breaker Block found.
Reversals -> Displays alternate Breaker Blocks (Bearish -> Bullish -> Bearish and so on).
This is paired with a Historical input, to select the amount of previous Breakers to display.
Extend 📏
Last -> This option will extend the most recent Breaker's drawings.
Specified -> Extend Breakers a preset amount of bars.
All -> Extend all active Breakers to the current bar.
None -> Never extend Breaker Blocks.
Each object has it's specific " offset " parameter, which defines the amount of bars to extend drawings past the current bar.
Parameters
This section defines the main parameters used to define the Breaker Block pattern.
Time Filter -> Optional session to filter Breakers based on time of day.
Pivot Strength -> Determines how many consecutive bars to the left of a pivot must be lower (for highs) or higher (for lows) to confirm it as a point.
Range Lookback -> Amount of ranges that the indicator will keep track for each direction.
Breaker Type -> Defines how a Breaker Block is displayed:
Range -> Entire initial range.
Consecutive -> Last consecutive onside candles (upclose for bullish, downclose for bearish).
Last -> Last onside candle.
Breaker Offset -> Amount of bars to extend Breaker Blocks past the current bar.
Use Candle Bodies? -> Use bar open to close rather than high to low.
Require Candle Close? -> Use bar close to form Breaker Blocks.
Remove After Invalidation? -> Remove drawings for invalidated Breakers.
Style
Breaker Block boxes styling based on directions.
Optional Middle Line and styling.
Optional Signals for Breaker Block formation:
Triangle label with adjustable sizing on the formation bar.
Line with custom styling at breakout point to the formation bar.
Unicorn Fair Value Gaps
Checkbox to display Unicorns with adjustable "FVGs", "IFVGs", or "Both" types.
Overlap Threshold -> Distance away from Breaker to still consider an "overlap".
Unicorn Offset -> Amount of bars to extend unicorn gaps past the current bar.
Lines styling.
Optional Middle Line and styling.
Include Volume Imbalances? -> Include adjacent VIs as part of Fair Value Gaps.
Extend until Reached? -> Extend Unicorn drawings until price reaches them.
Deviations
Checkbox to display Standard Deviations with adjustable types and levels.
Lines styling.
Text size and positioning.
Extend until Reached? -> Extend deviation lines until price reaches them.
Text
Label contents:
Default -> "+/- Breaker".
Abbreviation -> "+/- BB".
None -> No text.
Size .
Font (Default or Monospace) and Format (None, Italic or Bold).
Align -> vertical and horizontal positioning.
This indicator is for educational and informational purposes only. Past performance and historical patterns do not guarantee future results. Trading involves substantial risk of loss and is not suitable for all investors. Always conduct your own analysis and consider your financial situation before making any trading decisions. The identification of patterns does not constitute trading advice.
For any additional questions and/or feedback related to this indicator, users can comment below!
Ict

FVG Premium [no1x]█ OVERVIEW
This indicator provides a comprehensive toolkit for identifying, visualizing, and tracking Fair Value Gaps (FVGs) across three distinct timeframes (current chart, a user-defined Medium Timeframe - MTF, and a user-defined High Timeframe - HTF). It is designed to offer traders enhanced insight into FVG dynamics through detailed state monitoring (formation, partial fill, full mitigation, midline touch), extensive visual customization for FVG representation, and a rich alert system for timely notifications on FVG-related events.
█ CONCEPTS
This indicator is built upon the core concept of Fair Value Gaps (FVGs) and their significance in price action analysis, offering a multi-layered approach to their detection and interpretation across different timeframes.
Fair Value Gaps (FVGs)
A Fair Value Gap (FVG), also known as an imbalance, represents a range in price delivery where one side of the market (buying or selling) was more aggressive, leaving an inefficiency or an "imbalance" in the price action. This concept is prominently featured within Smart Money Concepts (SMC) and Inner Circle Trader (ICT) methodologies, where such gaps are often interpreted as footprints left by "smart money" due to rapid, forceful price movements. These methodologies suggest that price may later revisit these FVG zones to rebalance a prior inefficiency or to seek liquidity before continuing its path. These gaps are typically identified by a three-bar pattern:
Bullish FVG : This is a three-candle formation where the second candle shows a strong upward move. The FVG is the space created between the high of the first candle (bottom of FVG) and the low of the third candle (top of FVG). This indicates a strong upward impulsive move.
Bearish FVG : This is a three-candle formation where the second candle shows a strong downward move. The FVG is the space created between the low of the first candle (top of FVG) and the high of the third candle (bottom of FVG). This indicates a strong downward impulsive move.
FVGs are often watched by traders as potential areas where price might return to "rebalance" or find support/resistance.
Multi-Timeframe (MTF) Analysis
The indicator extends FVG detection beyond the current chart's timeframe (Low Timeframe - LTF) to two higher user-defined timeframes: Medium Timeframe (MTF) and High Timeframe (HTF). This allows traders to:
Identify FVGs that might be significant on a broader market structure.
Observe how FVGs from different timeframes align or interact.
Gain a more comprehensive perspective on potential support and resistance zones.
FVG State and Lifecycle Management
The indicator actively tracks the lifecycle of each detected FVG:
Formation : The initial identification of an FVG.
Partial Fill (Entry) : When price enters but does not completely pass through the FVG. The indicator updates the "current" top/bottom of the FVG to reflect the filled portion.
Midline (Equilibrium) Touch : When price touches the 50% level of the FVG.
Full Mitigation : When price completely trades through the FVG, effectively "filling" or "rebalancing" the gap. The indicator records the mitigation time.
This state tracking is crucial for understanding how price interacts with these zones.
FVG Classification (Large FVG)
FVGs can be optionally classified as "Large FVGs" (LV) if their size (top to bottom range) exceeds a user-defined multiple of the Average True Range (ATR) for that FVG's timeframe. This helps distinguish FVGs that are significantly larger relative to recent volatility.
Visual Customization and Information Delivery
A key concept is providing extensive control over how FVGs are displayed. This control is achieved through a centralized set of visual parameters within the indicator, allowing users to configure numerous aspects (colors, line styles, visibility of boxes, midlines, mitigation lines, labels, etc.) for each timeframe. Additionally, an on-chart information panel summarizes the nearest unmitigated bullish and bearish FVG levels for each active timeframe, providing a quick glance at key price points.
█ FEATURES
This indicator offers a rich set of features designed to provide a highly customizable and comprehensive Fair Value Gap (FVG) analysis experience. Users can tailor the FVG detection, visual representation, and alerting mechanisms across three distinct timeframes: the current chart (Low Timeframe - LTF), a user-defined Medium Timeframe (MTF), and a user-defined High Timeframe (HTF).
Multi-Timeframe FVG Detection and Display
The core strength of this indicator lies in its ability to identify and display FVGs from not only the current chart's timeframe (LTF) but also from two higher, user-selectable timeframes (MTF and HTF).
Timeframe Selection: Users can specify the exact MTF (e.g., "60", "240") and HTF (e.g., "D", "W") through dedicated inputs in the "MTF (Medium Timeframe)" and "HTF (High Timeframe)" settings groups. The visibility of FVGs from these higher timeframes can be toggled independently using the "Show MTF FVGs" and "Show HTF FVGs" checkboxes.
Consistent Detection Logic: The FVG detection logic, based on the classic three-bar imbalance pattern detailed in the 'Concepts' section, is applied consistently across all selected timeframes (LTF, MTF, HTF)
Timeframe-Specific Visuals: Each timeframe's FVGs (LTF, MTF, HTF) can be customized with unique colors for bullish/bearish states and their mitigated counterparts. This allows for easy visual differentiation of FVGs originating from different market perspectives.
Comprehensive FVG Visualization Options
The indicator provides extensive control over how FVGs are visually represented on the chart for each timeframe (LTF, MTF, HTF).
FVG Boxes:
Visibility: Main FVG boxes can be shown or hidden per timeframe using the "Show FVG Boxes" (for LTF), "Show Boxes" (for MTF/HTF) inputs.
Color Customization: Colors for bullish, bearish, active, and mitigated FVG boxes (including Large FVGs, if classified) are fully customizable for each timeframe.
Box Extension & Length: FVG boxes can either be extended to the right indefinitely ("Extend Boxes Right") or set to a fixed length in bars ("Short Box Length" or "Box Length" equivalent inputs).
Box Labels: Optional labels can display the FVG's timeframe and fill percentage on the box. These labels are configurable for all timeframes (LTF, MTF, and HTF). Please note: If FVGs are positioned very close to each other on the chart, their respective labels may overlap. This can potentially lead to visual clutter, and it is a known behavior in the current version of the indicator.
Box Borders: Visibility, width, style (solid, dashed, dotted), and color of FVG box borders are customizable per timeframe.
Midlines (Equilibrium/EQ):
Visibility: The 50% level (midline or EQ) of FVGs can be shown or hidden for each timeframe.
Style Customization: Width, style, and color of the midline are customizable per timeframe. The indicator tracks if this midline has been touched by price.
Mitigation Lines:
Visibility: Mitigation lines (representing the FVG's opening level that needs to be breached for full mitigation) can be shown or hidden for each timeframe. If shown, these lines are always extended to the right.
Style Customization: Width, style, and color of the mitigation line are customizable per timeframe.
Mitigation Line Labels: Optional price labels can be displayed on mitigation lines, with a customizable horizontal bar offset for positioning. For optimal label placement, the following horizontal bar offsets are recommended: 4 for LTF, 8 for MTF, and 12 for HTF.
Persistence After Mitigation: Users can choose to keep mitigation lines visible even after an FVG is fully mitigated, with a distinct color for such lines. Importantly, this option is only effective if the general setting 'Hide Fully Mitigated FVGs' is disabled, as otherwise, the entire FVG and its lines will be removed upon mitigation.
FVG State Management and Behavior
The indicator tracks and visually responds to changes in FVG states.
Hide Fully Mitigated FVGs: This option, typically found in the indicator's general settings, allows users to automatically remove all visual elements of an FVG from the chart once price has fully mitigated it. This helps maintain chart clarity by focusing on active FVGs.
Partial Fill Visualization: When price enters an FVG, the indicator offers a dynamic visual representation: the portion of the FVG that has been filled is shown as a "mitigated box" (typically with a distinct color), while the original FVG box shrinks to clearly highlight the remaining, unfilled portion. This two-part display provides an immediate visual cue about how much of the FVG's imbalance has been addressed and what potential remains within the gap.
Visual Filtering by ATR Proximity: To help users focus on the most relevant price action, FVGs can be dynamically hidden if they are located further from the current price than a user-defined multiple of the Average True Range (ATR). This behavior is controlled by the "Filter Band Width (ATR Multiple)" input; setting this to zero disables the filter entirely, ensuring all detected FVGs remain visible regardless of their proximity to price.
Alternative Usage Example: Mitigation Lines as Key Support/Resistance Levels
For traders preferring a minimalist chart focused on key Fair Value Gap (FVG) levels, the indicator's visualization settings can be customized to display only FVG mitigation lines. This approach leverages these lines as potential support and resistance zones, reflecting areas where price might revisit to address imbalances.
To configure this view:
Disable FVG Boxes: Turn off "Show FVG Boxes" (for LTF) or "Show Boxes" (for MTF/HTF) for the desired timeframes.
Hide Midlines: Disable the visibility of the 50% FVG Midlines (Equilibrium/EQ).
Ensure Mitigation Lines are Visible: Keep "Mitigation Lines" enabled.
Retain All Mitigation Lines:
Disable the "Hide Fully Mitigated FVGs" option in the general settings.
Enable the feature to "keep mitigation lines visible even after an FVG is fully mitigated". This ensures lines from all FVGs (active or fully mitigated) remain on the chart, which is only effective if "Hide Fully Mitigated FVGs" is disabled.
This setup offers:
A Decluttered Chart: Focuses solely on the FVG opening levels.
Precise S/R Zones: Treats mitigation lines as specific points for potential price reactions.
Historical Level Analysis: Includes lines from past, fully mitigated FVGs for a comprehensive view of significant price levels.
For enhanced usability with this focused view, consider these optional additions:
The on-chart Information Panel can be activated to display a quick summary of the nearest unmitigated FVG levels.
Mitigation Line Labels can also be activated for clear price level identification. A customizable horizontal bar offset is available for positioning these labels; for example, offsets of 4 for LTF, 8 for MTF, and 12 for HTF can be effective.
FVG Classification (Large FVG)
This feature allows for distinguishing FVGs based on their size relative to market volatility.
Enable Classification: Users can enable "Classify FVG (Large FVG)" to identify FVGs that are significantly larger than average.
ATR-Based Threshold: An FVG is classified as "Large" if its height (price range) is greater than or equal to the Average True Range (ATR) of its timeframe multiplied by a user-defined "Large FVG Threshold (ATR Multiple)". The ATR period for this calculation is also configurable.
Dedicated Colors: Large FVGs (both bullish/bearish and active/mitigated) can be assigned unique colors, making them easily distinguishable on the chart.
Panel Icon: Large FVGs are marked with a special icon in the Info Panel.
Information Panel
An on-chart panel provides a quick summary of the nearest unmitigated FVG levels.
Visibility and Position: The panel can be shown/hidden and positioned in any of the nine standard locations on the chart (e.g., Top Right, Middle Center).
Content: It displays the price levels of the nearest unmitigated bullish and bearish FVGs for LTF, MTF (if active), and HTF (if active). It also indicates if these nearest FVGs are Large FVGs (if classification is enabled) using a selectable icon.
Styling: Text size, border color, header background/text colors, default text color, and "N/A" cell background color are customizable.
Highlighting: Background and text colors for the cells displaying the overall nearest bullish and bearish FVG levels (across all active timeframes) can be customized to draw attention to the most proximate FVG.
Comprehensive Alert System
The indicator offers a granular alert system for various FVG-related events, configurable for each timeframe (LTF, MTF, HTF) independently. Users can enable alerts for:
New FVG Formation: Separate alerts for new bullish and new bearish FVG formations.
FVG Entry/Partial Fill: Separate alerts for price entering a bullish FVG or a bearish FVG.
FVG Full Mitigation: Separate alerts for full mitigation of bullish and bearish FVGs.
FVG Midline (EQ) Touch: Separate alerts for price touching the midline of a bullish or bearish FVG.
Alert messages are detailed, providing information such as the timeframe, FVG type (bull/bear, Large FVG), relevant price levels, and timestamps.
█ NOTES
This section provides additional information regarding the indicator's usage, performance considerations, and potential interactions with the TradingView platform. Understanding these points can help users optimize their experience and troubleshoot effectively.
Performance and Resource Management
Maximum FVGs to Track : The "Max FVGs to Track" input (defaulting to 25) limits the number of FVG objects processed for each category (e.g., LTF Bullish, MTF Bearish). Increasing this value significantly can impact performance due to more objects being iterated over and potentially drawn, especially when multiple timeframes are active.
Drawing Object Limits : To manage performance, this script sets its own internal limits on the number of drawing objects it displays. While it allows for up to approximately 500 lines (max_lines_count=500) and 500 labels (max_labels_count=500), the number of FVG boxes is deliberately restricted to a maximum of 150 (max_boxes_count=150). This specific limit for boxes is a key performance consideration: displaying too many boxes can significantly slow down the indicator, and a very high number is often not essential for analysis. Enabling all visual elements for many FVGs across all three timeframes can cause the indicator to reach these internal limits, especially the stricter box limit
Optimization Strategies : To help you manage performance, reduce visual clutter, and avoid exceeding drawing limits when using this indicator, I recommend the following strategies:
Maintain or Lower FVG Tracking Count: The "Max FVGs to Track" input defaults to 25. I find this value generally sufficient for effective analysis and balanced performance. You can keep this default or consider reducing it further if you experience performance issues or prefer a less dense FVG display.
Utilize Proximity Filtering: I suggest activating the "Filter Band Width (ATR Multiple)" option (found under "General Settings") to display only those FVGs closer to the current price. From my experience, a value of 5 for the ATR multiple often provides a good starting point for balanced performance, but you should feel free to adjust this based on market volatility and your specific trading needs.
Hide Fully Mitigated FVGs: I strongly recommend enabling the "Hide Fully Mitigated FVGs" option. This setting automatically removes all visual elements of an FVG from the chart once it has been fully mitigated by price. Doing so significantly reduces the number of active drawing objects, lessens computational load, and helps maintain chart clarity by focusing only on active, relevant FVGs.
Disable FVG Display for Unused Timeframes: If you are not actively monitoring certain higher timeframes (MTF or HTF) for FVG analysis, I advise disabling their display by unchecking "Show MTF FVGs" or "Show HTF FVGs" respectively. This can provide a significant performance boost.
Simplify Visual Elements: For active FVGs, consider hiding less critical visual elements if they are not essential for your specific analysis. This could include box labels, borders, or even entire FVG boxes if, for example, only the mitigation lines are of interest for a particular timeframe.
Settings Changes and Platform Limits : This indicator is comprehensive and involves numerous calculations and drawings. When multiple settings are changed rapidly in quick succession, it is possible, on occasion, for TradingView to issue a "Runtime error: modify_study_limit_exceeding" or similar. This can cause the indicator to temporarily stop updating or display errors.
Recommended Approach : When adjusting settings, it is advisable to wait a brief moment (a few seconds) after each significant change. This allows the indicator to reprocess and update on the chart before another change is made
Error Recovery : Should such a runtime error occur, making a minor, different adjustment in the settings (e.g., toggling a checkbox off and then on again) and waiting briefly will typically allow the indicator to recover and resume correct operation. This behavior is related to platform limitations when handling complex scripts with many inputs and drawing objects.
Multi-Timeframe (MTF/HTF) Data and Behavior
HTF FVG Confirmation is Essential: : For an FVG from a higher timeframe (MTF or HTF) to be identified and displayed on your current chart (LTF), the three-bar pattern forming the FVG on that higher timeframe must consist of fully closed bars. The indicator does not draw speculative FVGs based on incomplete/forming bars from higher timeframes.
Data Retrieval and LTF Processing: The indicator may use techniques like lookahead = barmerge.lookahead_on for timely data retrieval from higher timeframes. However, the actual detection of an FVG occurs after all its constituent bars on the HTF have closed.
Appearance Timing on LTF (1 LTF Candle Delay): As a natural consequence of this, an FVG that is confirmed on an HTF (i.e., its third bar closes) will typically become visible on your LTF chart one LTF bar after its confirmation on the HTF.
Example: Assume an FVG forms on a 30-minute chart at 15:30 (i.e., with the close of the 30-minute bar that covers the 15:00-15:30 period). If you are monitoring this FVG on a 15-minute chart, the indicator will detect this newly formed 30-minute FVG while processing the data for the 15-minute bar that starts at 15:30 and closes at 15:45. Therefore, the 30-minute FVG will become visible on your 15-minute chart at the earliest by 15:45 (i.e., with the close of that relevant 15-minute LTF candle). This means the HTF FVG is reflected on the LTF chart with a delay equivalent to one LTF candle.
FVG Detection and Display Logic
Fair Value Gaps (FVGs) on the current chart timeframe (LTF) are detected based on barstate.isconfirmed. This means the three-bar pattern must be complete with closed bars before an FVG is identified. This confirmation method prevents FVGs from being prematurely identified on the forming bar.
Alerts
Alert Setup : To receive alerts from this indicator, you must first ensure you have enabled the specific alert conditions you are interested in within the indicator's own settings (see 'Comprehensive Alert System' under the 'FEATURES' section). Once configured, open TradingView's 'Create Alert' dialog. In the 'Condition' tab, select this indicator's name, and crucially, choose the 'Any alert() function call' option from the dropdown list. This setup allows the indicator to trigger alerts based on the precise event conditions you have activated in its settings
Alert Frequency : Alerts are designed to trigger once per bar close (alert.freq_once_per_bar_close) for the specific event.
User Interface (UI) Tips
Settings Group Icons: In the indicator settings menu, timeframe-specific groups are marked with star icons for easier navigation: 🌟 for LTF (Current Chart Timeframe), 🌟🌟 for MTF (Medium Timeframe), and 🌟🌟🌟 for HTF (High Timeframe).
Dependent Inputs: Some input settings are dependent on others being enabled. These dependencies are visually indicated in the settings menu using symbols like "↳" (dependent setting on the next line), "⟷" (mutually exclusive inline options), or "➜" (directly dependent inline option).
Settings Layout Overview: The indicator settings are organized into logical groups for ease of use. Key global display controls – such as toggles for MTF FVGs, HTF FVGs (along with their respective timeframe selectors), and the Information Panel – are conveniently located at the very top within the '⚙️ General Settings' group. This placement allows for quick access to frequently adjusted settings. Other sections provide detailed customization options for each timeframe (LTF, MTF, HTF), specific FVG components, and alert configurations.
█ FOR Pine Script® CODERS
This section provides a high-level overview of the FVG Premium indicator's internal architecture, data flow, and the interaction between its various library components. It is intended for Pine Script™ programmers who wish to understand the indicator's design, potentially extend its functionality, or learn from its structure.
System Architecture and Modular Design
The indicator is architected moduarly, leveraging several custom libraries to separate concerns and enhance code organization and reusability. Each library has a distinct responsibility:
FvgTypes: Serves as the foundational data definition layer. It defines core User-Defined Types (UDTs) like fvgObject (for storing all attributes of an FVG) and drawSettings (for visual configurations), along with enumerations like tfType.
CommonUtils: Provides utility functions for common tasks like mapping user string inputs (e.g., "Dashed" for line style) to their corresponding Pine Script™ constants (e.g., line.style_dashed) and formatting timeframe strings for display.
FvgCalculations: Contains the core logic for FVG detection (both LTF and MTF/HTF via requestMultiTFBarData), FVG classification (Large FVGs based on ATR), and checking FVG interactions with price (mitigation, partial fill).
FvgObject: Implements an object-oriented approach by attaching methods to the fvgObject UDT. These methods manage the entire visual lifecycle of an FVG on the chart, including drawing, updating based on state changes (e.g., mitigation), and deleting drawing objects. It's responsible for applying the visual configurations defined in drawSettings.
FvgPanel: Manages the creation and dynamic updates of the on-chart information panel, which displays key FVG levels.
The main indicator script acts as the orchestrator, initializing these libraries, managing user inputs, processing data flow between libraries, and handling the main event loop (bar updates) for FVG state management and alerts.
Core Data Flow and FVG Lifecycle Management
The general data flow and FVG lifecycle can be summarized as follows:
Input Processing: User inputs from the "Settings" dialog are read by the main indicator script. Visual style inputs (colors, line styles, etc.) are consolidated into a types.drawSettings object (defined in FvgTypes). Other inputs (timeframes, filter settings, alert toggles) control the behavior of different modules. CommonUtils assists in mapping some string inputs to Pine constants.
FVG Detection:
For the current chart timeframe (LTF), FvgCalculations.detectFvg() identifies potential FVGs based on bar patterns.
For MTF/HTF, the main indicator script calls FvgCalculations.requestMultiTFBarData() to fetch necessary bar data from higher timeframes, then FvgCalculations.detectMultiTFFvg() identifies FVGs.
Newly detected FVGs are instantiated as types.fvgObject and stored in arrays within the main script. These objects also undergo classification (e.g., Large FVG) by FvgCalculations.
State Update & Interaction: On each bar, the main indicator script iterates through active FVG objects to manage their state based on price interaction:
Initially, the main script calls FvgCalculations.fvgInteractionCheck() to efficiently determine if the current bar's price might be interacting with a given FVG.
If a potential interaction is flagged, the main script then invokes methods directly on the fvgObject instance (e.g., updateMitigation(), updatePartialFill(), checkMidlineTouch(), which are part of FvgObject).
These fvgObject methods are responsible for the detailed condition checking and the actual modification of the FVG's state. For instance, the updateMitigation() and updatePartialFill() methods internally utilize specific helper functions from FvgCalculations (like checkMitigation() and checkPartialMitigation()) to confirm the precise nature of the interaction before updating the fvgObject’s state fields (such as isMitigated, currentTop, currentBottom, or isMidlineTouched).
Visual Rendering:
The FvgObject.updateDrawings() method is called for each fvgObject. This method is central to drawing management; it creates, updates, or deletes chart drawings (boxes, lines, labels) based on the FVG's current state, its prev_* (previous bar state) fields for optimization, and the visual settings passed via the drawSettings object.
Information Panel Update: The main indicator script determines the nearest FVG levels, populates a panelData object (defined in FvgPanelLib), and calls FvgPanel.updatePanel() to refresh the on-chart display.
Alert Generation: Based on the updated FVG states and user-enabled alert settings, the main indicator script constructs and triggers alerts using Pine Script's alert() function."
Key Design Considerations
UDT-Centric Design: The fvgObject UDT is pivotal, acting as a stateful container for all information related to a single FVG. Most operations revolve around creating, updating, or querying these objects.
State Management: To optimize drawing updates and manage FVG lifecycles, fvgObject instances store their previous bar's state (e.g., prevIsVisible, prevCurrentTop). The FvgObject.updateDrawings() method uses this to determine if a redraw is necessary, minimizing redundant drawing calls.
Settings Object: A drawSettings object is populated once (or when inputs change) and passed to drawing functions. This avoids repeatedly reading numerous input() values on every bar or within loops, improving performance.
Dynamic Arrays for FVG Storage: Arrays are used to store collections of fvgObject instances, allowing for dynamic management (adding new FVGs, iterating for updates).

Macro TimerPlease note these session macros are according to ICT and this is ONLY the AM macro.
This indicator provides a visual countdown timer for daily macro session opens and closes. It displays a UI panel on the right side of the chart with three stacked boxes:
The top box labels the indicator as "Macro Indicator".
The middle box shows a live countdown timer.
The bottom box indicates whether the countdown is for the macro session open (9:50 AM) or close (10:10 AM), based on the current time.
The tool helps traders stay aware of key macro timing windows without manually tracking the clock, improving time-based strategy execution and session awareness.

ICT Opening Range Projections (tristanlee85)ICT Opening Range Projections
This indicator visualizes key price levels based on ICT's (Inner Circle Trader) "Opening Range" concept. This 30-minute time interval establishes price levels that the algorithm will refer to throughout the session. The indicator displays these levels, including standard deviation projections, internal subdivisions (quadrants), and the opening price.
🟪 What It Does
The Opening Range is a crucial 30-minute window where market algorithms establish significant price levels. ICT theory suggests this range forms the basis for daily price movement.
This script helps you:
Mark the high, low, and opening price of each session.
Divide the range into quadrants (premium, discount, and midpoint/Consequent Encroachment).
Project potential price targets beyond the range using configurable standard deviation multiples .
🟪 How to Use It
This tool aids in time-based technical analysis rooted in ICT's Opening Range model, helping you observe price interaction with algorithmic levels.
Example uses include:
Identifying early structural boundaries.
Observing price behavior within premium/discount zones.
Visualizing initial displacement from the range to anticipate future moves.
Comparing price reactions at projected standard deviation levels.
Aligning price action with significant times like London or NY Open.
Note: This indicator provides a visual framework; it does not offer trade signals or interpretations.
🟪 Key Information
Time Zone: New York time (ET) is required on your chart.
Sessions: Supports multiple sessions, including NY midnight, NY AM, NY PM, and three custom timeframes.
Time Interval: Supports multi-timeframe up to 15 minutes. Best used on a 1-minute chart for accuracy.
🟪 Session Options
The Opening Range interval is configurable for up to 6 sessions:
Pre-defined ICT Sessions:
NY Midnight: 12:00 AM – 12:30 AM ET
NY AM: 9:30 AM – 10:00 AM ET
NY PM: 1:30 PM – 2:00 PM ET
Custom Sessions:
Three user-defined start/end time pairs.
This example shows a custom session from 03:30 - 04:00:
🟪 Understanding the Levels
The Opening Price is the open of the first 1-minute candle within the chosen session.
At session close, the Opening Range is calculated using its High and Low . An optional swing-based mode uses swing highs/lows for range boundaries.
The range is divided into quadrants by its midpoint ( Consequent Encroachment or CE):
Upper Quadrant: CE to high (premium).
Lower Quadrant: Low to CE (discount).
These subdivisions help visualize internal range dynamics, where price often reacts during algorithmic delivery.
🟪 Working with Ranges
By default, the range is determined by the highest high and lowest low of the 30-minute session:
A range can also be determined by the highest/lowest swing points:
Quadrants outline the premium and discount of a range that price will reference:
Small ranges still follow the same algorithmic logic, but may be deemed insignificant for one's trading. These can be filtered in the settings by specifying a minimum ticks limit. In this example, the range is 42 ticks (10.5 points) but the indicator is configured for 80 ticks (20 points). We can select which levels will plot if the range is below the limit. Here, only the 00:00 opening price is plotted:
You may opt to include the range high/low, quadrants, and projections as well. This will plot a red (configurable) range bracket to indicate it is below the limit while plotting the levels:
🟪 Price Projections
Projections extend beyond the Opening Range using standard deviations, framing the market beyond the initial session and identifying potential targets. You define the standard deviation multiples (e.g., 1.0, 1.5, 2.0).
Both positive and negative extensions are displayed, symmetrically projected from the range's high and low.
The Dynamic Levels option plots only the next projection level once price crosses the previous extreme. For example, only the 0.5 STDEV level plots until price reaches it, then the 1.0 level appears, and so on. This continues up to your defined maximum projections, or indefinitely if standard deviations are set to 0.
This example shows dynamic levels for a total of 6 sessions, only 1 of which meet a configured minimum limit of 50 ticks:
Small ranges followed by significant displacement are impacted the most with the number of levels plotted. You may hide projections when configuring the minimum ticks.
A fixed standard deviation will plot levels in both directions, regardless of the price range. Here, we plot up to 3.0 which hiding projections for small ranges:
🟪 Legal Disclaimer
This indicator is provided for informational and educational purposes only. It is not financial advice, and should not be construed as a recommendation to buy or sell any financial instrument. Trading involves substantial risk, and you could lose a significant amount of money. Past performance is not indicative of future results. Always consult with a qualified financial professional before making any trading or investment decisions. The creators and distributors of this indicator assume no responsibility for your trading outcomes.

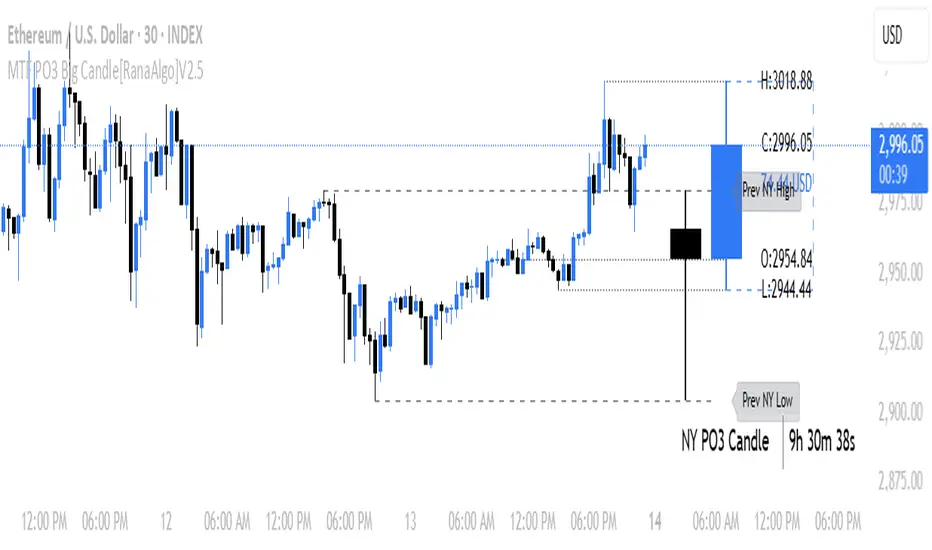
MTF PO3 Big Candle[RanaAlgo]The MTF PO3 Big Candle indicator displays a synthetic higher-timeframe candle (e.g., 1D or 4H) directly on your current chart for easier multi-timeframe analysis. It fetches OHLC data from the selected timeframe and plots a large, customizable candle with adjustable body thickness, optional wicks, and clear price labels. Dotted guide lines extend the high and low prices backward for reference, while an optional countdown timer shows the remaining time until the candle closes. The candle updates in real-time without repainting, helping traders track key levels from higher timeframes without switching charts. Colors, positioning, and visibility of elements can be fully customized.
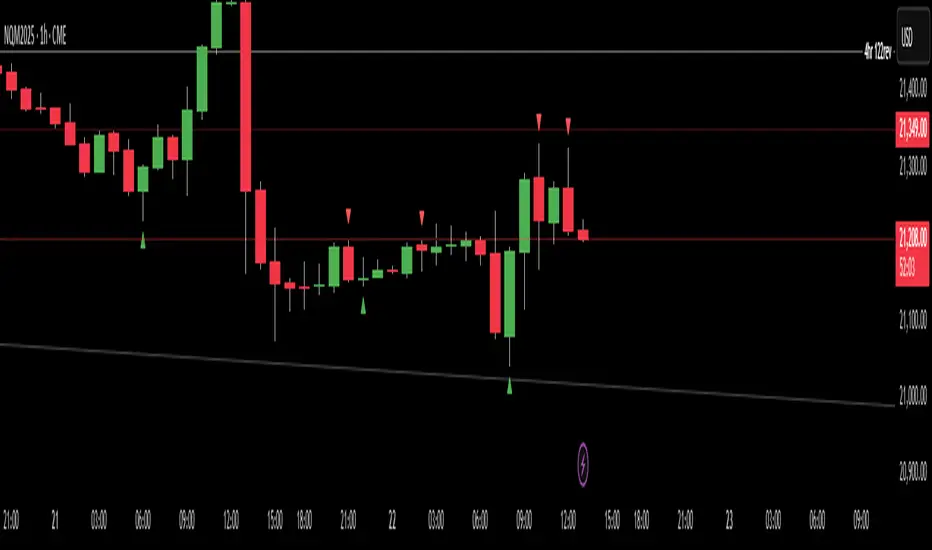
Failed 2s - The StratDescription:
This indicator detects and highlights "Failed 2" candlestick patterns from The Strat methodology — key price action setups signaling potential reversals or continuation points. It automatically identifies Failed 2 Down (Failed 2D) and Failed 2 Up (Failed 2U) signals by analyzing two consecutive bars, with special attention to price interaction at the 50% midpoint of the previous candle.
Visuals:
- Green upward triangles mark Failed 2 Down signals (bullish setups).
- Red downward triangles mark Failed 2 Up signals (bearish setups).
- Special signals that touch the 50% midpoint of the previous candle are emphasized but use the same shapes.
Alerts:
Built-in alert conditions let you receive notifications when these patterns occur, so you never miss a trade opportunity.
How to Use ALERTS in TradingView
- Paste this code into Pine Editor on TradingView.
- Click Add to Chart.
Set alerts:
- Click "Alerts" → "Condition" = your indicator name
- Choose the alert type (e.g. "Failed 2D Bar Alert")
- Set "Once per bar close"
- Customize the notification method (pop-up, app, email, etc.)
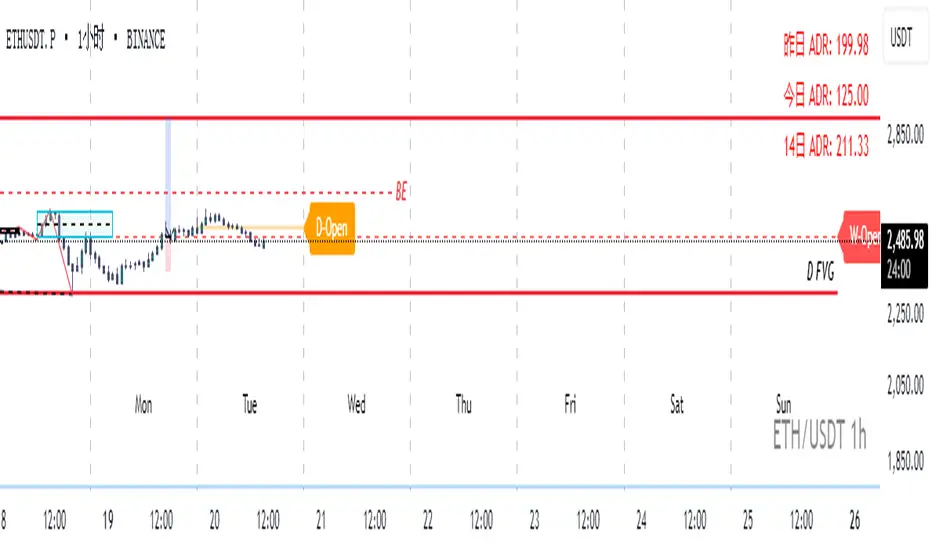
Real-Time Open Levels with Labels + Info TableReal-Time Multi-Timeframe Open Levels with Labels & Info Panel
Overview
This indicator displays real-time opening price levels across multiple timeframes (Monthly, Weekly, Daily, 4H) directly on your chart. It features:
• Dynamic horizontal lines extending through each timeframe period
• Customizable labels with text/colors
• Special 4H line treatment for the last hour (5-min charts only)
• Integrated information panel showing symbol, timeframe, and price changes
! (www.tradingview.com)
*Example showing multiple timeframe levels with labels and info panel*
---
Features & Configuration
1. Monthly Settings
! (www.tradingview.com)
Show Monthly: Toggle visibility of monthly opening price
Color: Semi-transparent blue (#2196F3 at 70% opacity)
Width: 2px line thickness
Style: Solid/Dotted/Dashed
Label: Display "M-Open" text with white text on blue background
2. Weekly Settings
! (www.tradingview.com)
Show Weekly: Toggle weekly opening price visibility
Color: Semi-transparent red (#FF5252 at 70% opacity)
Width: 1px thickness
Style: Dotted by default
Label: "W-Open" text in white on red background
3. Daily Settings
! (www.tradingview.com)
Show Daily: Toggle daily opening price
Color: Amber (#FFA000 at 70% opacity)
Width: 2px thickness
Style: Solid
Label: "D-Open" in white on orange background
---
4. 4-Hour Settings (5-Minute Charts Only)
Special Features for 5-Min Timeframe:
1. Standard 4H Line
• First 3 hours: Green (#4CAF50) dashed line
• Last hour: Bright red solid line (configurable)
• Vertical divider between 3rd/4th hours
2. Configuration Options
• Main 4H Line:
◦ Color/Width/Style for initial 3 hours
◦ Toggle label ("H4-Open") visibility and styling
• Final Hour Enhancement:
*Last Hour Line*
◦ Unique red color and line style
◦ Separate width (1px) and style (Solid)
*Divider Line*
◦ Vertical red dotted line marking last hour
◦ Adjustable position/width/transparency
! (www.tradingview.com)
*4H levels showing 3-hour segment and final hour treatment*
---
5. Info Panel Settings
Positioning:
• Anchor to any chart corner (Top/Bottom + Left/Right combinations)
• Three text sizes: Title (Huge), Change % (Large), Signature (Small)
Display Elements:
• Symbol: Show exchange prefix (e.g., "NASDAQ:")
• Timeframe: Current chart period (e.g., "5m")
• Change %: 24-hour price movement ▲/▼ percentage
• Custom Signature: Add text/username in footer
Styling:
• Semi-transparent white text (#ffffff77)
• Currency pair formatting (e.g., BTC/USD vs BTC-USD)
! (www.tradingview.com)
*Sample info panel with all elements enabled*
---
Usage Tips
1. Multi-Timeframe Context: Use levels to identify key daily/weekly support/resistance
2. 4H Trading: On 5-min charts, watch for price reactions near final hour transition
3. Customization:
• Match line colors to your chart theme
• Use different labels for clarity (e.g., "Weekly Open")
• Disable unused elements to reduce clutter
4. Divider Lines: Helps identify institutional trading periods (hour closes)
---
*Created using Pine Script v6. For optimal performance, use on charts <1H timeframe. ()*
Silver Bullet 5 minutes Box - By KaVeHThis indicator plots high-low range boxes based on selected intraday time windows on the 5-minute chart. It's inspired by the "Silver Bullet" trading concept, highlighting key liquidity grabs and volatility pockets at predefined times. It helps traders visually identify potential smart money trading windows during the New York session and other time anchors.
⚠️ This script only works on the 5-minute chart.
📦 Main Features:
⏰ Customizable Time Boxes:
Define up to 4 separate time windows per day:
3:00 AM – 3:05 AM (New York time) (Box 1)
10:00 AM – 10:05 AM (New York time) (Box 2)
2:00 PM – 2:05 PM (New York time) (Box 3)
8:00 PM – 8:05 PM (New York time) (Box 4)
🎨 Color and Visibility Control:
Each box can be independently toggled and colored for visual distinction.
🕔 New York Time Based:
All timestamps are automatically adjusted to New York Time, aligning with institutional market behavior.
📉 Post-Box Projection:
After each time window closes, a box extends forward 6 hours (72 bars on a 5-minute chart) to highlight the range.
💡 Use Case:
These boxes are best used to:
Detect liquidity sweeps.
Mark potential entry or exit zones.
Track price behavior after specific time-based events.
For example, the 10 AM box is often used to identify setups just after the NYSE open and into the first hour of volatility.
⚠️ TradingView Compliance Notes:
This script is original and does not replicate or resell premium/paid indicators.
All logic is coded from scratch by kaveh_mirmousavi, using public concepts from ICT/Smart Money Trading.
Fully complies with the Mozilla Public License 2.0.
Does not include financial advice or signals — for educational use only.
✅ How to Use:
Apply to a 5-minute chart.
Adjust the desired time boxes in the input panel.
Watch for price action within and after the boxes.
Enjoy and feel free to share feedback or ideas for improvement!

ICT HTF Candles [Pro] (fadi)The ICT HTF Candles shows you multi-timeframe price action by plotting up to six higher timeframe candles on your chart, scaled to real price levels. Set candle counts per timeframe or toggle them off for a clean view, saving you time switching between charts. This helps you spot trends and reversals quickly, align trades with the market’s direction, and time setups like sweeps or bounces better. From scalping on the 1m to swinging on the 4H, it simplifies ICT and Smart Money Concepts (SMC), revealing trend shifts and institutional moves clearly. Once you use it, trading without this clarity just won’t feel right.
Key Features:
In-Depth Price Action Levels
These levels track ICT PD arrays and confluences across timeframes, making it easy to see how price action flows from higher timeframes and what your setup faces. Is your 5m trade about to run into a 1H bearish order block? Did it bounce off a higher timeframe FVG and create an SMT with a correlated asset? They make your chart a clear roadmap to market structure, helping you find strong setups, save time, and align with institutional moves:
Change in State of Delivery (CISD): In ICT trading, CISD marks potential reversal levels on each timeframe by showing the open of the highest series of up (green) candles for a bullish shift or the open of the lowest series of down (red) candles for a bearish shift. These levels are set at the opening price of the first candle in those runs, highlighting where the market turns. The indicator makes these levels easy to spot across timeframes, so you can track reversal points clearly. You can set your own confirmation criteria—a close or wick above/below the CISD line (bearish/bullish) or a close or wick above/below the high/low—to verify the CISD level cross. When confirmed, there is a high probability that we have a change in trend, and a reversal order block forms. CISD helps you track these reversal levels and confirm market shifts, making multi-timeframe analysis straightforward.
Order Blocks: When a CISD level cross is confirmed, the price is now below a series of up (green) candles or above a series of down (red) candles, marking these candles as order blocks that usually support the new trend direction. The indicator shows these levels clearly across timeframes, making it easy to spot high-probability reversal or consolidation areas. Keep in mind that price may sometimes move to mitigate an imbalance, so use your best judgment based on your multi-timeframe analysis to confirm they meet your trading criteria.
Trend Bias: Traders often struggle figuring out market bias—guessing the trend wrong, losing on trades against the flow, or missing how lower and higher timeframes line up. The Trend Bias feature tracks order blocks and change in state of delivery, displaying bullish or bearish trends for each timeframe to help you choose trades that go with the market’s direction. The indicator shows these trends clearly across timeframes, so you can quickly see if the 5m matches the 1H or if you’re going against the bigger trend. This makes it easier to avoid bad trades and make decisions faster, keeping you on track with setups that follow the main trend.
Immediate Rebalance: When looking at price action, you’ll see the market doesn’t usually leave behind many Fair Value Gaps (FVGs). That’s because the market is efficient and always rebalancing any inefficiencies. When the market starts a strong move, the last candle will usually close above the previous candle high (for up moves) or below the low (for down moves). At this point, the market will do one of two things: immediately rebalance by retracing first, or have a small retracement but leave behind an FVG. The Immediate Rebalance feature tracks rebalance levels across multiple timeframes, clearly showing where price rebalances. This helps traders have a better expectation of how the market may need to retrace and anticipate Power of Three (PO3) setups by being ready for a Judas swing to rebalance the imbalance.
Fair Value Gaps and Volume Imbalances: If the market fails to immediately rebalance, it will usually attempt to come back and rebalance it at a later time. FVGs and VIs give you a clear area where the price might be heading if it starts breaking structure on lower timeframes. These inefficiencies—price gaps (FVGs) or aggressive moves (VIs)—show where the market’s working to fix imbalances. The Fair Value Gaps and Volume Imbalances feature tracks these levels across timeframes.
Previous Candle Levels: The Previous Candle Levels feature marks the high, low, and middle of the prior candle on each timeframe, helping you identify key price levels for sweeps, bounces, or breakouts. It tracks the candle’s high and low as its extremes and the middle as the 50% mark, which you can set to calculate using the high-to-low range or the open-to-close range. These levels can provide tradable setups on lower timeframes.
Smart Money Techniques (SMT): What’s an ICT indicator without an SMT feature to track cracks in correlated assets? The ICT HTF Candles monitors your chosen correlated assets, like EUR/USD and GBP/USD or SQ and NQ, for signs of strength or weakness to use as confluence with other features and build the case for A+ setups. The SMT feature spots divergences when one asset makes a higher high or lower low while the other doesn’t follow, hinting at potential reversals or market shifts. It tests SMT using two immediate candles, since higher timeframes (HTFs) create larger gaps on lower timeframes. Traders can easily see these divergence levels, like a 15m SMT lining up with a 1H order block or CISD, helping you confirm high-probability setups and strengthen trade entries with multi-timeframe confluence.

UNITED TRADING COMMUNITY WaterMarkWATER MARK indicator. Will allow you to improve the order of the entries you need on the chart.
1. Name and date for the traded instrument
2. Watermarks to protect your charts (in the center and around the perimeter of the chart)
3. The new "notes" option will allow you to keep focus on the factors that are important to you on the chart.
Very flexible settings for any notes, labels, watermarks on the chart that are important to you.
Индикатор WATER MARK . Даст возможность вам улучшить порядок нужных вам записей на графике.
1. Название и дата для торгуемого инструмента
2. Водные знаки для защиты ваших графиков ( в центре и по периметру графика)
3. Новая опция "заметки" позволит вам держать фокус на важных для вас факторах на графике.
Очень гибкая настройка , любых значимых для вас заметок , лейблов , вотермарк на графике.

FVG Candle HighlighterThis indicator highlights only the true Fair Value Gap (FVG) creator candle — the middle candle in a 3-bar FVG formation — with zero clutter.
🔹 Bullish FVG: Candle is colored if price gaps above the high two bars back
🔹 Bearish FVG: Candle is colored if price gaps below the low two bars back
✨ No boxes. No zones. Just pure, visual price-action accuracy.
🔧 Powered by Pine Script v6
🧠 Based on institutional-style FVG logic
🎯 Ideal for Smart Money / ICT / Order Block strategies

FVG + OB + RSI Divergence + Volume Spikes🧠 FVG + OB + RSI Divergence + Volume Spikes – Market Structure Confluence Tool
This all-in-one indicator brings together four powerful market concepts into a single script designed to help traders identify high-probability trade setups with precision and clarity:
🔍 What It Does
✅ Fair Value Gaps (FVG)
Highlights inefficiencies in price action, showing where the market may return to “rebalance.”
✅ Order Blocks (OB)
Marks key institutional footprints — bullish and bearish order blocks based on engulfing candle structures.
✅ RSI Divergence
Detects both bullish and bearish divergences between price and RSI, signaling potential reversals.
✅ Volume Spikes
Flags bars where volume significantly exceeds the average — a common footprint of smart money.
🎯 How to Use
Use this tool to spot confluences between price inefficiencies (FVG), key reversal zones (OB), momentum shifts (RSI Divergence), and institutional interest (Volume Spikes). The best setups often occur when multiple signals align — especially at key support/resistance or trend zones.
⚙️ Inputs
RSI length (for divergence)
Volume spike sensitivity (multiplier)
Lookback for Order Blocks and FVGs
⚠️ Notes
This is a non-repainting tool.
Ideal for price action, SMC, ICT, and order flow traders.
Combine with your existing strategy and higher time frame bias for best results.

Balanced Price Range | Flux Charts💎 GENERAL OVERVIEW
Introducing our new Balanced Price Range (BPR) indicator! A Balanced Price Range is a trading concept used by price action traders. It is detected by finding overlapping area between two contrary Fair Value Gaps (FVGs). These areas can be used as entry points during market pullbacks. For more information about the process, please check the "HOW DOES IT WORK ?" section.
Balanced Price Range Features :
Balanced Price Range Detection : Identifies areas where bullish and bearish FVGs overlap, suggesting a zone of price equilibrium.
Customizable FVG & BPR Detection : You can fine-tune FVG detection and sensitivity for BPR detection to your liking.
Retest Labels : Bullish & Bearish retest labels will be rendered for BPRs.
Alerts : You can set alerts for Bullish & Bearish BPR detection and their retests.
🚩 UNIQUENESS
This indicator doesn't just detect standard FVGs but specifically looks for areas where bullish and bearish IFVGs (Invalidated Fair Value Gaps) overlap, defining a Balanced Price Range. It also actively manages and updates identified BPR zones, removing them when they are invalidated or remain untouched for a specified period. It highlights and alerts users to retests of established BPR zones, signaling potential trading opportunities. Users can tailor the appearance of the BPR zones and retest markers, as well as configure specific alerts for new BPR formations and retests.
📌 HOW DOES IT WORK ?
A Fair Value Gap generally occur when there is an imbalance in the market. They can be detected by specific formations within the chart. The indicator first detects bullish & bearish FVG zones according to their formations on chart. Then, they are dynamically tracked and flagged as invalidated if the price crosses them, turning them into IFVGs. When a FVG & IFVG of the same type overlaps, the indicator combines them into a single BPR of corresponding type. The detected BPR is updated as new data comes in, and renders retests labels as they occur. A bullish BPR can be used to find long trade entry opportunities, while a bearish BPR can be used to find short trade entry opportunities. Retests can also indicate potential movements in the corresponding direction of the BPR. Users can set-up alerts for BPR detection & BPR retests and will get notified as they occur.
⚙️ SETTINGS
Show Historic Zones: If enabled, invalidated or expired BPR zones will remain visible on the chart.
Balanced Price Range:
FVG Detection Method: Determines the criteria for the bar types forming the initial FVG.
Same: All three bars forming the FVG must be of the same type (all bullish or all bearish).
Mixed: The bar types must vary (a mix of bullish and bearish bars).
All: Bar types can vary or be the same.
FVG Invalidation Method: Determines which part of the candle (wick or close) invalidates the initial FVG.
BPR Invalidation Method: Determines which part of the candle (wick or close) invalidates the Balanced Price Range.
Sensitivity: Adjusts the sensitivity of FVG detection. Higher values may identify fewer, larger BPRs, while lower values may detect more, smaller BPRs.
Labels: Toggles the display of text labels on the identified zones.
Retests: Enables or disables the detection and visualization of BPR retests.

ICT iFVG Detector and Alert [by ote618]Description
This script detects ICT - fair value gaps (FVG) formed by price gaps between Candle 1 and Candle 3, then monitors the next 5 candles for an inverse fair value gap (iFVG).
What It Detects
Bullish FVG: When Candle 1 high is below Candle 3 low (BISI)
Bearish FVG: When Candle 1 low is above Candle 3 high (SIBI)
Once an FVG is detected, the script checks the next 5 candles:
A Bullish FVG becomes a Bearish IFVG if price closes below Candle 1 high
A Bearish FVG becomes a Bullish IFVG if price closes above Candle 1 low
Only the first bar that validates the FVG triggers the transition to an IFVG.
Visual Output
A shaded rectangle is plotted to mark the original FVG zone (from Candle 1 to Candle 3)
Color-coded:
Red for Bearish IFVG (validated Bullish IG)
Green for Bullish IFVG (validated Bearish IG)
The rectangle extends from Candle 1 to the validating bar
Alerts
You can receive alerts when an FVG becomes an IFVG:
Configurable to fire only on selected timeframes (1m, 5m, 15m, 60m)
Alerts include the direction and the chart timeframe
Settings
Enable Alerts For Timeframe: Choose which timeframe(s) trigger alerts
This tool helps traders identify inverse FVGs (iFVG), a useful ICT concept.

Quarterly Theory ICT 05 [TradingFinder] Doubling Theory Signals🔵 Introduction
Doubling Theory is an advanced approach to price action and market structure analysis that uniquely combines time-based analysis with key Smart Money concepts such as SMT (Smart Money Technique), SSMT (Sequential SMT), Liquidity Sweep, and the Quarterly Theory ICT.
By leveraging fractal time structures and precisely identifying liquidity zones, this method aims to reveal institutional activity specifically smart money entry and exit points hidden within price movements.
At its core, the market is divided into two structural phases: Doubling 1 and Doubling 2. Each phase contains four quarters (Q1 through Q4), which follow the logic of the Quarterly Theory: Accumulation, Manipulation (Judas Swing), Distribution, and Continuation/Reversal.
These segments are anchored by the True Open, allowing for precise alignment with cyclical market behavior and providing a deeper structural interpretation of price action.
During Doubling 1, a Sequential SMT (SSMT) Divergence typically forms between two correlated assets. This time-structured divergence occurs between two swing points positioned in separate quarters (e.g., Q1 and Q2), where one asset breaks a significant low or high, while the second asset fails to confirm it. This lack of confirmation—especially when aligned with the Manipulation and Accumulation phases—often signals early smart money involvement.
Following this, the highest and lowest price points from Doubling 1 are designated as liquidity zones. As the market transitions into Doubling 2, it commonly returns to these zones in a calculated move known as a Liquidity Sweep—a sharp, engineered spike intended to trigger stop orders and pending positions. This sweep, often orchestrated by institutional players, facilitates entry into large positions with minimal slippage.
Bullish :
Bearish :
🔵 How to Use
Applying Doubling Theory requires a simultaneous understanding of temporal structure and inter-asset behavioral divergence. The method unfolds over two main phases—Doubling 1 and Doubling 2—each divided into four quarters (Q1 to Q4).
The first phase focuses on identifying a Sequential SMT (SSMT) divergence, which forms when two correlated assets (e.g., EURUSD and GBPUSD, or NQ and ES) react differently to key price levels across distinct quarters. For example, one asset may break a previous low while the other maintains structure. This misalignment—especially in Q2, the Manipulation phase—often indicates early smart money accumulation or distribution.
Once this divergence is observed, the extreme highs and lows of Doubling 1 are marked as liquidity zones. In Doubling 2, the market gravitates back toward these zones, executing a Liquidity Sweep.
This move is deliberate—designed to activate clustered stop-loss and pending orders and to exploit pockets of resting liquidity. These sweeps are typically driven by institutional forces looking to absorb liquidity and position themselves ahead of the next major price move.
The key to execution lies in the fact that, during the sweep in Doubling 2, a classic SMT divergence should also appear between the two assets. This indicates a weakening of the previous trend and adds an extra layer of confirmation.
🟣 Bullish Doubling Theory
In the bullish scenario, Doubling 1 begins with a bullish SSMT divergence, where one asset forms a lower low while the other maintains its structure. This divergence signals weakening bearish momentum and possible smart money accumulation. In Doubling 2, the market returns to the previous low and sweeps the liquidity zone—breaking below it on one asset, while the second fails to confirm, forming a bullish SMT divergence.
f this move is followed by a bullish PSP and a clear market structure break (MSB), a long entry is triggered. The stop-loss is placed just below the swept liquidity zone, while the target is set in the premium zone, anticipating a move driven by institutional buyers.
🟣 Bearish Doubling Theory
The bearish scenario follows the same structure in reverse. In Doubling 1, a bearish SSMT divergence occurs when one asset prints a higher high while the other fails to do so. This suggests distribution and weakening buying pressure. Then, in Doubling 2, the market returns to the previous high and executes a liquidity sweep, targeting trapped buyers.
A bearish SMT divergence appears, confirming the move, followed by a bearish PSP on the lower timeframe. A short position is initiated after a confirmed MSB, with the stop-loss placed
🔵 Settings
⚙️ Logical Settings
Quarterly Cycles Type : Select the time segmentation method for SMT analysis.
Available modes include : Yearly, Monthly, Weekly, Daily, 90 Minute, and Micro.
These define how the indicator divides market time into Q1–Q4 cycles.
Symbol : Choose the secondary asset to compare with the main chart asset (e.g., XAUUSD, US100, GBPUSD).
Pivot Period : Sets the sensitivity of the pivot detection algorithm. A smaller value increases responsiveness to price swings.
Pivot Sync Threshold : The maximum allowed difference (in bars) between pivots of the two assets for them to be compared.
Validity Pivot Length : Defines the time window (in bars) during which a divergence remains valid before it's considered outdated.
🎨 Display Settings
Show Cycle :Toggles the visual display of the current Quarter (Q1 to Q4) based on the selected time segmentation
Show Cycle Label : Shows the name (e.g., "Q2") of each detected Quarter on the chart.
Show Labels : Displays dynamic labels (e.g., “Q2”, “Bullish SMT”, “Sweep”) at relevant points.
Show Lines : Draws connection lines between key pivot or divergence points.
Color Settings : Allows customization of colors for bullish and bearish elements (lines, labels, and shapes)
🔔 Alert Settings
Alert Name : Custom name for the alert messages (used in TradingView’s alert system).
Message Frequenc y:
All : Every signal triggers an alert.
Once Per Bar : Alerts once per bar regardless of how many signals occur.
Per Bar Close : Only triggers when the bar closes and the signal still exists.
Time Zone Display : Choose the time zone in which alert timestamps are displayed (e.g., UTC).
Bullish SMT Divergence Alert : Enable/disable alerts specifically for bullish signals.
Bearish SMT Divergence Alert : Enable/disable alerts specifically for bearish signals
🔵 Conclusion
Doubling Theory is a powerful and structured framework within the realm of Smart Money Concepts and ICT methodology, enabling traders to detect high-probability reversal points with precision. By integrating SSMT, SMT, Liquidity Sweeps, and the Quarterly Theory into a unified system, this approach shifts the focus from reactive trading to anticipatory analysis—anchored in time, structure, and liquidity.
What makes Doubling Theory stand out is its logical synergy of time cycles, behavioral divergence, liquidity targeting, and institutional confirmation. In both bullish and bearish scenarios, it provides clearly defined entry and exit strategies, allowing traders to engage the market with confidence, controlled risk, and deeper insight into the mechanics of price manipulation and smart money footprints.

Dealing rangeHi all!
This indicator will show you the current dealing range. The concept of dealing range comes from the inner circle trader (ICT) and gives you a range between an established swing high and an established swing low (the length of these pivots can be changed in settings parameter Length and defaults to 5/2 (left/right)). These swing points must have taken out liquidity to be considered "established". The liquidity that must be grabbed by the swing point has to be a pivot of left length of 1 and a right length of 1.
The dealing range that's created should be used in conjunction with market structure. This could be done through scripts (maybe the Market structure script that I published ()) or manually. It's a common approach to look for long opportunities when the trend is bullish and price is currently in the discount zone of the dealing range. If the trend is bearish then short opportunities are presented when the price is currently in the premium zone of the dealing range.
The zones within the dealing range are premium and discount that are split on the 50% level of the dealing range. These zones can be split into 3 zone with a Fair price (also called Fair value ) zone in between premium and discount. This makes the premium zone to be in the upper third of the dealing range, fair price in the middle third and discount in the lower third. This can be enabled in the settings through the Fair price parameter.
Enabled:
You can choose to enable/disable the visualisation of liquidity grabs and the External liquidity available above and below the swing points that created the dealing range.
Enabled:
Disabled:
Enabled on a higher timeframe (will display a box of the liquidity grab price instead of a label):
This dealing range is configurable to be created by a higher timeframe then the visible charts. Use the setting Higher timeframe to change this.
You can force candles to be closed (for liquidity and swing points). Please note that if you use a higher timeframe then the visible charts the candles must be closed on this timeframe.
Lastly you can also change the transparency of liquidity grabs and external liquidity outside of the dealing range. Use the Transparency setting to change this (a lower value will lead to stronger visuals).
If you have any input or suggestions on future features or bugs, don't hesitate to let me know!
Best of trading luck!

10 AM NY Box - By KaVeH📦 10 AM New York Box till 4 PM — \
--By KaVeH--
This indicator automatically draws a price range box that captures the high and low between 10:00 AM and 11:00 AM New York Time (Eastern Time) on "5-minute charts".
### 🔍 What It Does
The "10 AM NY Box" is a simple but powerful visualization tool for day traders and ICT-based strategies. It highlights a key hourly session right after the "New York open" — often a time of increased volatility, liquidity grabs, and the formation of critical intraday highs or lows.
### 📊 Features
Time Window: Customizable start and end hours (defaults: 10 AM to 11 AM NY time).
Box Color: Customizable with transparency.
Chart Restriction: The indicator "only works on 5-minute charts" to ensure accuracy and prevent misalignment.
### ⚙️ Inputs
- 'Start Hour (NY Time)' – Default: 10
- 'End Hour (NY Time)' – Default: 11
- 'Box Color' – Default: Red with transparency
### 📈 How It Works
- During the specified time window, the script tracks the "highest high and lowest low".
- Once the time window ends, it draws a "box" from the starting to the ending time, extending a little beyond to keep it visible.
- Each day's box is created independently, and only once per day.
### 🧠 Use Cases
- Spotting potential liquidity zones
- Identifying breakout or fakeout traps
- Aligning with ICT concepts like "FVG", "BAG", or "Judas Swing"
### ⚠️ Notes & Limitations
- "Only functions on 5-minute timeframes" — this is intentional to maintain session accuracy.
- Does not repaint.
- Time is aligned to **New York (Eastern Time)** regardless of your chart’s timezone.
- One box per day.

Equal High/Low (EQH/EQL) [AlgoAlpha]OVERVIEW
This script detects and visualizes Equal High (EQH) and Equal Low (EQL) zones—key liquidity areas where price has previously stalled or reversed. These levels often attract institutional interest due to the liquidity buildup around them. The indicator is built to highlight such zones using dynamic thresholding, overbought/oversold RSI filtering, and adaptive mitigation logic to manage zone relevance over time.
CONCEPTS
Equal Highs/Lows are price points where the market has repeatedly failed to break past a certain high or low, hinting at areas where stop orders and pending interest may be concentrated. These areas are often prime targets for liquidity grabs or reversals. By combining this with RSI filtering, the script avoids false signals during neutral conditions and instead focuses on zones where market pressure is more directional.
FEATURES
Detection Logic: The script identifies EQH and EQL zones by comparing the similarity between recent highs or lows with a dynamic volatility threshold. The `tolerance` input allows users to control how strict this comparison is.
RSI Filtering: If enabled, it only creates zones when RSI is significantly overbought or oversold (based on the `state_thresh` input). This helps ensure zones form only in meaningful market conditions.
Zone Display: Bullish (EQL) zones are shown in grey, while bearish (EQH) zones are in blue. Two horizontal lines mark the zone using wick and body extremes, and a filled area visualizes the zone between them.
Zone Management: Zones automatically extend with price until they’re invalidated. You can choose whether a zone is removed based on wick or body sweeps and whether it requires one or two candle confirmations. Zones also expire after a customizable number of bars.
Alerts: Four alert conditions are built in—when a new EQH/EQL is formed and when one is mitigated—making it easy to integrate into alert-based workflows.
USAGE
Equal highs/lows can be used as liquidity markers, either as entry points or as take-profit targets.
This tool is ideal for liquidity-based strategies and helps traders map out possible reversal or sweep zones that often precede aggressive moves.

Time-Based Fair Value Gaps (FVG) with Inversions (iFVG)Overview
The Time-Based Fair Value Gaps (FVG) with Inversions (iFVG) (ICT/SMT) indicator is a specialized tool designed for traders using Inner Circle Trader (ICT) methodologies. Inspired by LuxAlgo's Fair Value Gap indicator, this script introduces significant enhancements by integrating ICT principles, focusing on precise time-based FVG detection, inversion tracking, and retest signals tailored for institutional trading strategies. Unlike LuxAlgo’s general FVG approach, this indicator filters FVGs within customizable 10-minute windows aligned with ICT’s macro timeframes and incorporates ICT-specific concepts like mitigation, liquidity grabs, and session-based gap prioritization.
This tool is optimized for 1–5 minute charts, though probably best for 1 minute charts, identifying bullish and bearish FVGs, tracking their mitigation into inverted FVGs (iFVGs) as key support/resistance zones, and generating retest signals with customizable “Close” or “Wick” confirmation. Features like ATR-based filtering, optional FVG labels, mitigation removal, and session-specific FVG detection (e.g., first FVG in AM/PM sessions) make it a powerful tool for ICT traders.
Originality and Improvements
While inspired by LuxAlgo’s FVG indicator (credit to LuxAlgo for their foundational work), this script significantly extends the original concept by:
1. Time-Based FVG Detection: Unlike LuxAlgo’s continuous FVG identification, this script filters FVGs within user-defined 10-minute windows each hour (:00–:10, :10–:20, etc.), aligning with ICT’s emphasis on specific periods of institutional activity, such as hourly opens/closes or kill zones (e.g., New York 7:00–11:00 AM EST). This ensures FVGs are relevant to high-probability ICT setups.
2. Session-Specific First FVG Option: A unique feature allows traders to display only the first FVG in ICT-defined AM (9:30–10:00 AM EST) or PM (1:30–2:00 PM EST) sessions, reflecting ICT’s focus on initial market imbalances during key liquidity events.
3. ICT-Driven Mitigation and Inversion Logic: The script tracks FVG mitigation (when price closes through a gap) and converts mitigated FVGs into iFVGs, which serve as ICT-style support/resistance zones. This aligns with ICT’s view that mitigated gaps become critical reversal points, unlike LuxAlgo’s simpler gap display.
4. Customizable Retest Signals: Retest signals for iFVGs are configurable for “Close” (conservative, requiring candle body confirmation) or “Wick” (faster, using highs/lows), catering to ICT traders’ need for precise entry timing during liquidity grabs or Judas swings.
5. ATR Filtering and Mitigation Removal: An optional ATR filter ensures only significant FVGs are displayed, reducing noise, while mitigation removal declutters the chart by removing filled gaps, aligning with ICT’s principle that mitigated gaps lose relevance unless inverted.
6. Timezone and Timeframe Safeguards: A timezone offset setting aligns FVG detection with EST for ICT’s New York-centric strategies, and a timeframe warning alerts users to avoid ≥1-hour charts, ensuring accuracy in time-based filtering.
These enhancements make the script a distinct tool that builds on LuxAlgo’s foundation while offering ICT traders a tailored, high-precision solution.
How It Works
FVG Detection
FVGs are identified when a candle’s low is higher than the high of two candles prior (bullish FVG) or a candle’s high is lower than the low of two candles prior (bearish FVG). Detection is restricted to:
• User-selected 10-minute windows (e.g., :00–:10, :50–:60) to capture ICT-relevant periods like hourly transitions.
• AM/PM session first FVGs (if enabled), focusing on 9:30–10:00 AM or 1:30–2:00 PM EST for key market opens.
An optional ATR filter (default: 0.25× ATR) ensures only gaps larger than the threshold are displayed, prioritizing significant imbalances.
Mitigation and Inversion
When price closes through an FVG (e.g., below a bullish FVG’s bottom), the FVG is mitigated and becomes an iFVG, plotted as a support/resistance zone. iFVGs are critical in ICT for identifying reversal points where institutional orders accumulate.
Retest Signals
The script generates signals when price retests an iFVG:
• Close: Triggers when the candle body confirms the retest (conservative, lower noise).
• Wick: Triggers when the candle’s high/low touches the iFVG (faster, higher sensitivity). Signals are visualized with triangular markers (▲ for bullish, ▼ for bearish) and can trigger alerts.
Visualization
• FVGs: Displayed as colored boxes (green for bullish, red for bearish) with optional “Bull FVG”/“Bear FVG” labels.
• iFVGs: Shown as extended boxes with dashed midlines, limited to the user-defined number of recent zones (default: 5).
• Mitigation Removal: Mitigated FVGs/iFVGs are removed (if enabled) to keep the chart clean.
How to Use
Recommended Settings
• Timeframe: Use 1–5 minute charts for precision, avoiding ≥1-hour timeframes (a warning label appears if misconfigured).
• Time Windows: Enable :00–:10 and :50–:60 for hourly open/close FVGs, or use the “Show only 1st presented FVG” option for AM/PM session focus.
• ATR Filter: Keep enabled (multiplier 0.25–0.5) for significant gaps; disable on 1-minute charts for more FVGs during volatility.
• Signal Preference: Use “Close” for conservative entries, “Wick” for aggressive setups.
• Timezone Offset: Set to -5 for EST (or -4 for EDT) to align with ICT’s New York session.
Trading Strategy
1. Macro Timeframes: Focus on New York (7:00–11:00 AM EST) or London (2:00–5:00 AM EST) kill zones for high institutional activity.
2. FVG Entries: Trade bullish FVGs as support in uptrends or bearish FVGs as resistance in downtrends, especially in :00–:10 or :50–:60 windows.
3. iFVG Retests: Enter on retest signals (▲/▼) during liquidity grabs or Judas swings, using “Close” for confirmation or “Wick” for speed.
4. Session FVGs: Use the “Show only 1st presented FVG” option to target the first gap in AM/PM sessions, often tied to ICT’s market maker algorithms.
5. Risk Management: Combine with ICT concepts like order blocks or breaker blocks for confluence, and set stops beyond FVG/iFVG boundaries.
Alerts
Set alerts for:
• “Bullish FVG Detected”/“Bearish FVG Detected”: New FVGs in selected windows.
• “Bullish Signal”/“Bearish Signal”: iFVG retest confirmations.
Settings Description
• Show Last (1–100, default: 5): Number of recent iFVGs to display. Lower values reduce clutter.
• Show only 1st presented FVG : Limits FVGs to the first in 9:30–10:00 AM or 1:30–2:00 PM EST sessions (overrides time window checkboxes).
• Time Window Checkboxes: Enable/disable FVG detection in 10-minute windows (:00–:10, :10–:20, etc.). All enabled by default.
• Signal Preference: “Close” (default) or “Wick” for iFVG retest signals.
• Use ATR Filter: Enables ATR-based size filtering (default: true).
• ATR Multiplier (0–∞, default: 0.25): Sets FVG size threshold (higher values = larger gaps).
• Remove Mitigated FVGs: Removes filled FVGs/iFVGs (default: true).
• Show FVG Labels: Displays “Bull FVG”/“Bear FVG” labels (default: true).
• Timezone Offset (-12 to 12, default: -5): Aligns time windows with EST.
• Colors: Customize bullish (green), bearish (red), and midline (gray) colors.
Why Use This Indicator?
This indicator empowers ICT traders with a tool that goes beyond generic FVG detection, offering precise, time-filtered gaps and inversion tracking aligned with institutional trading principles. By focusing on ICT’s macro timeframes, session-specific imbalances, and customizable signal logic, it provides a clear edge for scalping, swing trading, or reversal setups in high-liquidity markets.

London Judas Swing Indicator by PoorTomTradingThis indicator is designed to help people identify and trade the London Judas Swing by Inner Circle Trader (ICT).
UPDATES IN V2:
This is a v2 update with automatic timezone settings, there is no longer any need to adjust the time or offset for DST.
It will now also work on any chart that trades during the Asia and London sessions (20:00 - 05:00 NY Time), including crypto.
It is recommended to use this indicator on the 5 minute timeframe.
INTRODUCTION OF KEY CONCEPTS:
Swing Points are a candle patterns defining highs and lows, these are explained further down in the description in more detail. They are shown on the indicator by arrows above and below candles. They can be removed if you wish by turning their opacity to 0% in settings. Swing points are automatically removed when price trades beyond them (above swing highs, below swing lows).
The Asia Session can be set by the user, but is defined by default as 20:00 - 00:00 NY time. Lines are drawn at the high and low of the Asia Session and the Asian Range is set at midnight.
The London Session is defined as 02:00 - 05:00 NY time.
The user can also include the pre-London session (00:00 - 02:00) for detection of breakouts and Market Structure Breaks (MSBs - explained lower down in the description with examples). This is selected by default.
EXPLANATION OF INDICATOR:
During the London Session, the indicator will wait for a break of either the high or low of the Asian Range.
When this is detected, it will draw a dashed line where the breakout occurred and trigger an alert.
After the break of the Asian Range, the indicator will look for an MSB in the opposite direction, which is when price closes beyond a swing point opposing current price direction. The indicator will draw a line indicating the MSB point and trigger an alert.
Finally, the indicator will also trigger an alert when price returns to this MSB level, which is the most simple Judas Swing entry method.
The Judas swing
Example with chart for Judas Swing short setups -
Price breaks above the Asia High, no candle close is required, the indicator will then wait for price to close a candle below the last swing low.
A swing low is defined as a 3 candle pattern, with two candles on either side of the middle one having higher lows. When a candle closes below the middle candle's low, that is an MSB.
When price returns to the MSB point, the Take Profit and Stop Loss levels will appear.
When price goes to either the Stop Loss or Take Profit level, the MSB, TP and SL, lines will be removed.
After this, if price creates a new setup in the opposite direction, the indicator will also work for this, as shown in this example that occurred right after the first example
SETTINGS:
- The "Swing Point strength" can be adjusted in the settings.
Example:
For a swing low:
The default setting is 1 (one candle on each side of a middle candle has a higher low).
You can change this setting to 2, for a 5 candle pattern (two candles on each side of the middle candle have higher lows).
This can be changed to a maximum of 10. But only 1 or 2 is recommended especially on the 5 minute chart.
- ATR Length and Triangle Distance Multiplier settings are for adjusting how the swing point symbols appear on the chart.
This is to ensure triangles are not drawn over candles when price gets volatile.
The default setting is ideal for almost all market conditions, but you can play around with it to adjust to your liking.
- Alerts.
For alerts to be triggered, they must first be selected in settings.
Then you need to go on to the chart and right-click on an element of the indicator (such as the swing point symbols) and select "add alert on PTT-LJS-v2".
If after this, you change any settings on the indicator such as session times or pre-London session, you must add the alert again, and delete the old one if you wish.

Order Blocks [TakingProphets]The Order Blocks indicator automatically finds and highlights institutional Order Blocks (OBs) on your chart — powerful price zones where smart money has previously entered the market with large orders. These areas often act as strong support or resistance, and they’re key tools for traders using ICT (Inner Circle Trader) and Smart Money Concepts (SMC) strategies.
📘 What’s an Order Block?
An Order Block is usually the last bullish or bearish candle before a big move or shift in market structure. It represents where banks, funds, or institutions placed large buy or sell orders. Retail traders often miss these zones, but smart money traders use them to anticipate where price may return, stall, or even reverse.
This indicator identifies these zones for you — both bullish and bearish — so you don’t have to manually mark them.
🔍 How the Indicator Works
It waits for a market structure shift — when price breaks out of a recent high or low range.
Then it looks back to find the last opposite candle before that breakout — that candle becomes the OB.
It draws a box from the open of that candle to the high/low (depending on type) and keeps updating the box forward.
You can choose how strict the OBs need to be (Small, Medium, or Large) using ATR-based size filtering.
🔄 Breaker Blocks (Optional Feature)
If price closes through an Order Block in the opposite direction, that OB is considered invalid. But instead of deleting it, the indicator can automatically draw a Breaker Block. Breakers are important because they often become new support or resistance zones — a sign the market has flipped direction and is now respecting that level in a new way.
🎛 Custom Settings
Choose OB detection sensitivity: High (shows smaller moves), Medium, or Low (only the biggest institutional moves).
Customize colors and whether you want to show borders on each block.
Turn Breaker Blocks on or off based on your strategy.
Everything is dynamic and updates live as price evolves.
💡 Why Use It?
Knowing where smart money entered the market gives you a huge edge. Price often returns to these Order Blocks to "rebalance" or fill unfilled orders. With this indicator, you’ll:
Spend less time marking charts.
Spot high-probability entry zones faster.
Avoid common retail traps and trade with the algorithm.

FVG [TakingProphets]🧠 Purpose
This indicator is built for traders applying Inner Circle Trader (ICT) methodology. It detects and manages Fair Value Gaps (FVGs) — price imbalances that often act as future reaction zones. It also highlights New Day Opening Gaps (NDOGs) and New Week Opening Gaps (NWOGs) that frequently play a role in early-session price behavior.
📚 What is a Fair Value Gap?
A Fair Value Gap forms when price moves rapidly, skipping over a portion of the chart between three candles — typically between the high of the first candle and the low of the third. These zones are considered inefficient, meaning institutions may return to them later to:
-Rebalance unfilled orders
-Enter or scale into positions
-Engineer liquidity with minimal slippage
In ICT methodology, FVGs are seen as both entry zones and targets, depending on market structure and context.
⚙️ How It Works
-This script automatically identifies and manages valid FVGs using the following logic:
-Bullish FVGs: When the low of the current candle is above the high from two candles ago
-Bearish FVGs: When the high of the current candle is below the body of two candles ago
-Minimum Gap Filter: Gaps must be larger than 0.05% of price
-Combine Consecutive Gaps (optional): Merges adjacent gaps of the same type
-Consequent Encroachment Line (optional): Plots the midpoint of each gap
-NDOG/NWOG Tracking: Labels gaps created during the 5–6 PM session transition
-Automatic Invalidation: Gaps are removed once price closes beyond their boundary
🎯 Practical Use
-Use unmitigated FVGs as potential entry points or targets
-Monitor NDOG and NWOG for context around daily or weekly opens
-Apply the midpoint (encroachment) line for precise execution decisions
-Let the script handle cleanup — only active, relevant zones remain visible
🎨 Customization
-Control colors for bullish, bearish, and opening gaps
-Toggle FVG borders and midpoint lines
-Enable or disable combining of consecutive gaps
-Fully automated zone management, no manual intervention required
✅ Summary
This tool offers a clear, rules-based approach to identifying price inefficiencies rooted in ICT methodology. Whether used for intraday or swing trading, it helps traders stay focused on valid, active Fair Value Gaps while filtering out noise and maintaining chart clarity.

Multi-Symbol Trend DashboardMulti-Symbol Trend Dashboard - MA Cross Trend Monitor
Short Description
A customizable dashboard that displays trend direction across multiple symbols and timeframes using moving average crossovers.
Full Description
Overview
This Multi-Symbol Trend Dashboard allows you to monitor trend direction across 7 different symbols and 5 timeframes simultaneously in a single view. The dashboard uses moving average crossovers to determine trend direction, displaying bullish trends in green and bearish trends in red.
Key Features
Multi-Symbol Monitoring : Track up to 7 different trading instruments at once
Multi-Timeframe Analysis: View 5 different timeframes simultaneously for each instrument
Customizable Moving Averages: Choose between SMA, EMA, or WMA with adjustable periods
Visual Clarity: Color-coded cells provide immediate trend identification
Flexible Positioning: Place the dashboard anywhere on your chart
Customizable Appearance: Adjust sizes, colors, and text formatting
How It Works
The dashboard calculates a fast MA and slow MA for each symbol-timeframe combination. When the fast MA is above the slow MA, the cell shows green (bullish). When the fast MA is below the slow MA, the cell shows red (bearish).
Use Cases
Get a bird's-eye view of market trends across multiple instruments
Identify potential trading opportunities where multiple timeframes align
Monitor your watchlist without switching between charts
Spot divergences between related instruments
Track market breadth across sectors or related instruments
Notes and Limitations
Limited to 7 symbols and 5 timeframes due to TradingView's security request limits
Uses simple MA crossover as trend determination method
Dashboard is most effective when displayed on a dedicated chart
Performance may vary on lower-end devices due to multiple security requests
Settings Explanation
MA Settings: Configure the periods and types of moving averages
Display Settings: Adjust dashboard positioning and visual elements
Trading Instruments: Select which symbols to monitor (defaults to major forex pairs)
Timeframes: Choose which timeframes to display (default: M15, H1, H4, D1, W1)
Colors: Customize the color scheme for bullish/bearish indications and headers
This dashboard provides a straightforward way to maintain situational awareness across multiple markets and timeframes, helping traders identify potential setups and market conditions at a glance.
