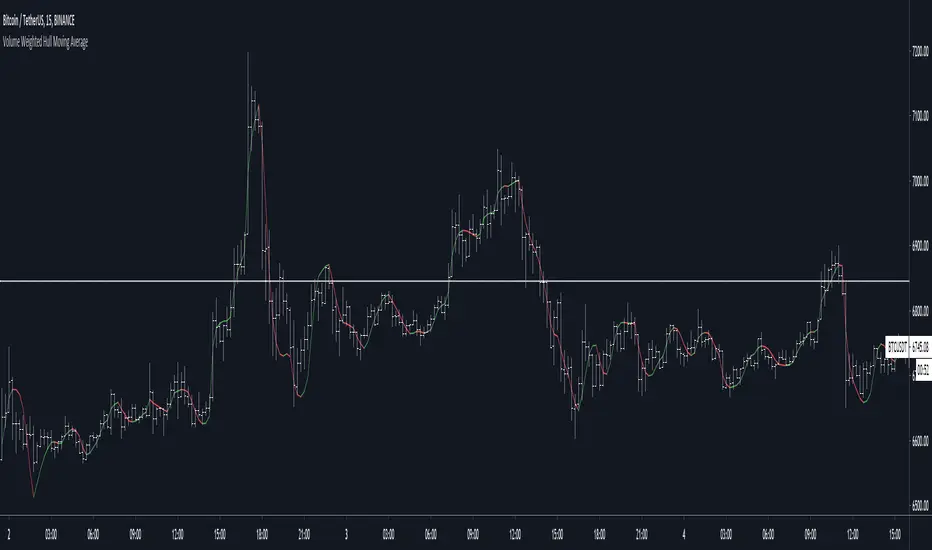
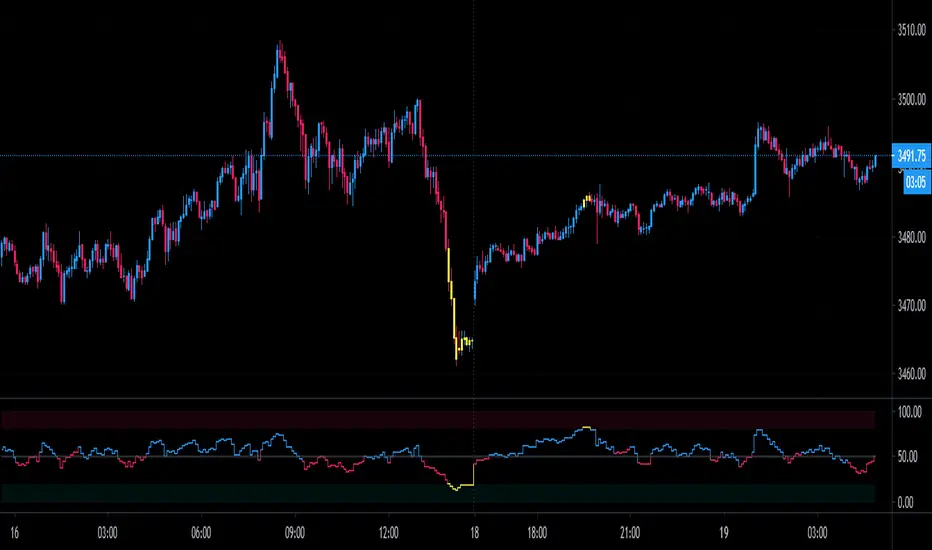
ARI-DPO TrendThis is a new indicator that uses DPO (Detrended Price Oscillator) and calculating its HMA 200 and EMA 200 is able to show the current price direction.
if the line is below 0 the market is in a downtrend in the short term, otherwise, the market is in an uptrend.
if the line is red, the market is in a downtrend in the long term (bearish), otherwise, the market is in a long term uptrend (bullish)
a sequence of red/green lines means that the market is choppy
Currently, I'm using it with cryptocurrencies to assess if the short term price action.
How it works:
the indicator calculates the DPO (default 21 periods) and its HMA (default 200 periods) and EMA (default 200 periods) and shows if the DPO is above both HMA and SMA (indicator line above 0 and green), below both (indicator line below 0 and red) or between (the indicator line and the colour are not matching: e.g. red line above the zero or green line below zero). the latter is the classic situation of a choppy market or a possible short term reversal.
The aim of this indicator is to find a good entry point for long/short positions.
I'm still testing and improving it, please
let me know in the comments if you find this useful. Cheers!
HMA

Simple Hull MAA simple code to plot Hull MA with colour coding of plot fill and price bars based on strength.

MA+MA+ is a multi time frame moving average indicator with more than a dozen different moving averages (like KAMA, VAMA, JMA, HMA and much more).
More moving averages will be added on every update, hence Follow me to get notified.
MA+ Supports automatic (AUTO in settings) time frame multiplier. For example, if you set 'Auto Resolution Multiplier' to 6, and your base chart is 5 minutes, the moving averages will plot at 5 * 6 = 30 minutes.
You can still use 'User Defined' to use your own time frame without using the multiplier.
Use higher time frame than the base chart time frame to avoid repainting.
Default multiplier for higher time frame is 2.
Supports Signals 1 (rising MA) or -1 (falling MA) to attach to another indicator.
Bars are not colored by default.
Just for this great community, You can request in the comments other moving averages that do not exists in MA+.

Donchian BlasterRelease Note:
Keeping in mind of getting full potential of Donchian Channels, As part of this script, Linear Regression is used as primary source to identify trend and execute the trades.
Hull Moving Average given as alternative option in place of Linear regression.
Linear Regression:
Linear regression used to identify trend, trade setup, and stop. Based on this, Color fillings on Donchian channels is updated. That will give clear idea of strength or weakness in any trading instruments.
HMA:
HMA used as alternative to identify trend, trade setup, and stop. Based on this, Color fillings on Donchian channels is updated. That will give clear idea of strength or weakness in any trading instruments.
Donchian Channels:
As it is one of the oldest trend riding system, combined here with differentiation in color will help to go with the trend.
Inputs:
Input periods can be changed by users/traders as per their understanding and observations.
//Disclaimer: Idea of publishing this script is to identify the strength of the instrument using multiple confirmation.
//Disclaimer: Using this indicator, changing inputs, and trading decisions are up to the users/traders.
//Courtesy: Thanks to Richard Donchian, Alan Hull, and author of LSMA as this indicator/script inspired by Donchian Channels, Hull Moving Average, and LSMA
FishNet Doubled hullMA Reactive ColorsMoving averages are used to determine trend. These moving averages are designed to determine trend with reactive coloring and utilizes a unique version of the Hull moving average. This is one of many iterations of fishnet MAs I have made in the past.
I first found fishnet MAs, which is a lot of moving averages of increasing length, from @TusenPix
YMMV on actionable information :p

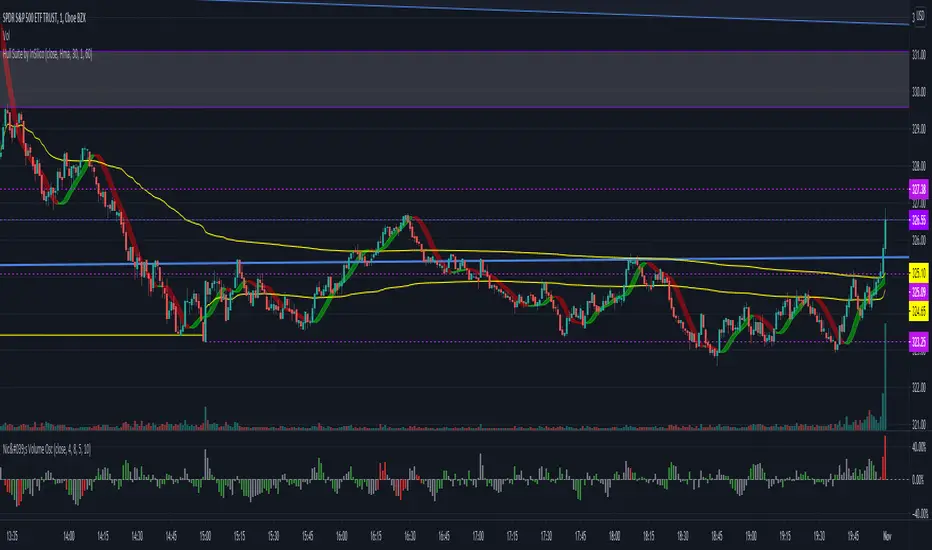
Adjacent HMA StopRelease Note:
This indicator script setup is published to identify the strength and ride the trends.
HMA:
HMA 100 period is used as default. However this can be changed as per wish. Major turning points or decisions can be made using this HMA line. Purple color is used to identify this. This can be used as the final extreme stop for any trend before it turns.
Adjacent Line:
Blue colored Adjacent line can be used to determine the trend strength or ride the trend till it slows down. When trending move happens it can be ride till the candles comes within this Adjacent line. And then sideways move or the moves between HMA & Adjacent line can be traded
Stop:
Dotted lines in Red and Green colors are used as very tight stop. This can be also used as first level of profit booking when very strong move happens.
Trend View:
There is an optional 'Trend View' which can be used to determined the trend.
Disclaimer:
//This script/indicator published with the idea of finding the strength of any instruments. Trade decisions and execution are up to the traders/users as per their understanding
//Courtesy: Thanks to Alan Hull and Richard Donchian as some of the concepts are inspired from them
GMS: The OscillatorThis is my version of an RSI. Basically treat it the same way, but needless to say there's a few more things going into it than just the closing price.
The color of the line is based on my HAMA JAMMA indicator so they could be used in conjunction to help pick potential trend reversals in either direction, overbought and oversold levels will turn the line yellow.
The "Make that a combo?" selection will change the curve and make it more sensitive to sharper price movements.
This works on any time frame as well as any bar type, although for certain bar types you'll probably have to tweak the settings to see what works.
I hope it helps,
Andre
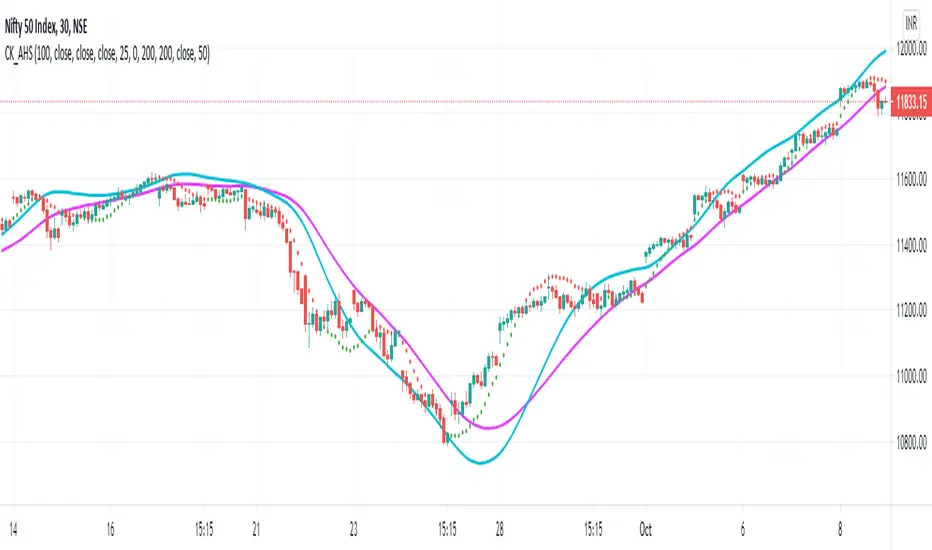
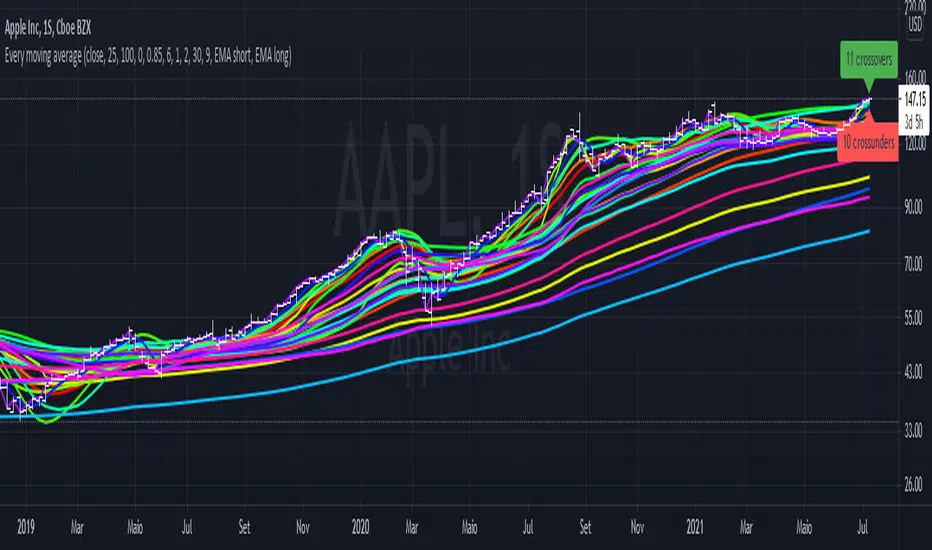
Every single moving average (ALMA, EMA, HMA, KAMA, RMA, SMA...)So you may be looking at the graph and thinking "this is a mess", and I agree.
The purpose of this script is to plot in the same graph every single type of moving average that I could think of, so you can find the ones that are better for your timeframe and for your asset. Once you add it, disable those types that doesn't seem to serve your purpose, until you can select one you like.
The average types are: ALMA, EMA, HMA, KAMA, RMA, SMA, SWMA, VIDYA, VWAP, VWMA, and WMA. Each one is ploted two times (except SWMA and VWAP), one with a short period, and another with a long, both of which you can configure.
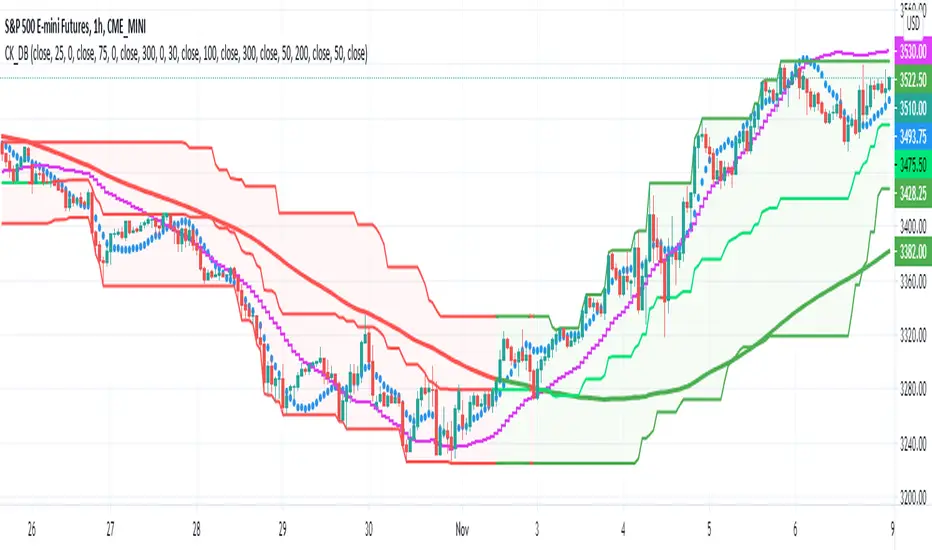
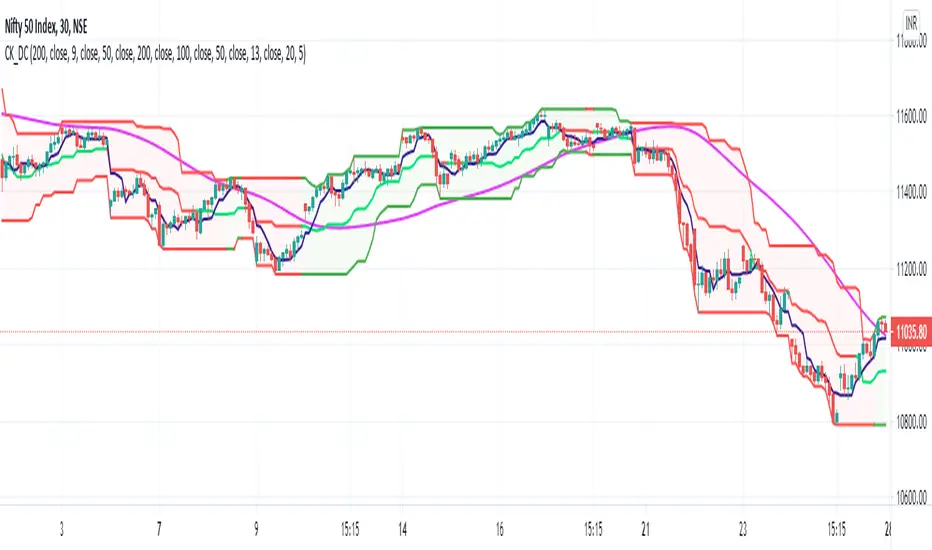
Modified Donchian ChannelRelease Note:
This indicator setup highly inspired by Donchian Channel and Hull Moving Average. Big thanks to both Richard Donchian and Alan Hull.
Back test and live test it and come to conclusion of how to use this indicator for live trading.
200 HMA:
200 Hull Moving Average plays major role in deciding the right trades using Donchian Channel. As part of this setup,
If price is below 200 HMA, then the Donchian Channel is highlighted in Red color
If price is above 200 HMA, then the Donchian Channel is highlighted in Green color
Donchian Channel:
Default 20 period is used for the Donchian channel. However, the color highlight as per 200 HMA position. Also, the middle basis color changes to Green and Red based on candle close of above or below.
Additionally, 5 period Donchian basis is used as tight stop loss. This can be used wisely or optionally based on trade decisions
Disclaimer:
//Idea of publishing this script is to identify the strength of the instrument using multiple confirmation.
//Using this indicator, changing inputs, and trading decisions are up to the users/traders.
//Courtesy: Thanks to Richard Donchian and Alan Hull as this indicator/script inspired by Donchian Channels and Hull Moving Average
GMS: HAMA JAMMAThis is my version of HAMA candles, I just wanted more out of the original indicator. So now with this one you'll be able to pick which MA you want as well as it's length.
MA's included are: SMA, EMA, WMA, HMA, VWMA, & Linear Regression.
The line at the bottom represents a slightly firmer grasp of the trend relative to the HAMA candle colors. Basically it will help to filter out potentially weak signals. *It is not price support*
Tip: Be sure to turn off the border color in the settings, it will help the colors to pop.
Hope this helps,
Andre

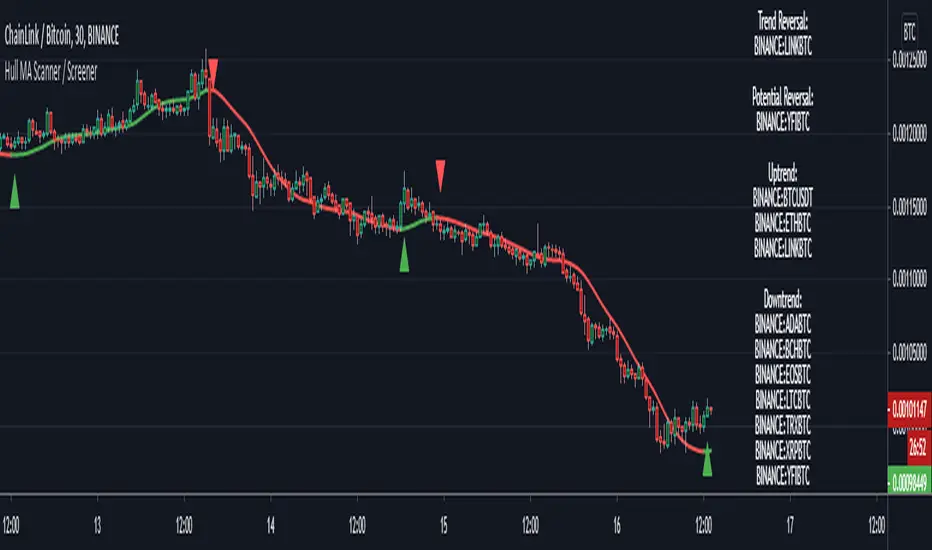
Hull MA Scanner / Screener LabelThis screens for Hull MA trend reversal's in 10 different securities. If the label color is not visible due to the text in it being white colored, then choose a different color from settings. Also added a simple HullMA to it. If want can increase it upto 40 securities in the code which is upto user to decide.
This was requested by soderstromkenan in comments and looked like a nice idea so decided to make it.
The Hull MA logic is from "Hull50" by u/RafaelZioni with his permission. Screener logic from u/Quantnomad with his permission.
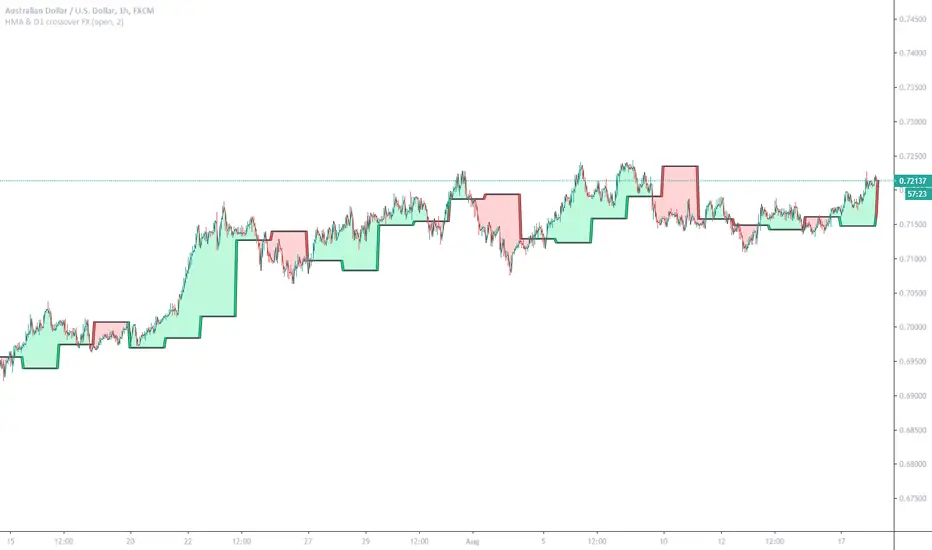
HMA & D1 crossover FX (Study)Can work on other Forex pairs if change settings: Period
This example tuned for AUDUSD (FX Version)
Enter new order on HMA ( Hull Moving Average ) and D1 ( Daily Candle) crossovers, Exit orders as basket when profit = Your Target Profit
This study version built for users of Alerts. Crossover of HMA and DailyCandle1 (and/or DailyCandle1 cross DailyCandle2) (also possible Price cross HMA)
Candle Color GeneratorCandle Color Generator:
This indicator is designed to highlight the candle colors based on the combinations of Parabolic SAR (PSAR) and 2 Hull Moving Averages (HMA).
Colors:
Yellow, Red, and Green colors are used to describe the candle colors depends on its position to PSAR and 2 HMAs.
PSAR:
PSAR position above or below candle position is differentiated by Red and Green colors
HMAs:
As default settings 20 HMA is considered as lower period and 50 HMA is considered period for the calculation
Trade What You See:
This indicator will help to see how the setup of particular instrument coming up. Users/Traders can use and trade based on what they see and interpret from it.
Disclaimer:
Idea of publishing this script is to identify the strength of the instrument using multiple confirmation.
Using this indicator, changing inputs (show/hide/change period), and trading decisions are up to the users/traders.
Courtesy:
Thanks to inventors of HMA (Alan Hull), PSAR(Welles Wilder) as these inputs are used to make some calculations

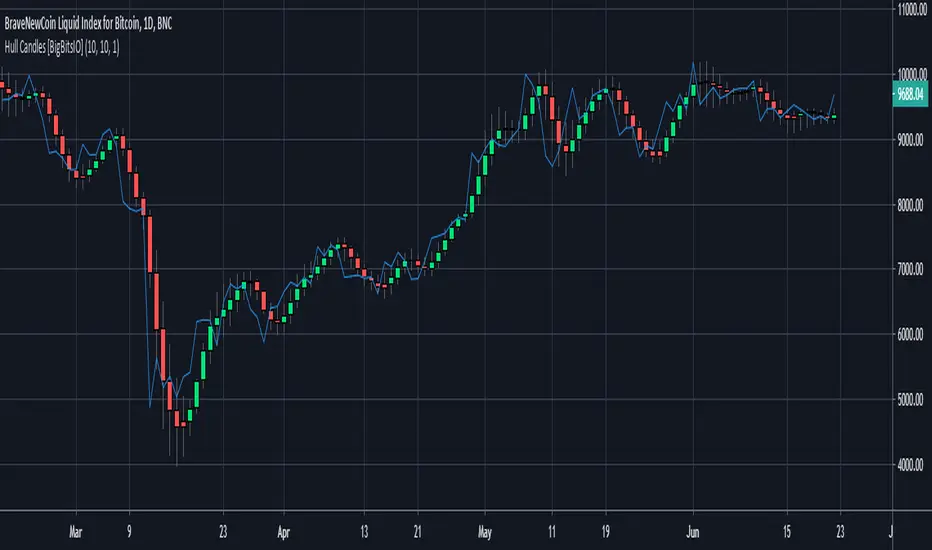
Hull Candles [BigBitsIO]This script is for custom candles based on an HMA calculation with a default period of 10 as well as an SMA of the close price, defaulted to 1 period to only show the current price. The purpose of the custom candles is to try and reduce noise from candles and help identify trends. These custom candles somewhat resemble Heikin-Ashi candles in their appearance.
Explained:
- Open, High, Low and Close (o, h, l, and c) are all calculated using an HMA calculation based on a user input length/period, defaulted at 10.
- Candle colors are determined by using the same HMA calculation on the ohcl4 and comparing it to the previous candle. Green candles have an ohlc4 greater than the previous candle, all other candles are red.
- The current price is plotted with the default blue line with an SMA calculation with 1 period to allow customization of smoothing if necessary to identify trends.
DISCLAIMER: For educational and entertainment purposes only. Nothing in this content should be interpreted as financial advice or a recommendation to buy or sell any sort of security or investment including all types of crypto. DYOR, TYOB.
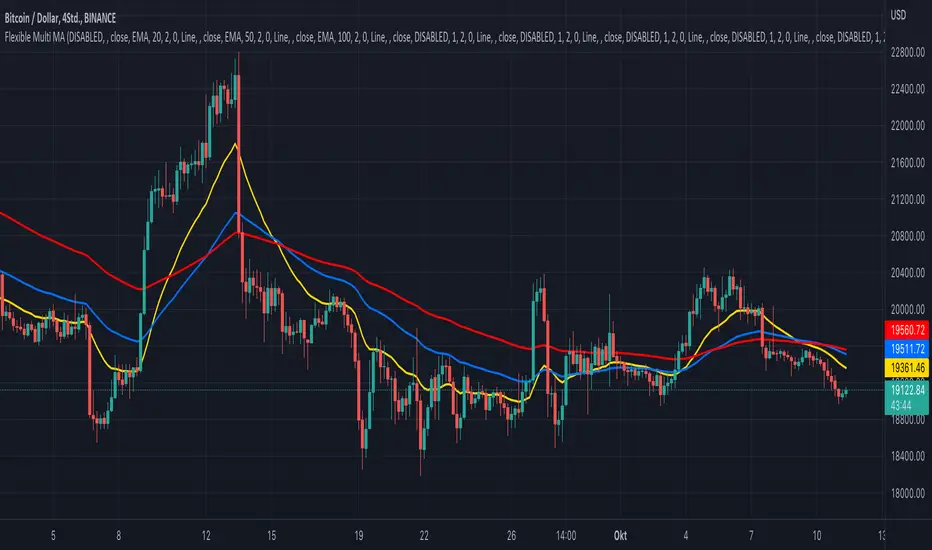
KINSKI Flexible Multi MA (EMA, SMA, RMA, WMA, VWMA, KAMA, HMA)This Multi Moving Average (MA) indicator is more flexible than any other indicator of this type offered so far. You can define up to 10 different Moving Average (MA) lines based on different calculation variants.
The following MA types can be configured.
- EMA: Exponentially Moving Average
- SMA: Small Moving Average
- RMA: Rolling Moving Average
- WMA: Weighted Moving Average
- VWMA: Volume Weighted Moving Average
- KAMA: Kaufman's Adaptive Moving Average
- HMA: Hull Moving Average
Which settings can be made?
- Selection for calculation formula ("Calculation Source"). The default value is "close".
- for each MA line the "Length" and the "Type" can be defined
- furthermore you can make layout adjustments via the "Style" menu
Colored Directional Movement and Bollinger Band's Cloud by DGTThis study combines Bollinger Bands, one of the most popular technical analysis indicators on the market, and Directional Movement (DMI), which is another quite valuable technical analysis indicator.
Bollinger Bands used in conjunction with Directional Movement (DMI) may help getting a better understanding of the ever changing landscape of the market and perform more advanced technical analysis
Here are details of the concept applied
1- Plots Bollinger Band’s (BB) Cloud colored based on Bollinger Band Width (BBW) Indicator’s value
Definition
Bollinger Bands (created by John Bollinger ) are a way to measure volatility . As volatility increases, the wider the bands become and similarly as volatility decreases, the gap between bands narrows
Bollinger Bands, in widely used approach, consist of a band of three lines. Likewise common usage In this study a band of five lines is implemented
The line in the middle is a Simple Moving Average (SMA) set to a period of 20 bars (the most popular usage). The SMA then serves as a base for the Upper and Lower Bands. The Upper and Lower Bands are used as a way to measure volatility by observing the relationship between the Bands and price. the Upper and Lower Bands in this study are set to two and three standard deviations (widely used form is only two standard deviations) away from the SMA (The Middle Line), hence there are two Upper Bands and two Lower Bands. The background between two Upper Bands is filled with a green color and the background between two Lower Bands is filled with a red color. In this we have obtained Bollinger Band’s (BB) Clouds (Upper Cloud and Lower Cloud)
Additionally the intensity of the color of the background is calculated with Bollinger Bands Width ( BBW ), which is a technical analysis indicator derived from the standard Bollinger Bands indicator. Bollinger Bands Width, quantitatively measures the width between the Upper and Lower Bands. In this study the intensity of the color of the background is increased if BBW value is greater than %25
What to look for
Price Actions : Prices are almost always within the bands especially at this study the bands of three standard deviations away from the SMA. Price touching or breaking the BB Clouds could be considered as buying or selling opportunity. However this is not always the case, there are exceptions such as Walking the Bands. “Walking the Bands” can occur in either a strong uptrend or a strong downtrend. During a strong trend, there may be repeated instances of price touching or breaking through the BB Clouds. Each time that this occurs, it is not a signal, it is a result of the overall strength of the move. In this study in order to get a better understanding of the trend and add ability to perform some advanced technical analysis Directional Movement Indicator (DMI) is added to be used in conjunction with Bollinger Bands.
Cycling Between Expansion and Contraction : One of the most well-known theories in regards to Bollinger Bands is that volatility typically fluctuates between periods of expansion (Bands Widening : surge in volatility and price breaks through the BB Cloud) and contraction (Bands Narrowing : low volatility and price is moving relatively sideways). Using Bollinger Bands in conjunction with Bollinger Bands Width may help identifying beginning of a new directional trend which can result in some nice buying or selling signals. Of course the trader should always use caution
2- Plots Colored Directional Movement Line
Definition
Directional Movement (DMI) (created by J. Welles Wilder ) is actually a collection of three separate indicators combined into one. Directional Movement consists of the Average Directional Index (ADX) , Plus Directional Indicator (+D I) and Minus Directional Indicator (-D I) . ADX's purposes is to define whether or not there is a trend present. It does not take direction into account at all. The other two indicators (+DI and -DI) are used to compliment the ADX. They serve the purpose of determining trend direction. By combining all three, a technical analyst has a way of determining and measuring a trend's strength as well as its direction.
This study combines all three lines in a single colored shapes series plotted on the top of the price chart indicating the trend strength with different colors and its direction with triangle up and down shapes.
What to look for
Trend Strength : Analyzing trend strength is the most basic use for the DMI. Wilder believed that a DMI reading above 25 indicated a strong trend, while a reading below 20 indicated a weak or non-existent trend
Crosses : DI Crossovers are the significant trading signal generated by the DMI
With this study
A Strong Trend is assumed when ADX >= 25
Bullish Trend is defined as (+D I > -DI ) and (ADX >= 25), which is plotted as green triangle up shape on top of the price chart
Bearish Trend is defined as (+D I < -DI ) and (ADX >= 25), which is plotted as red triangle down shape on top of the price chart
Week Trend is assumed when 17< ADX < 25, which is plotted as black triangles up or down shape, depending on +DI-DI values, on top of the price chart
Non-Existent Trend is assumed when ADX < 17, which is plotted as yellow triangles up or down shape, depending on +DI-DI values, on top of the price chart
Additionally intensity of the colors used in all cases above are defined by comparing ADX’s current value with its previous value
Summary of the Study:
Even more simplified and visually enhanced DMI drawing comparing to its classical usage (may require a bit practice to get used to it)
As said previously, to get a better understanding of the trend and add ability to perform some advanced technical analysis Directional Movement Indicator (DMI) is used in conjunction with Bollinger Bands.
PS: Analysis and tests are performed with high volatile Cryptocurrency Market
Source of References : definitions provided herein are gathered from TradingView’s knowledgebase/library
Disclaimer: The script is for informational and educational purposes only. Use of the script does not constitutes professional and/or financial advice. You alone the sole responsibility of evaluating the script output and risks associated with the use of the script. In exchange for using the script, you agree not to hold dgtrd tradingview user liable for any possible claim for damages arising from any decision you make based on use of the script

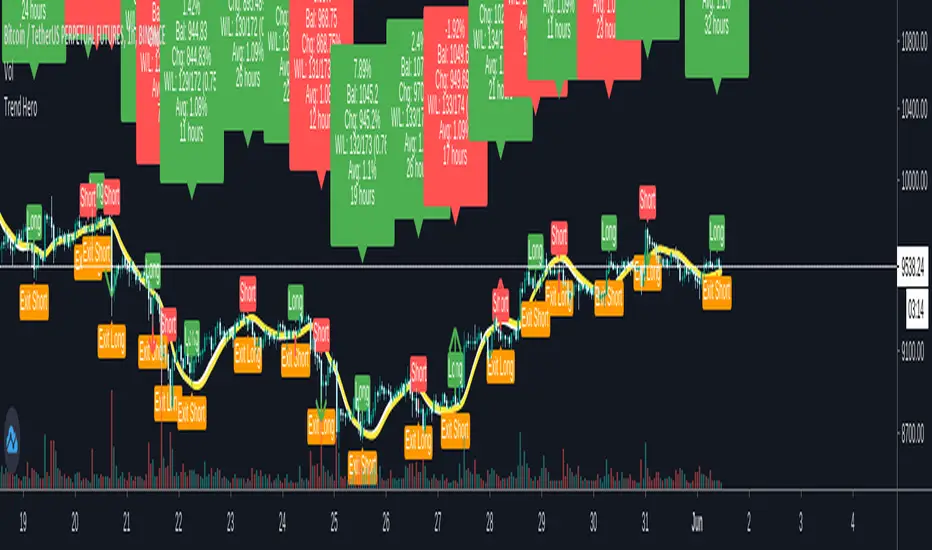
Trend HeroThis script is a strategy based on two Hull Moving averages that cross each other. Upon each cross, the strategy will take a long or a short position. If the faster Hull Moving Average crosses above the slower, a long position is opened. When it crosses towards the other direction, the long position is closed, and a short position is opened.
This backtest is based on results using 2x leverage.
Squeeze Momentum Indicator [LazyBear] vHMAThis is a remake of the famous LazyBear Indicator, the Squeeze Momentum Indicator.
All i did was take out the SMA's and replace them with HMA's. HMA is a more responsive moving average.
Hull Moving Average.
This is a derivative of John Carter's "TTM Squeeze" volatility indicator, as discussed in his book "Mastering the Trade" (chapter 11).
Black crosses on the midline show that the market just entered a squeeze ( Bollinger Bands are with in Keltner Channel). This signifies low volatility , market preparing itself for an explosive move (up or down). Gray crosses signify "Squeeze release".
Mr.Carter suggests waiting till the first gray after a black cross, and taking a position in the direction of the momentum (for ex., if momentum value is above zero, go long). Exit the position when the momentum changes (increase or decrease --- signified by a color change). My (limited) experience with this shows, an additional indicator like ADX / WaveTrend, is needed to not miss good entry points. Also, Mr.Carter uses simple momentum indicator , while I have used a different method (linreg based) to plot the histogram.
More info:
- Book: Mastering The Trade by John F Carter
Here is the original version:

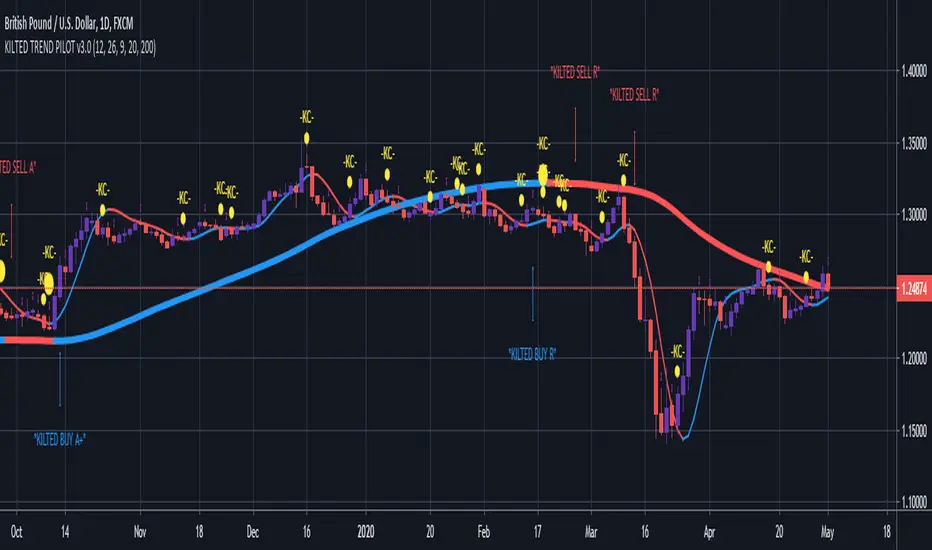
KILTED TREND PILOTDescription: Uses the Hull Moving Average ( HMA ) and MACD to observe the following strategy, to assist with trade setups and provide confluence. It is especially effective when used with the Kilted Strength Meter to make sure there is an active trend and the market is not moving sideways.
SETTINGS AND EXPLANATION
1. The strategy is a very simple and visual one where you go:
• Long when the short HMA colour matches the long HMA colour (which is when the 2 colours are blue for a long position).
• Short when the short HMA colour matches the long HMA colour (which is when the 2 colours are red for a short position)
2. Ideally you want to enter a trade when the market is trending and not moving sideways, hence the reason the Kilted Strength Meter makes a great companion to complement this strategy
The V_Wave: Volatility Adaptive Moving AverageThis is work in progress - but i wanted to see if there's interest to use or test it - or if someone finds it useful. there's already a crowd of great moving averages out there :)
This is a different type of zero-lag weighted moving average - and it's a concept that i have been working on for a while now. Given that this is WIP, i decided to keep the code protected for now.
The idea is to create a moving average that responds faster to the changes in the underlying data - which is the case with other zero-lag moving averages - but in this case, i also wanted to make it adaptive, so it accelerate when the volatility increases and at the same time, maintain limited lag and reasonable smoothing, even at longer length.
How Does it Compare to other MA's
==============================
in the chart, we can see a comparison between the V_Wave (thick yellow line) and the 3 common MAs, Hull Moving Average (HMA, aqua), a Weighted Moving Average (WMA, brown) and an Exponential Moving Average (EMA, grey)
the most important advantage in V_Wave, is because of the way the algorithm works, and that it maintains direct association with the underlying data and the given length, the V_Wave will have less overshoot when compared to other moving averages - i.e, it stays closer to the underlying data points at times of quick reversals or big changes - like the V reversal on the right of the chart. You can also test it against other MAs you may be already using and share your findings back with me.
settings:
=========
- the settings provide the ability to choose the source data (close vs hl2, ..etc), the length, and the ability to adjust the "aggressiveness" of the line (Accelerator) ..
- this accelerator is the factor that tells the V_Wave how fast to respond to the volatility changes. when you increase the accelerator, the V_Wave is more aggressive, and will respond faster to changes in volatility -- it becomes more responsive to changes in the trend, but that will sacrifice the smoothness of the line.
- i capped this value to 7, because beyond that, the accelerator will have a diminished effect.
- Also note that due to association with volatility, the V_Wave will behave differently at lower time frames -- and becomes closer to an EMA but better (in responsiveness) than a WMA.
- the smoothing is built-in for now, and will adjust based on the length, in a way similar to how HMA smoothing works (see my previous post on Evolving the Zero Lag MA for details on that) - in future versions, i may make it a manual entry or a selection between manual/automatic
Usage:
=======
Use the V_Wave as you use other moving averages - once you get to know how it behaves and adapts to underlying data changes.
you can use it as a filter to generate signals once it crosses other MAs, or another V_Wave of a different length / acceleration.
will be great if you share your test results and your use cases to help me improve how the V_Wave works.
best of luck!

TA Basics: Evolving our Zero Lag Moving Average.In the previous Zero-Lag MA post, we introduced the "mirroring" technique and the associated calculation.
In this post, we will see how we can use the same technique, with a slight variation, to evolve our zero lag moving average line, add more "smoothness" and still maintaining the low lag and fast response to data series changes.
to use the "mirroring" technique, we need to use 2 MA lines with varying speeds - this is essential to produce the delta between the lines, that can then be mirrored around the fast line to produce the final line. in the first example, we used a Simple MA (slow) and a Weighted MA (fast) of the same length to achieve that.
here we introduce a different way of doing that. we will use a Weighted MA of the length (slow) and another Weighted MA of half the length (fast) -- the difference in "speed" between these 2 lines should produce the delta we need, we mirror it around the fast line, and we get our desired Zero-lag line. Check!
then while we're at it, why don't we introduce an additional smoothing just to ensure the new line is not too "broken" and jumpy .. and flows smoothly across the data series. but what length should we use for smoothing?
smoothing length should be enough to make an actual smoothing effect, but not too large else it will introduce lagging on its own. how about 3? usually 3 or 4 are good values for smoothing. A brilliant idea here is to use a number related to the same input length of the original line, which can always be relatively small -- the square root (integer portion) of that original length - and in that case, the user will only need to enter 1 input for the moving average, just the length - everything will be calculated from there. Check again!
I commented the code if you like to follow the simplified build-up of the formula, now that the concept is explained.
the (more complex-looking) 1-line, condensed form of that formula to use is (alert: watch out for the ()'s -- they're tricky :) )
----------------------------------------------
ZLMA_Line = wma((2*wma(close,int(length/2)) - wma(close,length)), int(sqrt(length)))
------------------------------------------
the one thing i do not like about this technique, is that we introduce the use of the half length MA. i do not like to build indicators that make decisions like this on behalf of the trader - the trader wants to analyze the data for a specific length, and we should continue to stick to that consistently across the moving average (or whatever indicator) calculation. I would always be caution about "hardcoding" some optional values (in this case 0.5 * length) within the indicator itself - others may not mind that.
Now to a nice surprise for the patient folks who got so far in this post - Congratulations, we have just discovered the concept and the formula behind the famous Hull Moving Average .. the big thing here is, we just had the opportunity to learn how to create the whole thing ourselves from the ground up step by step, and had fun doing it (I hope!)
-- these posts are meant to provide those who are new to the world of technical analysis and want to learn how and why to build their own technical indicators. i hope some of you find them useful and interesting, and i wish you the best of luck.