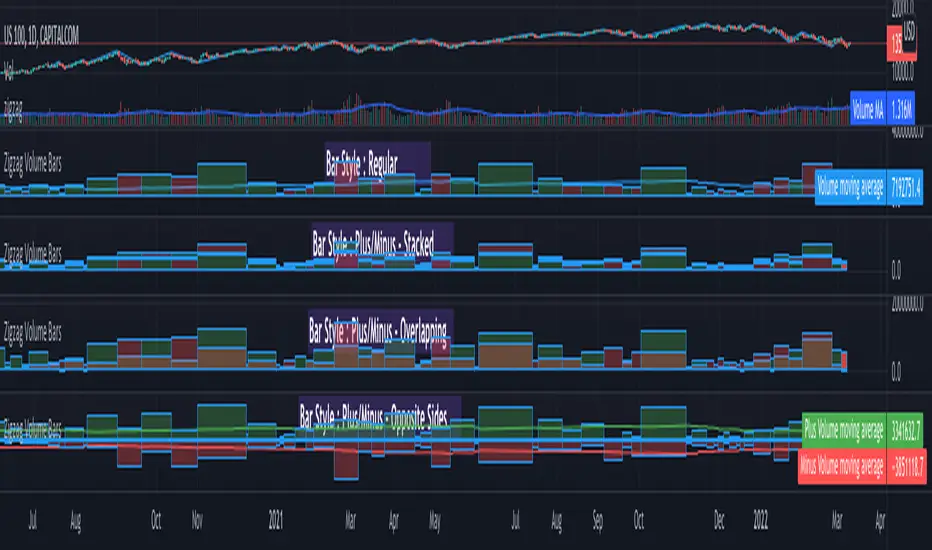
Zigzag Volume BarsBack to my favourite topic - Zigzags.
Here is an indicator which can help you visualise volume data on Zigzag swing highs and lows.
Settings are pretty simple and provides variety of display options
Display options are as demonstrated in the chart has following main types.
Regular
Plus/Minus - Stacked
Plus/Minus - Overlapping
Plus/Minus - Opposite Sides
Apart from the main display types, stacked display has several sub-types which determine whether to place green bar below red or the other way around.
Snapshot below shows example of each type.
Hewhomustnotbenamed
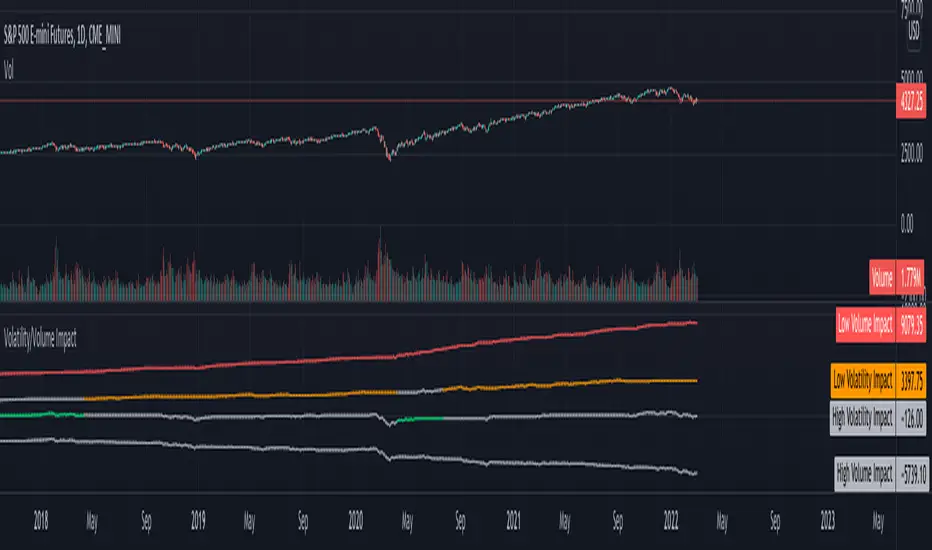
Volatility/Volume ImpactWe often hear statements such as follow the big volume to project possible price movements. Or low volatility is good for trend. How much of it is statistically right for different markets. I wrote this small script to study the impact of Volatility and Volume on price movements.
Concept is as below:
Compare volume with a reference median value. You can also use moving average or other types for this comparison.
If volume is higher than median, increment positive value impact with change in close price. If volume is less than median, then increment negative value impact with change in close price.
With this we derive pvd and nvd which are measure of price change when volume is higher and lower respectively. pvd measures the price change when volume is higher than median whereas nvd measures price change when volume is lower than median.
Calculate correlation of pvd and nvd with close price to see what is impacting the price by higher extent.
Colors are applied to plots which have higher correlation to price movement. For example, if pvd has higher correlation to price movement, then pvd is coloured green whereas nvd is coloured silver. Similarly if nvd has higher correlation to price then nvd is coloured in red whereas pvd is coloured in silver.
Similar calculation also applied for volatility.
With this, you can observe how price change is correlated to high/low volume and volatility.
Let us see some examples on different markets.
Example 1: AMEX:SPY
From the chart snapshot below, it looks evident that SPY always thrive when there is low volatility and LOW VOLUME!!
Example 2: NASDAQ:TSLA
The picture will be different if you look at individual stocks. For Tesla, the price movement is more correlated to high volume (unlike SPY where low volume days define the trend)
Example 3: KUCOIN:BTCUSDT
Unlike stocks and indices, high volatility defined the trend for BTC for long time. It thrived when volatility is more. We can see that high volume is still major influencer in BTC price movements.
Settings are very simple and self explanatory.
Hint: You can also move the indicator to chart overlay for better visualisation of comparison with close price.
WVF - OscillatorAnother attempt on making use of CM-Williams-Vix-Fix-Finds-Market-Bottoms from Chris Moody - which is arguably one of the best indicator available on pine and tradingview platform. Every time I revisit this, I get new ideas on applying this method.
I have slightly altered formula to
highest(source)-source/highest(source)
from the original formula
highest(close)-low/highest(close)
Process is simple:
Calculate WVF for OHLC values separately
Calculate momentum on each of the WVF values based on distance from moving average
Plot the candles based on OHLC momentum.
Candle color depends on whether close, open and previous close. If close is higher than open and previous close, we get green coloured candles. If close is lower than previous close and open then we get red coloured candles. In all other cases, we will have silver candles.
High/Low bands are calculated based on median of highest and lowest values of VixFix. We also plot median of close which can be used in some cases.
How to use this to find market bottom. Look for one of the below conditions:
First red candle above high band - which signals momentum of vix fix is about to fall.
First red candle above median line - can be used only if upward momentum of wvf candles are trending well.
Crossunder of wvf candles under high band.
Possible exit scenarios
Green WVF candle formed above WVF high line
Entry is taken on first red candle above median line - but, candles turned green before WVF crossing under median line - may signal our thesis is wrong and price may drop further.
Some examples.

Intrabar OBV/PVTI got this idea from @fikira's script Intrabar-Price-Volume-Change-experimental
The indicator calculates OBV and PVT based on ticks. Since, the indicator relies on live ticks, it only starts execution after it is put on the charts. The script can be useful in analysing intraday buy and sell pressure. Details are color coded based on the values.
Data is presented in simple tabular format.
Formula for OBV and PVT can be found here:
www.investopedia.com
www.investopedia.com

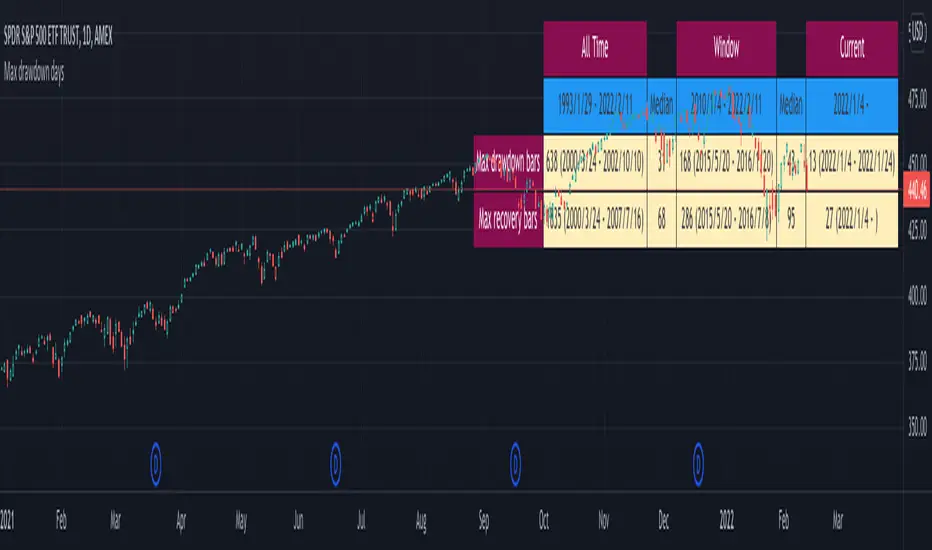
Max drawdown daysA friendly reminder to myself and rest of the traders that market can stay low for prolonged time!!
Details are pretty simple.
Here is small comparison of the stats for major US indices.
Can also be applied to stocks. Cells are highlighted in red background ii
Drawdown/Recovery is still in progress for historical stats
Current drawdown bars/recovery bars are higher than that of median of All time stats.
Historical Range (Using eStrategy library)⬜ The script is intended to cover few things.
▶ Strategy testing framework based on eStrategy library
▶ Using historicalrange of values for identifying better entry and exits.
This is also built on top of the Systematic Investment Plan script published here
⬜ Strategy testing framework
Strategy testing framework is different from tradingview default strategy testing from few ways to suit the needs of systematic investments.
▶ Supports recurring investment on top of initial investment to emulate adding further funds to the investment bucket on regular basis.
▶ Better calculation of drawdowns based on daily equity rather than drawdown calculated only on close of trade.
▶ Provides better control over how much strategy can reduce and reload
Having said that, this framework is not intended as replacement for tradingview strategy framework. It is not as comprehensive as tradingview strategy framework. But, created to address few specific styles of strategy.
▶ No detailed trade stats on individual trades. But, this can be implemented in future versions
▶ At present only facilitates long positions.
▶ UI features such as plotting trades on chart are not available.
▶ Does not take into consideration of slippage and brokerage - this is not an issue because the framework is not meant for short term trades. It is only made for daily timeframes.
▶ No pyramiding or leverage possible.
And many more...
Framework can be used for similar strategies based on market timing with few small changes.
⬜ Historical Range Strategy
Concept here is, instead of taking indicators such as oscillators as is, use historical percentile to derive better oversold and overbought conditions. Strategy provides different options to base historical range. This can either be based on
▶ Band percent
▶ Oscillator
Different choices of bands and oscillators are also available to chose. However, have not done extensive testing on all the combinations.
⬜ Settings
▶ Initial and recurring investment settings (As confirm inputs)
▶ Buy and hold and strategy specific settings to be used for stat calculation
▶ Band and oscillator parameters
These are straightforward parameters which is used for defining the base of either bands or oscillators.
▶ Percentile moving average parameter
Percentile MA is used with Percentile to find entry and exit signals based on crossover and crossunder.
Feedbacks and suggestions welcome.

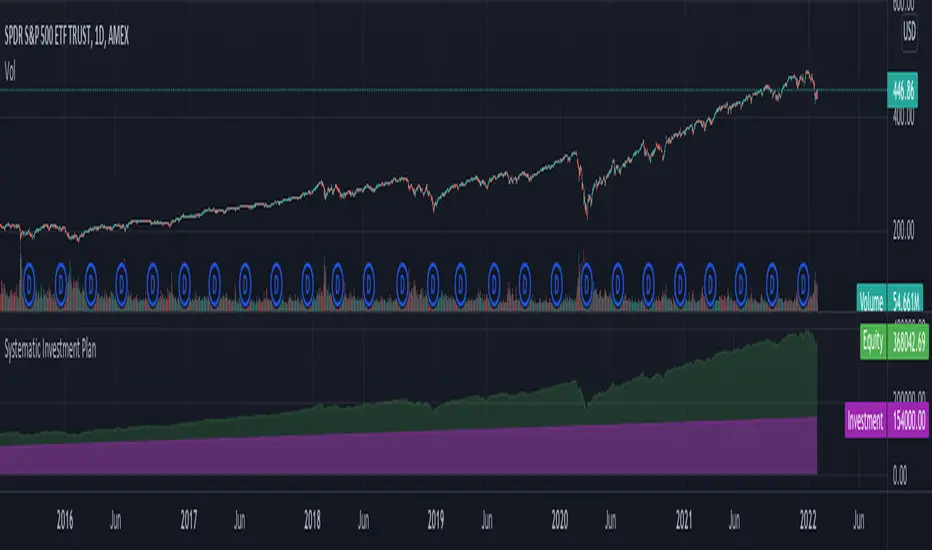
Systematic Investment PlanTradingview default strategy tester has few limitations. To name some:
Tradingview default strategy tester does not have option for periodic investment.
Does not allow reduce and refill kind of operations.
Comparison to buy and hold equity does not take into consideration on number of days invested
Hence, I created this as base for my further experiments with respect to strategies involving market timing.
Settings are quite simple and self explanatory.
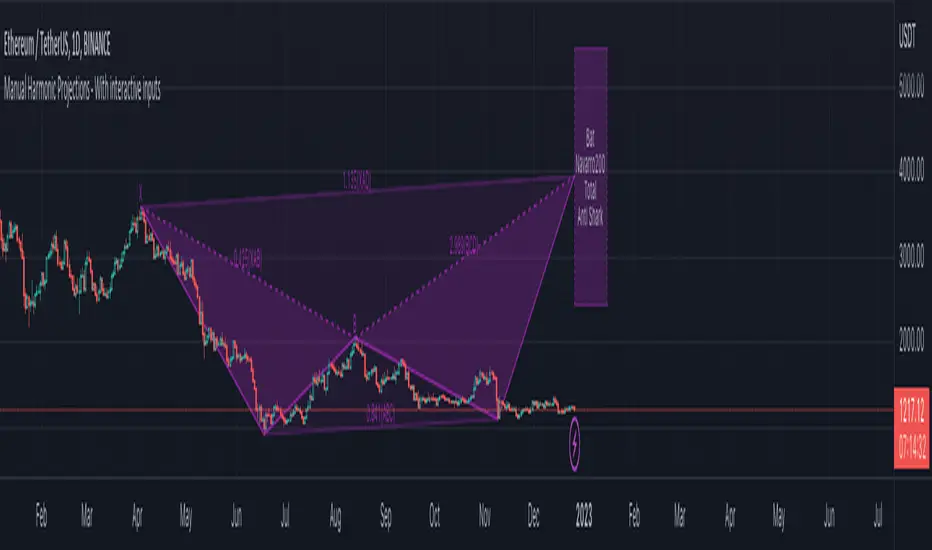
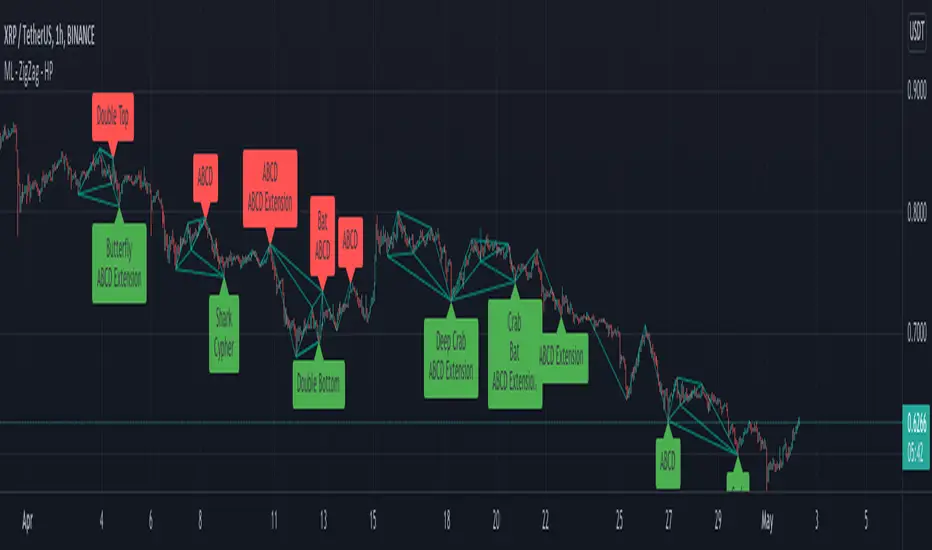
Manual Harmonic Projections - With interactive inputsThis is another script involving interactive inputs. This is similar to Manual-Harmonic-Patterns-With-interactive-inputs . But, instead of taking XABCD and verifying if it confirms to any pattern, here we only take XABC and project all PRZs.
Example, upon adding the script to chart, it will prompt to select 4 points on chart by clicking on it. if we select X, A, B, C as shown in the chart below, we can see the projection of multiple PRZs. Mid of nearest PRZ is considered as D and rest of the pattern is drawn based on this. However, the pattern can have multiple PRZs. All overlapping PRZs are combined together and shown as one along with merged pattern labels. But, if there is gap between PRZs, they are shown separately.
If no projections found, then patterns and projections are not drawn. However, you can still see XABC lines on the chart.
Manual Harmonic Patterns - With interactive inputsThis script is a drawing tool which allows users to draw XABCD on the chart and script will tell whether there is any harmonic patterns on the drawings made. The script is based on interactive inputs and requires users to chose XABCD points.
Please note
This is not a scanner and it will not scan historical bars for harmonic patterns. This needs to be used rather as drawing tool instead.
Script will not check if selected pivots are correct. It assumes users to know how to select the right XABCD based on pivot high/lows. Bullish pattern will have X, B and D as pivot lows and A,C as pivot highs. Similarly bearish patterns will have X, B, D as pivot highs and A, C as pivot lows.
Script will not check for overflow conditions. For example, if price crosses, XB or BD line, then pattern is considered to be invalid. But, this check cannot be made in this script and we require users to be aware of this condition and select input accordingly.
Order of inputs should be in ascending order. X pivot should come before A and then, B, C, D and F. This again is users responsibility to select pivots in right order.
What happens after selecting XABCD?
If selected pattern is valid harmonic pattern, it will
Draw XABCD lines and labels
Fill harmonic triangles
Show PRZ box which shoes the name of valid patterns.
If it is not valid harmonic pattern, then users will see blank XABCD line without any PRZ or filled harmonic triangles.
Example:
1. When it is valid pattern
2. When it is not valid pattern

X-Mas TreeLet's play a game!! Find your Christmas Tree and post it in the comments.
How to use the script?
Open any instrument which best describes the Christmas Tree (Preferably on hourly timeframe).
Apply X-Mas Tree script on the chart.
Enjoy the snowfall, changes in lightings and other animations. Animations only happen if the instrument is in trading session. So, stocks and indexes do not work on weekends and holidays. Use crypto as they are traded 24X7.
Unfortunately cannot post moving charts. But, snapshot of chart will do :)
Well, Please don't ask these questions for this script (Also thanks to @Bjorgum for contributing to this section) 😃
Can you please add alerts?
Does it repaint?
Can we use this for crypto/stock/forex bla bla?
Can you convert this to strategy?
How can I access this indicator?
Can you please give access or how much does it cost?
Can you make it available for MTF?
Indicator is broken. Getting so and so error message etc.
Wish you all MERRY X-MAS and HAPPY NEW YEAR!!

Supertrend - Ladder ATRThis is a supertrend with slight twisted concept which can be very benefecial in strong trending markets to reduce stop loss distance and exit slightly quicker.
⬜ Concept
▶ When the instrument is trending up, regular ATR shows high values if there are big green candles. This affect the stoploss distance in regular supertrend which leads to wide stops or delayed lagging. When you are in long trade, what matters for stoploss is how much a negative candle can move within bar. Hence, using ATR derived only based on red candles is more beneficial for trailing stops on long signals. Same applies to short trades where using ATR derived from only green candles is more efficient than overall ATR.
▶ ATR will be minimal when the volatility is less and ATR will increase with volatility. That means, once you are in trade, the trailing of stoploss also will vary based on ATR (or volatility). With regular ATR and supertrend, chances of stop loss distance widening is high with increased volatility even though stoploss levels will not move down. This again poses the risk of higher drawdown during trade closure and also keeps in the trade during ranging market. To avoid this, the second trick we are using here is only to reduce the atr stoploss difference when in trade. That is, when in long trade and negative candles ATR is increasing, we will not consider that. We will consider the new ATR only if it is lesser than previous bar ATR.
Effect of these changes on the trending market is quite visual. Lets take example of USDTRY
Settings are quite simple and does not vary much from regular supertrend settings.

Currency Strength Meter [HeWhoMustNotBeNamed]⬜ Note: This is not the strength of currency pairs. But, in this script we are trying to derive strength of individual currencies by matching against single base currency.
⬜ Process
This is based on similar concept as that of Magic Numbers for stocks. Idea is simple.
▶ Calculate strength of each currency against USD. Derive the strength for both price movement and volume movement.
▶ Similarly calculate momentum of price and volume change.
▶ If USD is base currency, inverse momentum and strength index for the given symbol.
▶ Once these calculations are done, rank each currencies based on individual score on given things.
▶ Add up all the ranks to derive combined rank
▶ sort the currencies in the ascending order of overall rank.
⬜ USAGE
▶ Identify a base currency. In our case, we have used USD as base currency as it is easy to get pairs of all currencies with USD.
▶ Identify most used combos for all other currencies which are paired with USD. Fx pair can either have USD as base currency or quote currency. It is desirable to use the pair which is most traded. For example, USDJPY is more traded pair than JPYUSD - hence it is advisable to use USDJPY instead of JPYUSD. Similarly AUDUSD is more traded than USDAUD - hence choosing AUDUSD for the purpose of this exercise is better approach. Notice that USDJPY has USD as base currency whereas AUDUSD has USD as quote currency. These calculations are handled internally to derive the right outcome irrespective of position of USD in the pair.
▶ Identify the forex broker which has all the selected forex tickers. All comparison is done against a single broker. Hence, choosing broker which does not wide range of forex pairs will show NAN for many rows.
▶ Once we set these, we get tabular output containing strength and oscillator based trend indexes for both price and volume indicator. Currencies are ordered in descending order of strength. Hence, top of the list can be considered as currency having highest strength and bottom of the table can be considered as currency having lowest strength. Please note that the calculation is valid only for selected timeframe and users can set other parameters such as moving average type, oscillator type, length etc which can alter the outcome.
▶ Use multiple timeframes to find out stronger and weaker currencies. Use directional indicators to understand where they are heading. Combine all these info to come up with currency pair you would like to trade :)
⬜ Settings
▶ Main settings and Currencies
Base Currency : This is set to USD by default as rest of the tickers used are paired with USD. Whatever the base currency is selected, rest of the tickers should follow the same combination.
Timeframe : Timeframe for which rankings need to be calculated.
Currencies : These should be the currency pair which involve base currency defined in the setting on either side.
▶ Display
Table : Allows users to set table location and size of the table. By default this is set to middle center and default size is normal. If user want to use multiple timeframes side by side, they can do so by changing these display settings.
Stat Type : To show either comparative ranking or actual indicator values

Crypto Volume/Strength ComparatorHello Traders,
Here is an attempt to perform comparative analysis between top cryptos based on strength (oscillator) and volume. Methodology used here is similar to Magic Number formula described in the post : Enhanced Magic Formula for fundamental analysis . But, instead of using fundamentals, we are making use of few technicals to derive similar outcome. Usage of the available stats will not be same as Magic number since we are using technicals.
⬜ Process
▶ Get crypto exchange based on prefix of instrument being used.
▶ For the given exchange, get data for all the tickers available in input fields.
▶ Calculate Oscillator, Momentum based on price for each tickers.
▶ Calculate Oscillator, Momentum based on volume for each tickers.
▶ Calculate Volatility for each tickers.
▶ Rank Price-Oscillator, Price-Momentum, Volume-Oscillator, Volume-Momentum, Volatility for each tickers.
▶ Calculate combined rank by adding up individual ranks.
▶ Calculate movement of rankings from bar to bar
▶ Sort tickers based on rank and populate them on table. Display direction of rankings.
⬜ Components
Display components are as follows:
⬜ Settings
Settings are pretty simple and straightforward
⬜ Calculations
▶ Oscillators : High values of oscillators are considered as ideal as the process is intended towards finding trend.
▶ Momentum : Momentum is calculated on the basis of Squeeze Momentum Indicator by @LazyBear.
▶ Volatility : Volatility is calculated on the basis of Williams Vix Fix by @ChrisMoody. Here too since we are in trend following mode, lower vix fix is considered ideal.
⬜ Few Notes
Tickers will show data only if selected exchange has them. Some tickers are not available in all exchanges. In that case, it will show NAN. This is kind of unavoidable as we need to have fixed size arrays for any calculations.
Indicator works only on crypto tickers which has valid exchange.
Tickers move through the rankings in real time. Background of all stats are based on gradient from green to red.
Tickers on top may not always have better long opportunity or tickers at bottom may not always be optimal for shorting. We need to consider how long the instrument may stay in the position or how fast it is moving in opposite direction. Hence, directions of the ranking movement are also shown on the table.

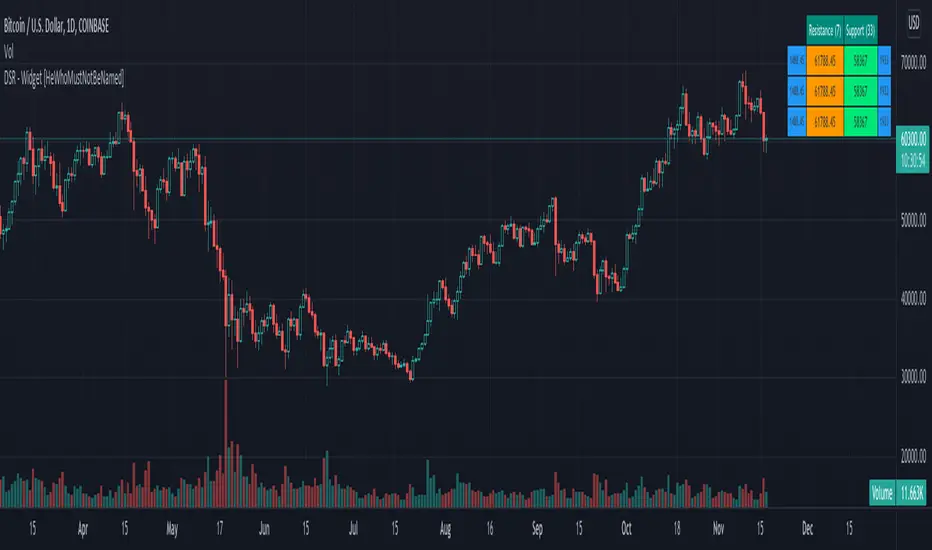
Divergence-Support/Resistance - Widget [HeWhoMustNotBeNamed]Unique live widget which provides information about support and resistance along with distance to immediate levels.
⬜ Custom Candle Source
Three options of candles available
▶ Regular OHLC candles
▶ Heikin-Ashi candles ( Taken leaf out of @Bjorgum's book - but, still could not do it as good as him :) )
▶ Moving average candles
⬜ Multiple zigzags and choice of oscillator
Like any other zigzag based indicator, I prefer using 4 zigzag levels.
And select oscillator of your choice to identify divergence. Oscillator lengths are automatically calculated based on zigzag lengths. You can also chose external oscillator.
⬜ Support and resistance widget settings
▶ Max S/R per zigzag - this is the number of last S/R levels recorded for each zigzag
▶ Max S/R for stats - even though there can be many number of S/R levels, we cannot show all of them in the widget due to space constraint. Hence, this is set to minimal value of 3. Can be changed via this input.
▶ Max S/R for Alerts - When sending stats through alerts, users can decide how many immediate S/R levels to be sent in them.
▶ Alert Choices - Can chose to get alerts when new S/R levels formed and also when existing S/R levels broken.
Personally think it is a very handy widget to have!!
Inverse Divergence [HeWhoMustNotBeNamed]Experimental.
In regular scenario divergence calculation follows these procedure
Pivots on price are considered as primary source
They are compared with pivots on oscillators
Trend bias of price is used
This is an experimental version where
Pivots on oscillators are considered as primary source
They are compared with pivots on price
Trend bias of oscillator is used. Using percentrank to define oscillator trend
Caution: Not meant for trading :)

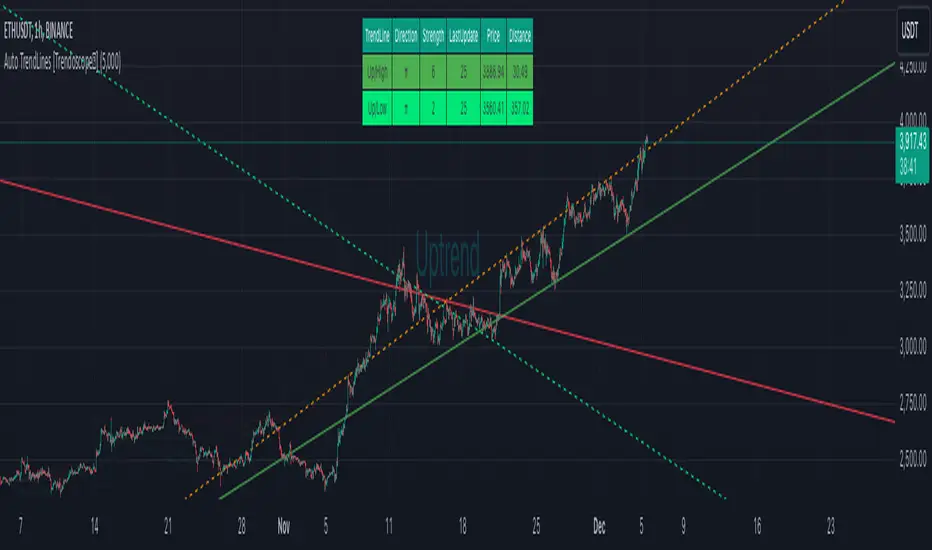
Auto TrendLines [HeWhoMustNotBeNamed]I started off with the intention of creating script to identify Wolfe wave projection. But, soon ran into problem with loops. Realized drawing wedge is more difficult than drawing converging triangle. Hence, took a step back and started working on wedges and triangle identification. Ended up with a messy output which looked like this.
Had to take another step back and hence decided to make Trendlines detection script and here we are :)
⬜ Process
▶ Scan pivots which are in trend. This means, series of pivot Highs or pivot lows either in ascending order or descending order.
▶ Draw trend line between each of the pivots in the trend series. For example, if there are 5 pivot high uptrend pivots, draw mXn lines between each of these points.
▶ Select the trend line which is more accurate or stronger. Accuracy is measured by number of candles/wicks touching the line and number of candles which fall outside the line. Stronger trendlines will touch more candles and pivots with less overflow.
▶ Remove all lines except the most accurate one for each direction.
At any point of time, you will see upto 4 trend lines in this script.
▶ Trendline joining pivot highs in uptrending condition
▶ Trendline joining pivot lows in uptrending condition
▶ Trendline joining pivot highs in downtrending condition
▶ Trendline joining pivot lows in downtrending conditions
The older line will remain until the new one comes through of same type. Hence, you will still be able to see uptrending high and low trend lines for downtrending instruments which are created way back!! Also, new trendlines replace old ones only if they are more stronger (connect to more pivots with less overflow)
⬜ Settings
Settings are simple.
User can select preferred Zigzag Length and Search Depth. Higher numbers for these two parameters will present longer term trends whereas lower numbers will display shorter ones.
Trend Lines controlls will allow users to enable/disable specific type of trend line, set color and line style to it.
⬜ Few Examples
▶ Uptrending Market : NASDAQ:NDX
▶ Downtrending Market : NYSE:BABA
▶ Ranging Market : NYSE:PLTR
Multi-ZigZag Multi-Oscillator Trend DetectorThis table is intended to give you snapshot of how price and oscillators are moving along with zigzag pivots.
This is done in the same lines of Zigzag-Trend-Divergence-Detector
But, here are the differences
Table shows multiple oscillator movements at a same time instead of one selected oscillator
Divergence is not calculated and also supertrend based trend. Trend can be calculated based on zigzag movements. However, lets keep this for future enhancements.
This system also uses multiple zigzags instead of just one.
⬜ Process
▶ Derive multiple zigzags - Code is taken from Multi-ZigZag
▶ Along with zigzags - also calculate different oscillators and attach it to zigzag pivot.
▶ Calculate directions of zigzag pivots and corresponding oscillators.
▶ Plot everything in the table on last bar.
⬜ Table components
Table contains following data:
Directional legends are:
⇈ - Higher High (Green)
⇊ - Lower Low (Red)
⭡- Lower High (Orange)
⭣ - Higher Low (Lime)
⬜ Input Parameters
▶ Source : Default is close. If Unchecked - uses high/low data for calculating pivots. Can also use external input such as OBV
▶ Stats : Gives option to select the depth of output (History) and also lets you chose text size and table position.
▶ Oscillators : Oscillator length is derived by multiplying multiplier to zigzag length. For example, for zigzag 5, with 4 as multiplier, all oscillators are calculated with length 20. But, same for zigzag 8 will be 32 and so on.
▶ Available oscillators :
CCI - Commodity Channel Index
CMO - Chande Momentum Oscillator
COG - Center Of Gravity
MFI - Money Flow Index (Shows only if volume is present)
MOM - Momentum oscillator
ROC - Rate Of Change
RSI - Relative Strength Index
TSI - Total Strength Index
WPR - William Percent R
BB - Bollinger Percent B
KC - Keltner Channel Percent K
DC - Donchian Channel Percent D
ADC - Adoptive Donchian Channel Percent D ( Adoptive-Donchian-Channel )
⬜ Challenges
There are 12 oscillators and each zigzag has different length. Which means, there are 48 combinations of the ocillators.
First challenge was generating these values without creating lots of static initialization. Also, note, if the functions are not called on each bar, then they will not yield correct result. This is achieved through initializer function which runs on every bar and stores the oscillator values in an array which emulates multi dimensional array oscillator X zigzag length.
Next challenge was getting these values within function when we need it. While doing so I realized that values stored in array also have historical series and calling array.get will actully get you the entire series and not just the value. This is an important takeaway for me and this can be used for further complex implementations.
Thanks to @LonesomeTheBlue and @LucF for some timely suggestions and interesting technical discussions :)

Zigzag Candles SupertrendHere it is, as promised, supertrend based on Zigzag candles.
Earlier scripts on the Zigzag Candles expedition are here:
Zigzag-Candles
Zigzag-Candles-MA
Zigzag candles parameters Length and CandleSize remain as is. Along with this, we also add MALength and AtrMult to calculate ATR based on the new candles and to use it to derive supertrend.
UseZigzagCandles - selecting this will apply supertrend on zigzag candles and ignore the actual price candles completely.
UseClosePrices - Uses close price as base instead of high/low. Can be used in both modes of price candles and zigzag candles.
Zigzag Candles MAWe have the candles here: Zigzag-Candles
Lets create moving average!!
Just simple moving average at the moment. Since, items are in array. Not so easy to use standard functions of pine. Hence, will take that for future enhancements.
ATR and Supertrend next!!
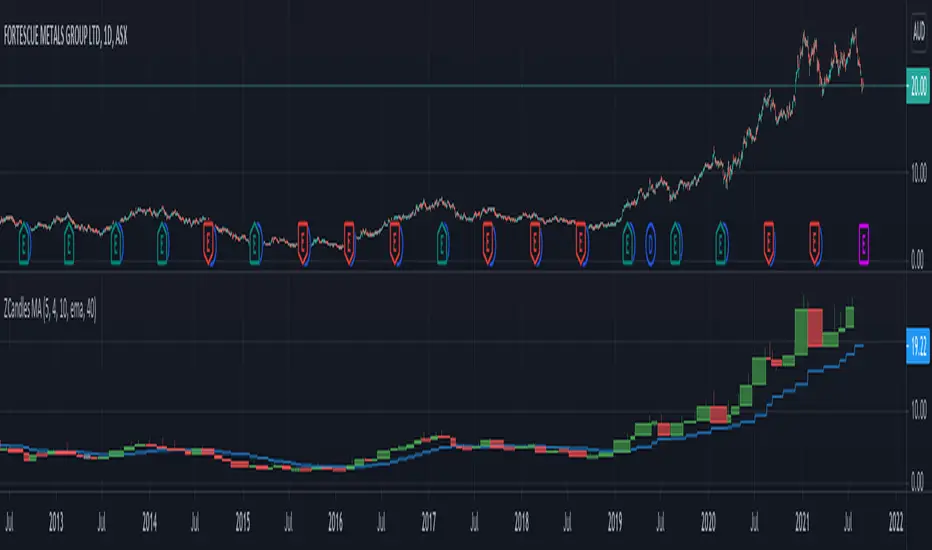
Zigzag CandlesCan't deny that I am obsessed with zigzags. Been doing some crazy experiments with it and have many more in pipeline. I believe zigzag can be used to derive better trend following methods. Here is an attempt to visualize zigzag as candlesticks. Next steps probably to derive moving average, atr (although there was an attempt of AZR made earlier) and probably supertrend too ;)
Input parameters include ZigzagLength (to calculate zigzag) and CandleSize (number of zigzag pivots in each candle)
CandleSize can be 3 or more. Every time we collect pivots which are equal to CandleSize, we derive one candle. And when we derive a candle, we remove all old pivots except the last one. Becauase, the last pivot acts as open to the next bar and is required.
Body of the candle tells the start and end zigzag pivot in the range. And Wicks signify highest and lowest pivots in the range. High and Low wicks are placed at the pivot where high and lows are formed. Hence, you can see them at different positions each time.
Thanks to @RicardoSantos for suggesting boxes for candles - while I was trying to achieve this with plotbar

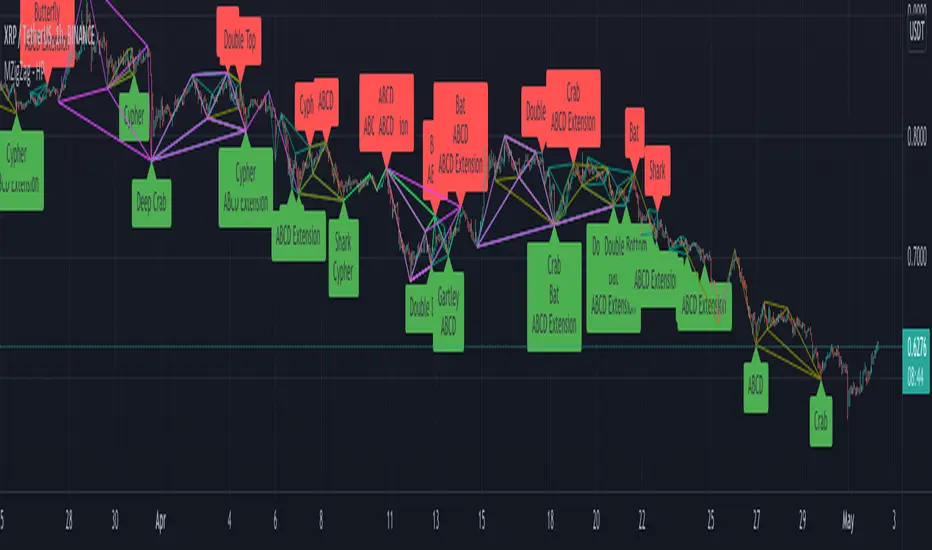
Multi Level ZigZag Harmonic PatternsLets make things bit complicated.
Main difference between this script and the earlier Multi Zigzag Harmonic Pattern is the calculation logic of Zigzag 2, 3 and 4
In the earlier script, all zigzags were plain and were calculated on the basis of different lengths. (Such as 5, 10, 15, 20). These were derived on the basis of Multi Zigzag indicator
In this script, Zigzag 2, 3 and 4 are calculated in slightly different way. They are calculated on the basis of previous zigzag. This means, Zigzag 1 will be the input for Zigzag2 calculation and Zigzag 2 will be the input for Zigzag3 and so on. This is demonstrated in the script - Multi Level Zigzag
One important parameter which is specific to this script is: UseZigZagChain
If checked:
Zigzag2 is formed based on Zigzag1
Zigzag3 is formed based on Zigzag2
Zigzag4 is formed based on Zigzag3
This can lead to patterns covering huge number of candles as this chaining causes exponential effect in each levels. (Effective length grows exponentially in each level)
If unchecked:
Zigzag2 is formed based on Zigzag1 (Same as when checked)
Zigzag3 is formed based on Zigzag1. But, length is set to zigzag2Length + zigzag3Length
Zigzag4 is formed based on Zigzag1. But, length is set to zigzag2Length + zigzag3Length + zigzag4Length
This reduces exponential increase of zigzag lengths over next levels.
Logical ratios of patterns are coded as below:
Notations:
Lines XABCD forms the pattern in all cases. (OXABCD in case of Three drives )
abc = BC retacement of AB, xab = AB retracement of XA and so on
ABCD Classic
0.618 <= abc <= 0.786
1.272 <= bcd <= 1.618
AB=CD
Price difference between AB and CD are equal
Time difference between AB and CD are equal
ABCD Extension
0.618 <= abc <= 0.786
1.272 <= AD/ BC (price) <= 1.618
Gartley
xab = 0.618
0.382 <= abc <= 0.886
1.272 <= bcd <= 1.618 OR xad = 0.786
Crab
0.382 <= xab <= 0.618
0.382 <= abc <= 0.886
2.24 <= bcd <= 3.618 OR xad = 1.618
Deep Crab
xab = 0.886
0.382 <= abc <= 0.886
2.0 <= bcd <= 3.618 OR xad = 1.618
Bat
0.382 <= xab <= 0.50
0.382 <= abc <= 0.886
1.618 <= bcd <= 2.618 OR xad = 0.886
Butterfly
xab = 0.786
0.382 <= abc <= 0.886
1.618 <= bcd <= 2.618 OR 1.272 <= xad <= 2.618
Shark
xab = 0.786
1.13 <= abc <= 1.618
1.618 <= bcd <= 2.24 OR 0.886 <= xad <= 1.13
Cypher
0.382 <= xab <= 0.618
1.13 <= abc <= 1.414
1.272 <= bcd <= 2.0 OR xad = 0.786
Three Drives
oxa = 0.618
1.27 <= xab <= 1.618
abc = 0.618
1.27 <= bcd <= 1.618
5-0
1.13 <= xab <= 1.618
1.618 <= abc <= 2.24
bcd = 0.5
Double Bottom
Last two pivot High Lows make W shape
Last Pivot Low is higher than previous Last Pivot Low.
Last Pivot High is lower than previous last Pivot High.
Price has not gone below Last Pivot Low
Price breaks out of last Pivot High to complete W shape
Double Top
Last two pivot High Lows make M shape
Last Pivot Low is higher than previous Last Pivot Low.
Last Pivot High is lower than previous last Pivot High.
Price has not gone above Last Pivot High
Price breaks out of last Pivot Low to complete M shape
Multi ZigZag Harmonic PatternsCombining Multizigzag with harmonic patterns - this script generates harmonic patterns based on multiple deapth zigzags.
Input parameter allows to chose which Zigzag to be included in pattern identification and set different length, line color, width and style for each Zigzag combinations.
Pattern rules are as below:
Gartley
xab = 0.618
0.382 <= abc <= 0.886
1.272 <= bcd <= 1.618 OR xad = 0.786
Crab
0.382 <= xab <= 0.618
0.382 <= abc <= 0.886
2.24 <= bcd <= 3.618 OR xad = 1.618
Deep Crab
xab = 0.886
0.382 <= abc <= 0.886
2.0 <= bcd <= 3.618 OR xad = 1.618
Bat
0.382 <= xab <= 0.50
0.382 <= abc <= 0.886
1.618 <= bcd <= 2.618 OR xad = 0.886
Butterfly
xab = 0.786
0.382 <= abc <= 0.886
1.618 <= bcd <= 2.618 OR 1.272 <= xad <= 2.618
Shark
xab = 0.786
1.13 <= abc <= 1.618
1.618 <= bcd <= 2.24 OR 0.886 <= xad <= 1.13
Cypher
0.382 <= xab <= 0.618
1.13 <= abc <= 1.414
1.272 <= bcd <= 2.0 OR xad = 0.786
Three Drives
oxa = 0.618
1.27 <= xab <= 1.618
abc = 0.618
1.27 <= bcd <= 1.618
5-0
1.13 <= xab <= 1.618
1.618 <= abc <= 2.24
bcd = 0.5
Related scripts are present here:
Auto Harmonic Patterns - Open SourceI may not be able to spend much time on the harmonic patterns and realized that there are not much open source scripts on them either. Hence, decided to release open source version which can be used by other developers for reference and build things on top of it.
Original script is protected and can be found here:
Logical ratios of patterns are coded as below:
Notations:
Lines XABCD forms the pattern in all cases. (OXABCD in case of Three drives )
abc = BC retacement of AB, xab = AB retracement of XA and so on
ABCD Classic
0.618 <= abc <= 0.786
1.272 <= bcd <= 1.618
AB=CD
Price difference between AB and CD are equal
Time difference between AB and CD are equal
ABCD Extension
0.618 <= abc <= 0.786
1.272 <= AD/ BC (price) <= 1.618
Gartley
xab = 0.618
0.382 <= abc <= 0.886
1.272 <= bcd <= 1.618 OR xad = 0.786
Crab
0.382 <= xab <= 0.618
0.382 <= abc <= 0.886
2.24 <= bcd <= 3.618 OR xad = 1.618
Deep Crab
xab = 0.886
0.382 <= abc <= 0.886
2.0 <= bcd <= 3.618 OR xad = 1.618
Bat
0.382 <= xab <= 0.50
0.382 <= abc <= 0.886
1.618 <= bcd <= 2.618 OR xad = 0.886
Butterfly
xab = 0.786
0.382 <= abc <= 0.886
1.618 <= bcd <= 2.618 OR 1.272 <= xad <= 2.618
Shark
xab = 0.786
1.13 <= abc <= 1.618
1.618 <= bcd <= 2.24 OR 0.886 <= xad <= 1.13
Cypher
0.382 <= xab <= 0.618
1.13 <= abc <= 1.414
1.272 <= bcd <= 2.0 OR xad = 0.786
Three Drives
oxa = 0.618
1.27 <= xab <= 1.618
abc = 0.618
1.27 <= bcd <= 1.618
5-0
1.13 <= xab <= 1.618
1.618 <= abc <= 2.24
bcd = 0.5
This script contains everything which original script has apart from stats. Use the original script if you are not developer looking for code reference and prefer having stats table.
I have also developed a strategy based on harmonic patterns which can be found here:
