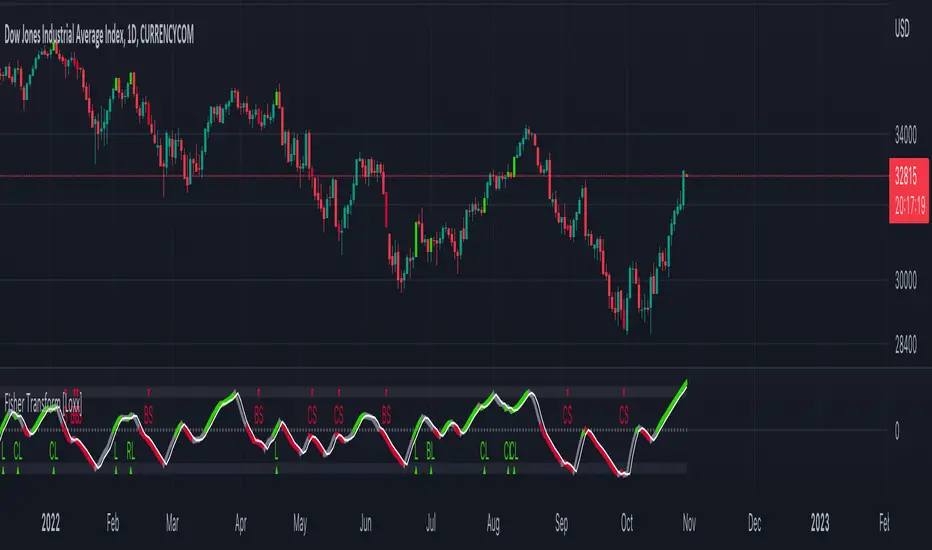
Fisher Transform [Loxx]The Fisher Transform is a technical indicator created by John F. Ehlers that converts prices into a Gaussian normal distribution. The indicator highlights when prices have moved to an extreme, based on recent prices. This may help in spotting turning points in the price of an asset.
What's different between this and regular Fisher Transform?
This version of Fisher Transform morphs the original Fisher Transform concept into a high-powered trading tool that works for all asset classes and all timeframes. There are 1000s of potential combinations of signal output between source selection and filtering preferences. Additional sources, volatility types, and moving averages will be added over time in future releases.
Sources
Loxx's Expanded Source Types enabling ~100 variations of source input including all Heikin Ashi and Better Heikin Ashi types. See here for more information here:
Signals
Initial Long "L": Zero-line or trigger/signal cross-up
Initial Short "L": Zero-line cross-down or trigger/signal cross-down
Continuation Long "CL": When price is in uptrend, cross-up trigger over signal
Continuation Short "CS": When price is in downtrend, cross-down trigger under signal
Post Baseline Cross Long "BL": When trigger and signal cross-up over zero-line but Baseline is still in downtrend, then if Baseline finally turns to uptrend within XX bars, then long
Post Baseline Cross Short "BS": When trigger and signal cross-down under zero-line but Baseline is still in uptrend, then if Baseline finally turns to downtrend within XX bars, then short
Long Exit "LX": When trigger is over XX boundary and trigger crosses down signal
Short Exit "SX": When trigger is under XX boundary and trigger crosses up signal
Filters
Baseline filter
41 Different moving averages to choose from including moving averages including Loxx's Moving Averages. See here for more information on included moving averages:
If the Baseline filter is turned on, the Post Baseline Cross signals are activated. For all Baseline types, the trigger is close, the signal is the moving average. If the trigger is above the signal, price is in an uptrend, if trigger is below the signal, price is in a downtrend. When this selected, the trend of the baseline must match the trend of the Fisher Transform for the signal to be valid.
Volatility filter
Volatility : If price crosses the baseline, we check to see how far it has moved in terms of multiples of volatility denoted in price ( volatility in price x multiple). If price has moved by at least "Qualifier multiplier" and less than "Range Multiplier", then, assuming other factors align in one direction, then a signal is printed
Volatility Types
v1.0 Included Volatility
Average True Range (ATR)
True Range Double (TRD)
Alerts
Includes alerts for all signal types listed above
UI Options
5 color schemes
5 trend coloring schemes
Ability to turn signals on/off
Fisher Transform Backtest
Heikinashi
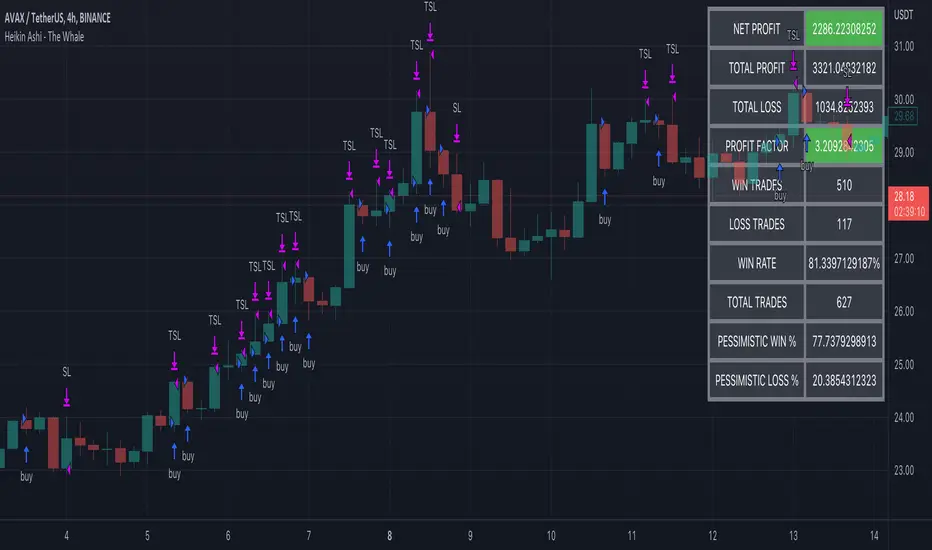
Heikin Ashi - The WhaleThe strategy is based on Heikin Ashi calculation, you do not need to switch the candle to HA.
The HA is used as a base entry, if a candle or two candles are bullish, then is valid to open a position, you can select the validation, one or two candles.
Also, the strategy mainly uses volume indicators as a confluence, you can select VWAP , VWMA , and Volume Oscillator, in addition to ADX which has two ways to validate the entry.
Base entry: One or two bullish HA candles (candles without a lower wick)
Confluence Indicators:
ADX: Will give a positive signal only if ADX is above the threshold, or if +DI is above -DI, or both.
VWAP: will give a positive signal if HA close is above VWAP.
VWMA: composite of 3 MA (20, 25, 50). There are multiple options to set it as confluence, the first option is to check if the short is bigger than the long and long is bigger than the base. The other options are to check the close status, which is bigger than which MA. You can find the description of each option in the strategy box
The sell is based on trailing stop loss (TSL), while the stop loss is based lowest X candle, the strategy will look back to the lowest number of the HA candles and set it as stop loss.
Aarika Trade with the Trend (ATT)Hello traders, purpose of creating this indicator is simply trying to analyse the trend of any symbol.
This indicator is a modification-version of three different indicators from different authors, brought together to create a fine-piece of trend-finder.
This is combination of multi MAs to notice price action with different parameters and calculations.
This indicator generate Green/Red/Yellow bars once all the calculations comes to certain point.
This indicator can be used on any script like Indices, Stocks, Future, Currency & Crypto.
How to trade : This indicator is easy to use on any timeframe and on normal candlestick. Bar colour appeared on candle is based on some calculation and when all the condition are matched; so wait for full candle to be formed and once candle close then go for trade.
Rule for Long trade: Let the current candle form completely. If its a Green colour bar then it indicates a bullish momentum whereas Yellow bar may see a reversal of the current trend.
Rule for Short trade: Let the current candle form completely. If its a Red colour bar then it indicates a bearish momentum whereas Yellow bar may see a reversal of the current trend.
This is not a Holy Grail indicator which always gives profit but if you practice this indicator with consistency, your portfolio may give good returns.
Use proper money management before taking any trade. Go for paper trade and observe how this indicator behaves and once satisfied then only take real trade.
Add - on Feature : we have added HAMA in this indicator. Usually if HAMA is forming Green colour candles then it is a strong bullish trend, whereas Red HAMA candles show bearish trend.
Moreover, if our bar colours are Green and price is above HAMA, it usually shows strong Bull trend; and opposite side Red colour bars with price below HAMA may be seen as a strong Bear trend.
Disclaimer: Please make sure you study this indicator on different timeframes because inserted set of data may act differently on different scripts and may vary from timeframe to timeframe.
We advice you to use this indicator for trend-analysis and study purpose only. Author/publisher of this indicator is not responsible for your profit or loss if you use this indicator for trading purpose one way or another.
N.B.: We do not recommend using HeikinAshi charting for this particular indicator as the data inputs may behave differently than expected. If you have any query, you may comment below.

Williams %R on Chart w/ Dynamic Zones [Loxx]Williams %R on Chart w/ Dynamic Zones is a Williams %R indicator but instead of being an oscillator it appears on chart. The WPR calculation used here leverages T3 moving average for its calculation. In addition, the WPR is bound by Dynamic Zones.
What is Williams %R?
Williams %R , also known as the Williams Percent Range, is a type of momentum indicator that moves between 0 and -100 and measures overbought and oversold levels. The Williams %R may be used to find entry and exit points in the market. The indicator is very similar to the Stochastic oscillator and is used in the same way. It was developed by Larry Williams and it compares a stock’s closing price to the high-low range over a specific period, typically 14 days or periods.
What is T3 moving average?
Developed by Tim Tillson, the T3 Moving Average is considered superior to traditional moving averages as it is smoother, more responsive and thus performs better in ranging market conditions as well.
What are Dynamic Zones?
As explained in "Stocks & Commodities V15:7 (306-310): Dynamic Zones by Leo Zamansky, Ph .D., and David Stendahl"
Most indicators use a fixed zone for buy and sell signals. Here’ s a concept based on zones that are responsive to past levels of the indicator.
One approach to active investing employs the use of oscillators to exploit tradable market trends. This investing style follows a very simple form of logic: Enter the market only when an oscillator has moved far above or below traditional trading lev- els. However, these oscillator- driven systems lack the ability to evolve with the market because they use fixed buy and sell zones. Traders typically use one set of buy and sell zones for a bull market and substantially different zones for a bear market. And therein lies the problem.
Once traders begin introducing their market opinions into trading equations, by changing the zones, they negate the system’s mechanical nature. The objective is to have a system automatically define its own buy and sell zones and thereby profitably trade in any market — bull or bear. Dynamic zones offer a solution to the problem of fixed buy and sell zones for any oscillator-driven system.
An indicator’s extreme levels can be quantified using statistical methods. These extreme levels are calculated for a certain period and serve as the buy and sell zones for a trading system. The repetition of this statistical process for every value of the indicator creates values that become the dynamic zones. The zones are calculated in such a way that the probability of the indicator value rising above, or falling below, the dynamic zones is equal to a given probability input set by the trader.
To better understand dynamic zones, let's first describe them mathematically and then explain their use. The dynamic zones definition:
Find V such that:
For dynamic zone buy: P{X <= V}=P1
For dynamic zone sell: P{X >= V}=P2
where P1 and P2 are the probabilities set by the trader, X is the value of the indicator for the selected period and V represents the value of the dynamic zone.
The probability input P1 and P2 can be adjusted by the trader to encompass as much or as little data as the trader would like. The smaller the probability, the fewer data values above and below the dynamic zones. This translates into a wider range between the buy and sell zones. If a 10% probability is used for P1 and P2, only those data values that make up the top 10% and bottom 10% for an indicator are used in the construction of the zones. Of the values, 80% will fall between the two extreme levels. Because dynamic zone levels are penetrated so infrequently, when this happens, traders know that the market has truly moved into overbought or oversold territory.
Calculating the Dynamic Zones
The algorithm for the dynamic zones is a series of steps. First, decide the value of the lookback period t. Next, decide the value of the probability Pbuy for buy zone and value of the probability Psell for the sell zone.
For i=1, to the last lookback period, build the distribution f(x) of the price during the lookback period i. Then find the value Vi1 such that the probability of the price less than or equal to Vi1 during the lookback period i is equal to Pbuy. Find the value Vi2 such that the probability of the price greater or equal to Vi2 during the lookback period i is equal to Psell. The sequence of Vi1 for all periods gives the buy zone. The sequence of Vi2 for all periods gives the sell zone.
In the algorithm description, we have: Build the distribution f(x) of the price during the lookback period i. The distribution here is empirical namely, how many times a given value of x appeared during the lookback period. The problem is to find such x that the probability of a price being greater or equal to x will be equal to a probability selected by the user. Probability is the area under the distribution curve. The task is to find such value of x that the area under the distribution curve to the right of x will be equal to the probability selected by the user. That x is the dynamic zone.
Included
Bar coloring
Channels fill
Loxx's Expanded Source Types
35+ moving average types

Heikin Ashi Volatility Percentile - TraderHalaiThe Heikin Ashi Volatility Percentile (HAVP) Oscillator was inspired by the legendary Bollinger Band Width Percentile indicator(known as BBWP), written by Caretaker, and made famous by Eric Krown, a famous influencer.
This script borrows aspects of the BBWP indicator which enables the HAVP oscillator to visually match the look and feel of BBWP and allows similar configuration functions (such as colouring function, smoothing MAs and alerts)
The fundamentals of this script are however different to BBWP. Instead of Bollinger band width, this script uses a reverse function of Heikin Ashi close (implemented in my Smoothed Heikin Ashi Trend
indicator, linked below).
The reverse Heikin Ashi close is smoothed using Ehler's SuperSmoother function, providing smooth oscillation and earlier signals of volatility tops and bottoms.
From an automated backtest that I have conducted on the BTCUSD index pair, I have observed comparable performance to BBWP across multiple timeframes when combining with stochastic direction to give a bias on overall direction. Using parameters I have tested, it performs better on mid-term timeframes such as 3h,4h and 6h. BBWP outperforms on 1h and 1d, with lower timeframes being comparable.
From the results, using HAVP over BBWP tends to result in reduced holding time and more frequent trades, which may or may not be desirable, although the behaviour can be adjusted using the parameters provided.
For instance, the smoother oscillation provided by HAVP provides a great predictability factor and earlier confirmation signals, which is something that Ehler emphasised in his trading style, and something which I agree with personally. I would encourage you to try out both HAVP and BBWP and see which fits your trading style.
Releasing this as open source allows for the betterment of the community and further development, criticism and discussion.
Thanks and enjoy! :)

HeikinAshi_Point (HA-P)Hello?
Traders, welcome.
If you "follow", you can always get new information quickly.
Please also click "Like".
Have a good day.
-------------------------------------
Following the previously published MACD-Total indicator, we are releasing the second indicator.
- index -
1. HA-P Indicator Description
2. Chart interpretation using HA-P indicators
3. More important than indicators is creating a trading strategy
(1. HA-P Indicator Description)
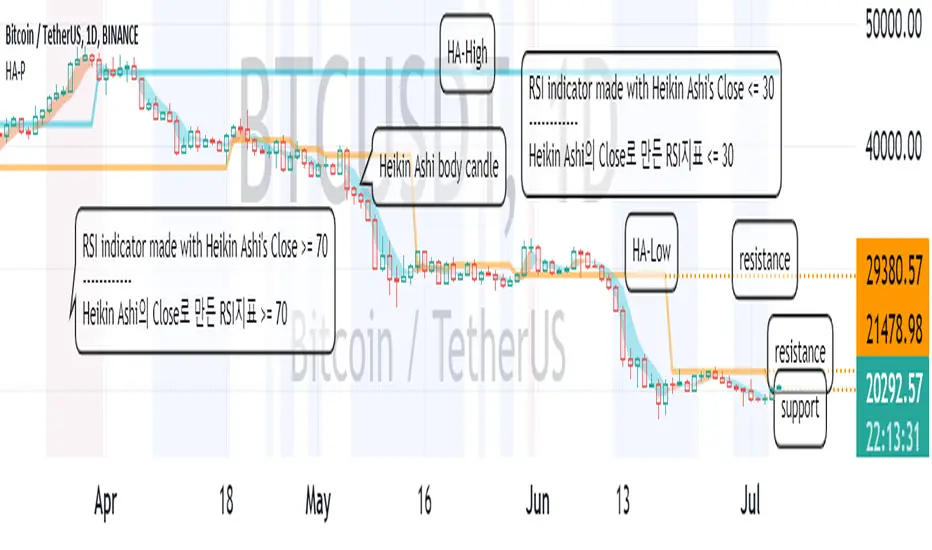
The Heikin Ashi candle chart is a very good way to see trends.
However, it is a pity that the actual price is not known on the chart made of Heikin Ashi candles.
To compensate for this, the body candle part (Open~Close) of the Heikin Ashi candle was filled with the background of the normal candle.
If you see more candles below the bottom of the body candle, you know the strength of the downtrend is high.
Conversely, if more candles are displayed above their body candles equivalent, you can tell that the bullish strength is high.
It can be seen that when the body candle color is displayed in blue, it is more likely to decline, and when it is in yellow, it is more likely to rise.
The Heikin Ashi candle is a trending candle.
Therefore, Heikin Ashi candles cannot be traded on their own.
To complement this, HA-Low and HA-High indicators were created.
The point where the HA-Low and HA-High indicators are leveled serves as support and resistance.
So, the longer the horizontal line, the stronger the support and resistance role.
A typical RSI is usually expressed as Close.
Since the Close of the Heikin Ashi candle is different from the normal Close, we made it to display when the RSI is oversold and overbought as the background of the price chart.
You cannot trade with the RSI indicator and the Heikin Ashi candle.
However, it can be used to detect a change in trend.
This gives you time to react to trend changes.
In order to trade, it is possible to find support and resistance at the HA-Low and HA-High indicators.
------------------------------------------------------------ ------
(2. Chart interpretation using HA-P indicator)
Let's interpret the BTCUSDT 1D chart using the HA-P indicator.
Primary resistance: around 21478.98
Secondary resistance: around 29380.57
It moved higher on the 4th of July, breaking out of the RSI oversold zone.
If it rises above the 19946.21 point and finds support, it is expected to lead to further upside.
However, it needs to rise above 21478.98 for support to lead to further upside.
---------------------------------
(3. More important than indicators is creating a trading strategy)
In order to trade using these indicators, you need to invest a lot of time and observe.
Whether you use an indicator or not, the most important thing in trading is whether you have many trading strategies.
No matter how good indicators and signals are, if you do not have a trading strategy, you will not be able to properly trade due to psychological pressure.
Therefore, it is most important to plan a trading strategy in advance before proceeding with a trade.
- How much money to invest
- How to set up a rough plan for buying in installments and selling in installments
- How to set the Stop Loss point
- How long will the investment be (short-term, medium-term, long-term, etc.)
Basically, the above thoughts must be concretely thought out before proceeding with the investment.
Otherwise, if you buy blindly when the price rises, there is a high possibility that you will end up incurring a loss due to psychological anxiety due to the volatility of the price.
----------------------------------
Aarika Heikin AshiHello Traders,
This indicator is probably based for the people who use HA candlestick chart and frequently have to switch between Japanese candlestick and HA candles. The worry is over with this simple indicator.
Now you can enjoy both candlesticks at the same time.
AHA allows you to have 2 EMAs (mostly used for crossovers). Default values set at 8/21 EMA which we may indicate a trend reversal.
We strongly recommend you back-test everything that you need before you start using AHA.
Thank you.

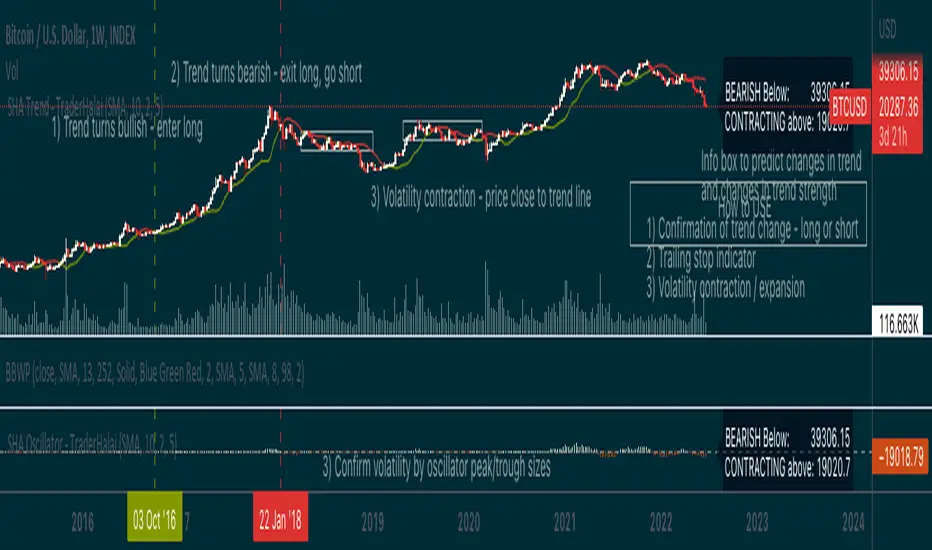
Smoothed Heikin Ashi Trend on Chart - TraderHalaiThis indicator is a predictive tool using Heikinashi to calculate shifts in trade direction.
It works by reverse-engineering the regular candle stick closing price required, to flip the Heiken Ashi candle from Red to Green and vice-versa.
Below, is an earlier indicator that I released and created. This plots this price as an oscillator, which allows traders to get a predictive indicator of a trend change.
This indicator extends upon this functionality by adding a smoothing function to the reverse-engineered regular candle stick closing price, to reduce the choppiness of signals. It also plots the indicator on the chart to allow for easier visual confirmation.
How to use
1) As a directional bias - Bullish or bearish
2) Volatility expansion/contraction - further distance from line means volatility expansion - am planning to release an oscillator version also
3) Trailing stop loss - once you are in a trade
Other Features
Select a moving average period and smoothing calculation method (e.g. SMA / EMA)
Non-repaint mode for backtesting and use/integration with higher timeframes
Final note - Open Source
I am releasing this as open-source for the benefit of the community and to allow further development, scrutiny and criticism. Please feel free to use this indicator as you see fit. If you do use this indicator to create another script, feel free to drop me a note, as I would be highly interested in your idea.
Thanks, and Enjoy!
Heikin Ashi OscillatorThis indicator plots a delta between the Heiken Ashi close price and the regular candlestick closing price as a histogram, which allows you to quickly analyse changes in trend
direction.
It also provides a reverse-engineered closing price for regular candlesticks, to reach in order to maintain the momentum, which allows you to be forewarned of potential pivot points to change in bias in direction.
Feel free to use this indicator to modify and add to your charts as you wish.

[_ParkF]HeikinAshi
In the Input menu, the default value of Location is 1, and HeikinAshi can be seen overlapping the candle.
If you modify the Location value, you can overlay it separately with candle to compare.
(In this case, the HeikinAshi value is different from the actual value, so it is recommended to use it to identify the trend.)
Also, if you move HeikinAshi to a new pane, you can use it as an auxiliary indicator at the bottom.
--------------------------------------------------------------------------------------------------------------------------------------------------------------------------------------------------
Input 메뉴에서 Location의 기본값은 1이며, 헤이킨아시를 캔들과 겹쳐서 볼 수 있게 되어 있습니다.
Location 값을 수정하면 캔들과 따로 overlay 시켜 비교할 수 있습니다.
(이 경우 헤이킨아시의 값은 실제값과 다르니 추세 파악을 위해 사용하시길 권장합니다.)
또, 헤이킨아시를 새 페인으로 옮기면 하단의 보조지표처럼 사용할 수 있습니다.

Rolling Heikin Ashi Candles█ OVERVIEW
This indicator displays a Rolling Heikin Ashi Candles for a given timeframe Multiplier. Contrary to Heikin Ashi Candles Charts, if the timeframe Multiplier is "5", this indicator plots Heikin Ashi Candles OHLC of the last 5 Candles.
█ WHAT IS THE NEED FOR IT
Let's see if we want to use a Higher timeframe OHLC Data using security function or resolution options. The indicator repaints until the higher timeframe Heikin Ashi Candles closes, leading to a repainting strategy or indicator using higher-timeframe data. So we can use Rolling Heikin Ashi Candles in these cases.
█ USES
To Pull out higher timeframe Heikin Ashi Candles OHLC Data to build a non-repainting strategy or indicator.
█ WHY I AM BUILDING THIS SIMPLE INDICATOR
There is no doubt higher timeframe analysis is a critical study to mastering the markets.
I found a necessity for an indicator that analyses multiple higher timeframes and gives us a cumulative or average trend direction. I already built the indicator; I will release it soon. The Indicator I am building is wholly based on my understanding and perspective of Market Structure. Please use this indicator idea to remove the repainting issue when you make an indicator that utilises higher timeframe data.
I am using this in my upcoming indicators. Felt to share before head.
Stay Tuned...
If you have any recommendations or alternative ideas, then please drop a comment under the script ;)


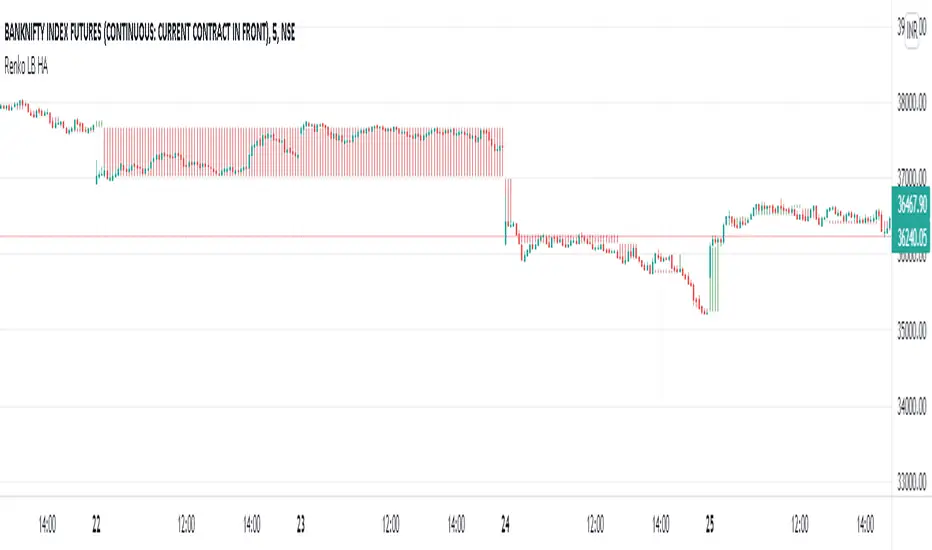
Renko LineBreak HeikinAshi background & MTFWe can have all the 3 types of candle plots (bar styles) over normal candles in the same chart.
We will have better picture on whats happening in specific chart candle type / bar style.
Option provided to turn off/on specific bar type.
Multi time frame is enabled.
Specific time frame can be chosen for individual bar style.
Heikin-Ashi Candle ColoringThis script will change the color of normal candlesticks to the color that the corresponding Heikin-Ashi candles would have.
This allows to spot a trend or a trend reversal just by looking at candles, without using Heikin-Ashi candles, which distort the appearance of a typical chart.

Heikin Ashi Candles [Improved] - real closing priceHeikin Ashi Candles - with real closing price!, and with a Heikin Ashi based moving average!
One of the main functionality of Heikin Ashi is to provide a smoothed price to get clarity in trends. This script builds upon the Heikin Ashi Candlestick I published in 2020 that took the standard Heikin Ashi calculations and added the actual closing price.
The improved version adds a new smoothing calculation to give traders an even better way to display trends. In addition to that, a Heikin Ashi based moving average is added to guide you to take trades in the trend direction. The best part is the users have the ability to display both the real closing price and the Improved Heikin Ashi closing price.
With a few modifications within the smoothing settings, the users can get features like Candle Cloud that provides traders with functionalities like Ichimoku clouds.
Usage:
This indicator serves as a trend tool with enhanced features of the original Heikin Ashi calculations. The indicator help traders to take trades in the same direction of the trend. The new improved version gives traders a new better way to make use of all Heikin Ashi strategies that have been developed during the years. Apply the same methods with this new version.
Disclaimer: No financial advice, only for educational/entertainment purposes.
Heikinashi Candles Biggest problem that when we use normal heikin-ashi candlestick pattern then all applied indicator values also changes
Like Pivot Point with CPR ,,, EMA,,, SMA including VWAP indicator value
So , this indicator help us plot Heikinashi candles on Normal candles
Please follow below steps:
Add this indicator to chart
Go to setting >> un-tick Body, Border and Wick color
That will hide candles on chart and Plot heikinashi candles on Normal candles without changing any indicator value
Remember use normal candle stick pattern that

Heikin Ashi Trailing Stoploss ActivationThe Basics
This indicator should be used on regular candle sticks. It is possible to trigger an alert, when the block flips from red to green bar. Or vice versa.
Red block represents a red Heikin Ashi candle.
Green block for green Heikin Ashi candle.
It can be used as a trailing stoploss for (DCA/ TV) bots, when riding trends.
What Makes It Different
The user can preset the price (of the asset e.g. BTC), where it will start looking for Heikin Ashi flips. Every Heikin Ashi flip before this preset price will be ignored. Preset prices could be chosen tactically at resistance levels.
Different time frames of Heikin Ashi flips can be used together. E.g. 10 min, 3 hour or 2 Day time frames. If this is possible within your Tradingview subscription.
Example
The user has a long position (bought at the green arrow.) The user wants to start trailing at price 88 USDT (blue line).
The indicator will only trigger when the following conditions are met:
Cross of red block on the indicator (representing red Heikin Ashi candle)
Price has crossed 88 USDT
If the candlestick turns from a green to a red block, before crossing 88 USDT. It will NOT trigger the alert. Visible as the orange down arrows. In the indicator below it is displayed as a red block.The alert will go off at the red down arrow on 10th Nov (if chosen for Once per bar close). The price condition of 88 USDT was already met at 7th Nov.
Final Words
Disclaimer: Please use it with care and at own risk. The owner of this indicator is not liable for any financial losses.
Past performance is no guarantee of future returns.

lib_Indicators_v2_DTULibrary "lib_Indicators_v2_DTU"
This library functions returns included Moving averages, indicators with factorization, functions candles, function heikinashi and more.
Created it to feed as backend of my indicator/strategy "Indicators & Combinations Framework Advanced v2 " that will be released ASAP.
This is replacement of my previous indicator (lib_indicators_DT)
I will add an indicator example which will use this indicator named as "lib_indicators_v2_DTU example" to help the usage of this library
Additionally library will be updated with more indicators in the future
NOTES:
Indicator functions returns only one series :-(
plotcandle function returns candle series
INDICATOR LIST:
hide = 'DONT DISPLAY', //Dont display & calculate the indicator. (For my framework usage)
alma = 'alma(src,len,offset=0.85,sigma=6)', //Arnaud Legoux Moving Average
ama = 'ama(src,len,fast=14,slow=100)', //Adjusted Moving Average
acdst = 'accdist()', //Accumulation/distribution index.
cma = 'cma(src,len)', //Corrective Moving average
dema = 'dema(src,len)', //Double EMA (Same as EMA with 2 factor)
ema = 'ema(src,len)', //Exponential Moving Average
gmma = 'gmma(src,len)', //Geometric Mean Moving Average
hghst = 'highest(src,len)', //Highest value for a given number of bars back.
hl2ma = 'hl2ma(src,len)', //higest lowest moving average
hma = 'hma(src,len)', //Hull Moving Average.
lgAdt = 'lagAdapt(src,len,perclen=5,fperc=50)', //Ehler's Adaptive Laguerre filter
lgAdV = 'lagAdaptV(src,len,perclen=5,fperc=50)', //Ehler's Adaptive Laguerre filter variation
lguer = 'laguerre(src,len)', //Ehler's Laguerre filter
lsrcp = 'lesrcp(src,len)', //lowest exponential esrcpanding moving line
lexp = 'lexp(src,len)', //lowest exponential expanding moving line
linrg = 'linreg(src,len,loffset=1)', //Linear regression
lowst = 'lowest(src,len)', //Lovest value for a given number of bars back.
pcnl = 'percntl(src,len)', //percentile nearest rank. Calculates percentile using method of Nearest Rank.
pcnli = 'percntli(src,len)', //percentile linear interpolation. Calculates percentile using method of linear interpolation between the two nearest ranks.
rema = 'rema(src,len)', //Range EMA (REMA)
rma = 'rma(src,len)', //Moving average used in RSI. It is the exponentially weighted moving average with alpha = 1 / length.
sma = 'sma(src,len)', //Smoothed Moving Average
smma = 'smma(src,len)', //Smoothed Moving Average
supr2 = 'super2(src,len)', //Ehler's super smoother, 2 pole
supr3 = 'super3(src,len)', //Ehler's super smoother, 3 pole
strnd = 'supertrend(src,len,period=3)', //Supertrend indicator
swma = 'swma(src,len)', //Sine-Weighted Moving Average
tema = 'tema(src,len)', //Triple EMA (Same as EMA with 3 factor)
tma = 'tma(src,len)', //Triangular Moving Average
vida = 'vida(src,len)', //Variable Index Dynamic Average
vwma = 'vwma(src,len)', //Volume Weigted Moving Average
wma = 'wma(src,len)', //Weigted Moving Average
angle = 'angle(src,len)', //angle of the series (Use its Input as another indicator output)
atr = 'atr(src,len)', //average true range. RMA of true range.
bbr = 'bbr(src,len,mult=1)', //bollinger %%
bbw = 'bbw(src,len,mult=2)', //Bollinger Bands Width. The Bollinger Band Width is the difference between the upper and the lower Bollinger Bands divided by the middle band.
cci = 'cci(src,len)', //commodity channel index
cctbb = 'cctbbo(src,len)', //CCT Bollinger Band Oscilator
chng = 'change(src,len)', //Difference between current value and previous, source - source .
cmo = 'cmo(src,len)', //Chande Momentum Oscillator. Calculates the difference between the sum of recent gains and the sum of recent losses and then divides the result by the sum of all price movement over the same period.
cog = 'cog(src,len)', //The cog (center of gravity) is an indicator based on statistics and the Fibonacci golden ratio.
cpcrv = 'copcurve(src,len)', //Coppock Curve. was originally developed by Edwin "Sedge" Coppock (Barron's Magazine, October 1962).
corrl = 'correl(src,len)', //Correlation coefficient. Describes the degree to which two series tend to deviate from their ta.sma values.
count = 'count(src,len)', //green avg - red avg
dev = 'dev(src,len)', //ta.dev() Measure of difference between the series and it's ta.sma
fall = 'falling(src,len)', //ta.falling() Test if the `source` series is now falling for `length` bars long. (Use its Input as another indicator output)
kcr = 'kcr(src,len,mult=2)', //Keltner Channels Range
kcw = 'kcw(src,len,mult=2)', //ta.kcw(). Keltner Channels Width. The Keltner Channels Width is the difference between the upper and the lower Keltner Channels divided by the middle channel.
macd = 'macd(src,len)', //macd
mfi = 'mfi(src,len)', //Money Flow Index
nvi = 'nvi()', //Negative Volume Index
obv = 'obv()', //On Balance Volume
pvi = 'pvi()', //Positive Volume Index
pvt = 'pvt()', //Price Volume Trend
rise = 'rising(src,len)', //ta.rising() Test if the `source` series is now rising for `length` bars long. (Use its Input as another indicator output)
roc = 'roc(src,len)', //Rate of Change
rsi = 'rsi(src,len)', //Relative strength Index
smosc = 'smi_osc(src,len,fast=5, slow=34)', //smi Oscillator
smsig = 'smi_sig(src,len,fast=5, slow=34)', //smi Signal
stdev = 'stdev(src,len)', //Standart deviation
trix = 'trix(src,len)' , //the rate of change of a triple exponentially smoothed moving average.
tsi = 'tsi(src,len)', //True Strength Index
vari = 'variance(src,len)', //ta.variance(). Variance is the expectation of the squared deviation of a series from its mean (ta.sma), and it informally measures how far a set of numbers are spread out from their mean.
wilpc = 'willprc(src,len)', //Williams %R
wad = 'wad()', //Williams Accumulation/Distribution.
wvad = 'wvad()' //Williams Variable Accumulation/Distribution.
}
f_func(string, float, simple, float, float, float, simple) f_func Return selected indicator value with different parameters. New version. Use extra parameters for available indicators
Parameters:
string : FuncType_ indicator from the indicator list
float : src_ close, open, high, low,hl2, hlc3, ohlc4 or any
simple : int length_ indicator length
float : p1 extra parameter-1. active on Version 2 for defining multi arguments indicator input value. ex: lagAdapt(src_, length_,LAPercLen_=p1,FPerc_=p2)
float : p2 extra parameter-2. active on Version 2 for defining multi arguments indicator input value. ex: lagAdapt(src_, length_,LAPercLen_=p1,FPerc_=p2)
float : p3 extra parameter-3. active on Version 2 for defining multi arguments indicator input value. ex: lagAdapt(src_, length_,LAPercLen_=p1,FPerc_=p2)
simple : int version_ indicator version for backward compatibility. V1:dont use extra parameters p1,p2,p3 and use default values. V2: use extra parameters for available indicators
Returns: float Return calculated indicator value
fn_heikin(float, float, float, float) fn_heikin Return given src data (open, high,low,close) as heikin ashi candle values
Parameters:
float : o_ open value
float : h_ high value
float : l_ low value
float : c_ close value
Returns: float heikin ashi open, high,low,close vlues that will be used with plotcandle
fn_plotFunction(float, string, simple, bool) fn_plotFunction Return input src data with different plotting options
Parameters:
float : src_ indicator src_data or any other series.....
string : plotingType Ploting type of the function on the screen
simple : int stochlen_ length for plotingType for stochastic and PercentRank options
bool : plotSWMA Use SWMA for smoothing Ploting
Returns: float
fn_funcPlotV2(string, float, simple, float, float, float, simple, string, simple, bool, bool) fn_funcPlotV2 Return selected indicator value with different parameters. New version. Use extra parameters fora available indicators
Parameters:
string : FuncType_ indicator from the indicator list
float : src_data_ close, open, high, low,hl2, hlc3, ohlc4 or any
simple : int length_ indicator length
float : p1 extra parameter-1. active on Version 2 for defining multi arguments indicator input value. ex: lagAdapt(src_, length_,LAPercLen_=p1,FPerc_=p2)
float : p2 extra parameter-2. active on Version 2 for defining multi arguments indicator input value. ex: lagAdapt(src_, length_,LAPercLen_=p1,FPerc_=p2)
float : p3 extra parameter-3. active on Version 2 for defining multi arguments indicator input value. ex: lagAdapt(src_, length_,LAPercLen_=p1,FPerc_=p2)
simple : int version_ indicator version for backward compatibility. V1:dont use extra parameters p1,p2,p3 and use default values. V2: use extra parameters for available indicators
string : plotingType Ploting type of the function on the screen
simple : int stochlen_ length for plotingType for stochastic and PercentRank options
bool : plotSWMA Use SWMA for smoothing Ploting
bool : log_ Use log on function entries
Returns: float Return calculated indicator value
fn_factor(string, float, simple, float, float, float, simple, simple, string, simple, bool, bool) fn_factor Return selected indicator's factorization with given arguments
Parameters:
string : FuncType_ indicator from the indicator list
float : src_data_ close, open, high, low,hl2, hlc3, ohlc4 or any
simple : int length_ indicator length
float : p1 parameter-1. active on Version 2 for defining multi arguments indicator input value. ex: lagAdapt(src_, length_,LAPercLen_=p1,FPerc_=p2)
float : p2 parameter-2. active on Version 2 for defining multi arguments indicator input value. ex: lagAdapt(src_, length_,LAPercLen_=p1,FPerc_=p2)
float : p3 parameter-3. active on Version 2 for defining multi arguments indicator input value. ex: lagAdapt(src_, length_,LAPercLen_=p1,FPerc_=p2)
simple : int version_ indicator version for backward compatibility. V1:dont use extra parameters p1,p2,p3 and use default values. V2: use extra parameters for available indicators
simple : int fact_ Add double triple, Quatr factor to selected indicator (like converting EMA to 2-DEMA, 3-TEMA, 4-QEMA...)
string : plotingType Ploting type of the function on the screen
simple : int stochlen_ length for plotingType for stochastic and PercentRank options
bool : plotSWMA Use SWMA for smoothing Ploting
bool : log_ Use log on function entries
Returns: float Return result of the function
fn_plotCandles(string, simple, float, float, float, simple, string, simple, bool, bool, bool) fn_plotCandles Return selected indicator's candle values with different parameters also heikinashi is available
Parameters:
string : FuncType_ indicator from the indicator list
simple : int length_ indicator length
float : p1 parameter-1. active on Version 2 for defining multi arguments indicator input value. ex: lagAdapt(src_, length_,LAPercLen_=p1,FPerc_=p2)
float : p2 parameter-2. active on Version 2 for defining multi arguments indicator input value. ex: lagAdapt(src_, length_,LAPercLen_=p1,FPerc_=p2)
float : p3 parameter-3. active on Version 2 for defining multi arguments indicator input value. ex: lagAdapt(src_, length_,LAPercLen_=p1,FPerc_=p2)
simple : int version_ indicator version for backward compatibility. V1:dont use extra parameters p1,p2,p3 and use default values. V2: use extra parameters for available indicators
string : plotingType Ploting type of the function on the screen
simple : int stochlen_ length for plotingType for stochastic and PercentRank options
bool : plotSWMA Use SWMA for smoothing Ploting
bool : log_ Use log on function entries
bool : plotheikin_ Use Heikin Ashi on Plot
Returns: float

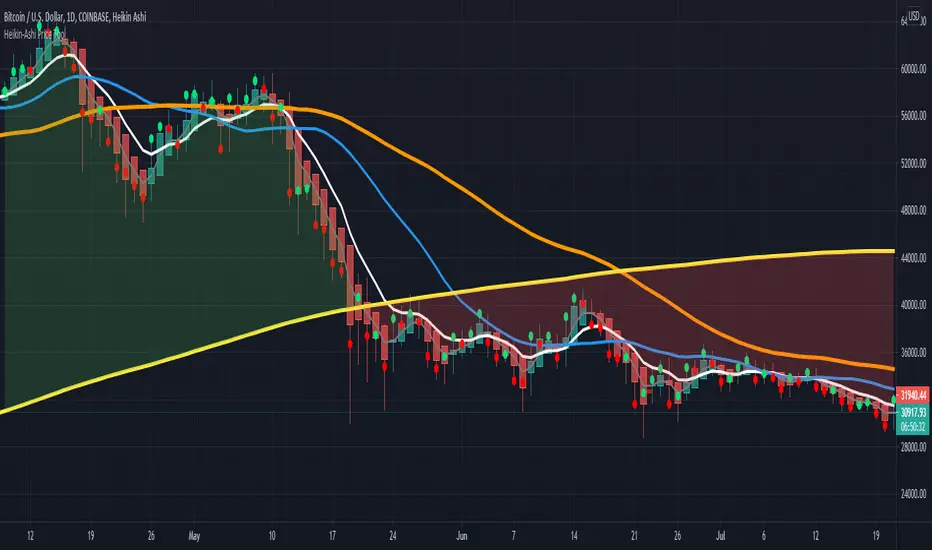
HPT - Heikin-Ashi Price ToolThis overlay study can be used with an Heikin-Ashi chart and diplays the real prices for Heikin-Ashi candles as circles for each bar. If the real closing price of the bar is higher then the opening price, the circle has a green color, otherwise it is red.
Here you can see the overlay : COINBASE:BTCUSD
The follwing moving averages are added to the chart as well: SMA 20, 50, 200 and EMA 8 (for analyzing trend and support/resistance ). A background fill can be activated for the overall trend.
I recommend to lower the opacity for the bars so that you can better see the circles for the real prices.
MTF CandleLevelsIn the spirit of freedom from oppression on this day of July 4th, 2021 in the United States, I hereby release this flagship indicator "MTF CandleLevels" into the wild for any subscribing TV member on the planet to utilize. It's now one my few great gifts to the souls of humankind within the realm of trading on TV. TradingView continues to bless Pine Script by releasing supplemental upgrades, enough for me to develop this indicator beyond it's experimental phase to full potential, as I had always wished to design it from theory. Educationally while using it, you will witness how OHLC/HA candles are actually formed for charts. I like to think of it as a candle formation microscope anyone can learn from.
It is intended for any style of trading or skill level from newcomer to advanced. There are no requirements/prerequisites for you use it. Which means you don't have to wear a mouth muzzle, get multiple doses of the life endangering FrankenJabs, subserviently bow down to authoritarian demands of obedience, or learn the ancient mystical art of deception "Fau Chi" in order to employ it's inherent power. A little sprinkle of satire helps with a dry technical read :). You have the absolute freedom to utilize it any way you see fit! That's right, it's even your choice whether you use it or not. The unshackled empowerment of choice always equates to FREEDOM. I can't program these precious gems without it...
One thing you will have noticed is it's specifically published on a Heikin Ashi(HA) chart, while having immunity to the Heikin Ashi candle charts unique open/close behavior. This has been believed to be an impossibility until now. For members who don't know, HA candle charts have a different `open` and `close` from the `open` and `close` of the other ordinary OHLC candle charts. Regardless of "CandleLevels Mode" chosen in Settings, the indicator will display identical on either bar chart type, excluding Renko, Line Break, Kagi, Point&Figure, and Range candle charts of course. It's abilities supersede the simpler "Multi-Time Period Charts" built-in TV indicator with a completely different architecture. For those of you extremely curious about how I accomplished this indicators level of code complexity, it was immensely difficult taking over a year of effort for this one functional unit, and I will leave it at that...
This novel MTF technology displays OHLC/HA support and resistance levels that mimic the functionality of larger duration candle formations in real time. Basically explained, while charting on a shorter duration timeframe candle chart, you can see open, high, low, and close levels fluctuate in the larger duration timeframe. This reduces the need to jump back and forth to view price action on different chart sampling intervals. You may even use multiple sets of CandleLevels indicators over a wide variety of chosen timeframe options, along with everything else in between.
The CandleLevels behavior is chosen within the indicator "Settings" using a selection mode of either the standard OHLC candlestick formations or Heikin Ashi candlestick formations. Each mode has a multitude of uses depending on the users trading style or timeframe.
Visbility of CandleLevels will ONLY occur when it is set to a larger duration timeframe interval than the current chart sampling rate. For example, you may be using the 5 minute interval sampling rate on the chart, yet you can easily see the open, high, low, close ranges with a chosen 120 minute timeframe setting. The multiple time frame(MTF) settings are highly adjustable having intervals of seconds, minutes, days, a multiple of the chart interval, or the common input(type=input.resolution) function provided by Pine.
CandleLevels come with multiple color schemes to reduce color interference with other indicators in the overlay pane, including the intended use of multiple sets of CandleLevels. My basic color scheme selections can be overridden to choose any imaginable color you desire for your visual acuity. Also, there are additional controls available to fine tune a visually pleasing appearance depending on your preferences and viewable area. One last new hidden fine tune capability, not only for this indicator but all TV indicators, is the agility to use up/down arrow keys on the keyboard when an indicator setting is in focus after mouse selection. For example, when choosing line thickness, you can modify values/options by key stroke. Try it out, I'm sure you will find this useful for any indictor for eternity.
NOTICE: There is only 500 line drawings available, in total to display, at this current release. This equates to 83 sets of CandleLevels maximum.
Features List Includes:
Candle type selection
MTF controls for seconds, minutes, days, multiple-of, and TV input
Multiple color schemes with color overrides
Color opacity selector
Line thickness control
Enable/disable capable MTF interval display with positioning
When available time provides itself, I will consider your inquiries, thoughts, and concepts presented below in the comments section, should you have any questions or comments regarding this indicator. When my indicators achieve more prevalent use by TV members, I may implement more ideas when they present themselves as worthy additions. Have a profitable future everyone!
RISK DISCLAIMER:
My scripts, indicators, and studies are specifically intended for informational and educational use only. These use historical data points to perform calculations to derive real-time calculations. They do not infer, indicate, or guarantee future results or performance.
By utilizing this script/indicator/study or any portion of it, you agree to accept 100% responsibly and liability for your investment or financial decisions, and I will not be held liable for your subjective analytic interpretations incurring sustained monetary losses. The opinions and information visual or otherwise provided by this script/indicator is not investment advice, nor does it constitute recommendation.

Awesome Heikin Ashi [Morty]This indicator uses Heikin Ashi candles and two EMAs to help you follow the trend and enter the trade. Heikin Ashi candles help to smooth the price and EMAs are used to detect trend. The default parameter of EMA is EMA10 and EMA20. You can use it at any timeframe. You should always adjust the EMA length according to different timeframes.
Features:
- Highlight background based on two EMAs
- Adjustable EMA length
- Adjustable Label size
- Show entry and exit signal labels
- Show stoploss price
- You can choose Long only or Short only or both signals
- Alert functions for notification
NOTE: If you use this signal to enter a trade, make sure the candle is close and enter in the next candle.

HTF Candles by DGThigher timeframe (multi timeframe) candles
a simple study introducing new pine function box.new

[jav] HeikinAshized OscillatorsThis script allows to HeikinAshize different commonly used centered oscillators.
It plots them like Heikin Ashi candles. In this way, we can eliminate some of the noise and uncertainty that is inherent to applying only one calculation period to the oscillators.
Applying Heikin Ashi to an oscillator might be advantageous compared to applying it directly to the chart, because you are not altering price readings. The obvious advantage is the clear visualization of the trend directions without noise.
INPUTS
The oscillators included are:
Relative Strength Index (RSI)
Stochastic
Stochastic RSI
Fisher transform
Inverse Fisher Transform of RSI (IFTRSI)
Commodity Channel Index (CCI)
Money Flow Index (MFI)
Chande Momentum Oscillator (CMO)
Momentum (MOM)
True Strength Index (TSI)
Williams' Percent Range (WPR).
Apart from the choice of one of these indicators, only two more inputs are required:
the main (median) period and
the % of variability of this period.
RESULTS
The script calculates 4 evenly spaced periods from that data (period and variability), e.g. for a period of 50 and a variability of 30%, the script calculates oscillator values for 4 different periods evenly spaced around 50, (35, 45, 55, 65) and uses these 4 values to draw the Heikin Ashi candle.
The script also plots the usual upper/lower (overbought/oversold) values, as well as the central line.
CREDITS
The interesting concept of applying Heikin Ashi to an oscillator was recently introduced in Tradingview by @JayRogers . Many thanks for the idea.
For Heikin Ashi calculations, the useful script by @allanster was taken as a reference.
Any improvements, modifications or suggestions are welcome.
