Warpath Structure + Liquidity ToolWarpath visually organizes the key elements required to trade Gold professionally:
1. Market Structure Clarity
Automatically labels HH / HL / LH / LL on major pivot points (current chart timeframe)
Makes directional bias immediately obvious
Helps prevent counter-trend trading in strong expansions
2. Liquidity Sweep Detection (Wick-Only)
Highlights true liquidity sweeps using wick behavior (no breakout guessing)
Marks the sweep wick with user-defined colors
Draws a swept-zone box that extends forward to show where liquidity was taken
Designed to identify fuel vs reversal behavior in trends
3. Key Session Levels
Automatically plots:
Asian High / Low
London High / Low
New York High / Low
Previous Day High / Low
Includes Equal Highs / Equal Lows from:
current timeframe
higher timeframes (1H / 4H / Daily)
These levels represent where price is likely to react, not where trades should be forced.
4. HTF Bias Dashboard (Minimal & Clean)
Small dashboard in the corner showing:
15M bias
1H bias
4H bias
Daily bias
Keeps higher-timeframe alignment visible without clutter
5. Premium / Discount & Market State Awareness
Uses previous session equilibrium (50%) with a neutral buffer
Helps frame:
premium vs discount
neutral vs expansion environments
Designed for context, not entry signals
6. Continuation Reload Awareness (Strong Trend Environments)
Built to handle markets that:
remain overbought
stay in premium
sweep buy-side liquidity repeatedly
Supports compression → expansion continuation behavior
Prevents missed participation during multi-day trends without abandoning discipline
Analiza fundamentalna

FVG + Inversion + MidlineThis is a rough version. Still in works.
Off Mode - Shows bullish and bearish FVGS
Only Mode - Only shows inverted FVGs in white (those above price are usually resistance zones and below tend to be support with the more recent and higher timeframe ones being most relevant)
Blended - Shows Both
You can adjust the amount of zones to be shown to modify the lookback period.
You can also adjust the price range by a standard deviation of 100% to only cover a specific price range.
Rest of the features are still being cleaned or irrelevant for the most part.

Peter Lynch Value (Dynamic Growth)This indicator implements Peter Lynch's core valuation principle: Fair Price = Earnings Per Share (EPS) * Growth Rate.
It provides a dynamic "fair value" line overlaid on the price chart, allowing traders and investors to quickly assess whether a stock's current price is trading above or below its intrinsic value according to the Lynch method.
Key Features
1. Dynamic Growth Rate Calculation
The indicator uses a custom algorithm to calculate the critical EPS Growth Rate, making it robust against missing data from standard financial fields.
Methodology: It fetches historical TTM Diluted EPS reports (EARNINGS_PER_SHARE_DILUTED, TTM) and calculates the Year-over-Year (YoY) Growth Percentage from the current TTM value versus the TTM value 4 periods prior.
Reliability: This custom calculation ensures the value line appears even when TradingView's pre-calculated growth metrics are unavailable (na).
2. Multiplier Control
P/E Cap: You can enforce a maximum P/E multiplier (maxPE, default 25), preventing the fair value from becoming unrealistically high for extremely fast-growing companies (as Lynch suggested).
Fallback P/E: If insufficient financial history is available to calculate the growth rate, the indicator automatically switches to a user-defined fallbackPE (default 15) and highlights the line in orange as a warning.
3. Smoothing (Optional)
To reduce the volatility often seen in valuation metrics, you can apply an optional Simple Moving Average (SMA) to the Fair Value line. This helps visualize the underlying trend of intrinsic value.
4. Forward Estimate (Optional)
Display an optional projection (circles) based on the analysts' next Fiscal Year EPS Estimate (EARNINGS_ESTIMATE, FY). This shows the potential fair value if the company meets future expectations.
5. Diagnostic Table
A table in the corner provides transparency on the calculation:
Green/Red: Confirms if TTM EPS and Calculated Growth are found.
Final P/E Used: Shows the exact multiplier used (calculated growth or the manual fallback).
Disclaimer: This tool is for informational and educational purposes only and should not be considered financial advice.

PEAD ScreenerPEAD Screener - Post-Earnings Announcement Drift Scanner
═══════════════════════════════════════════════════════════════
WHY EARNINGS ANNOUNCEMENTS CREATE OPPORTUNITY
═══════════════════════════════════════════════════════════════
The days immediately following an earnings announcement are among the noisiest periods for any stock. Within hours, the market must digest new information about a company's profits, revenue, and future outlook. Analysts scramble to update their models. Institutions rebalance positions. Retail traders react to headlines.
This chaos creates a well-documented phenomenon called Post-Earnings Announcement Drift (PEAD): stocks that beat expectations tend to keep rising, while those that miss tend to keep falling - often for weeks after the initial announcement. Academic research has confirmed this pattern persists across decades and markets.
But not every earnings surprise is equal. A company that beats estimates by 5 cents might move very differently than one that beats by 5 cents with unusually high volume, or one where both earnings AND revenue exceeded expectations. Raw numbers alone don't tell the full story.
═══════════════════════════════════════════════════════════════
HOW "STANDARDIZED UNEXPECTED" METRICS CUT THROUGH THE NOISE
═══════════════════════════════════════════════════════════════
This screener uses a statistical technique to measure how "surprising" a result truly is - not just whether it beat or missed, but how unusual that beat or miss was compared to the company's own history.
The core idea: convert raw surprises into Z-scores.
A Z-score answers the question: "How many standard deviations away from normal is this result?"
- A Z-score of 0 means the result was exactly average
- A Z-score of +2 means the result was unusually high (better than ~95% of historical results)
- A Z-score of -2 means the result was unusually low
By standardizing surprises this way, we can compare apples to apples. A small-cap biotech's $0.02 beat might actually be more significant than a mega-cap's $0.50 beat, once we account for each company's typical variability.
This screener applies this standardization to three dimensions: earnings (SUE), revenue (SURGE), and volume (SUV).
═══════════════════════════════════════════════════════════════
THE 9 SCREENING CRITERIA
═══════════════════════════════════════════════════════════════
─────────────────────────────────────────
1. SUE (Standardized Unexpected Earnings)
─────────────────────────────────────────
WHAT IT IS:
SUE measures how surprising an earnings result was, adjusted for the company's historical forecast accuracy.
Calculation: Take the earnings surprise (actual EPS minus analyst estimate), then divide by the standard deviation of past forecast errors. This uses a rolling window of the last 8 quarters by default.
Formula: SUE = (Actual EPS - Estimated EPS) / Standard Deviation of Past Errors
HOW TO INTERPRET:
- SUE > +2.0: Strongly positive surprise - earnings beat expectations by an unusually large margin. These stocks often continue drifting higher.
- SUE between 0 and +2.0: Modest positive surprise - beat expectations, but within normal range.
- SUE between -2.0 and 0: Modest negative surprise - missed expectations, but within normal range.
- SUE < -2.0: Strongly negative surprise - significant miss. These stocks often continue drifting lower.
For long positions, look for SUE values above +2.0, ideally combined with positive SURGE.
─────────────────────────────────────────
2. SURGE (Standardized Unexpected Revenue)
─────────────────────────────────────────
WHAT IT IS:
SURGE applies the same standardization technique to revenue surprises. While earnings can be manipulated through accounting choices, revenue is harder to fake - it represents actual sales.
Calculation: Take the revenue surprise (actual revenue minus analyst estimate), then divide by the standard deviation of past revenue forecast errors.
Formula: SURGE = (Actual Revenue - Estimated Revenue) / Standard Deviation of Past Errors
HOW TO INTERPRET:
- SURGE > +1.5: Strongly positive revenue surprise - the company sold significantly more than expected.
- SURGE between 0 and +1.5: Modest positive surprise.
- SURGE < 0: Revenue missed expectations.
The most powerful signals occur when BOTH SUE and SURGE are positive and elevated (ideally SUE > 2.0 AND SURGE > 1.5). This indicates the company beat on both profitability AND top-line growth - a much stronger signal than either alone.
When SUE and SURGE diverge significantly (e.g., high SUE but negative SURGE), treat with caution - the earnings beat may have come from cost-cutting rather than genuine growth.
─────────────────────────────────────────
3. SUV (Standardized Unexpected Volume)
─────────────────────────────────────────
WHAT IT IS:
SUV detects unusual trading volume after accounting for how volatile the stock is. More volatile stocks naturally have higher volume, so raw volume comparisons can be misleading.
Calculation: This uses regression analysis to model the expected relationship between price volatility and volume. The "unexpected" volume is the residual - how much actual volume deviated from what the model predicted. This residual is then standardized into a Z-score.
In plain terms: SUV asks "Given how much this stock typically moves, is today's volume unusually high or low?"
HOW TO INTERPRET:
- SUV > +2.0: Exceptionally high volume relative to the stock's volatility. This often signals institutional activity - big players moving in or out.
- SUV between +1.0 and +2.0: Elevated volume - above normal interest.
- SUV between -1.0 and +1.0: Normal volume range.
- SUV < -1.0: Unusually quiet - less activity than expected.
High SUV combined with positive price movement suggests accumulation (buying). High SUV combined with negative price movement suggests distribution (selling).
─────────────────────────────────────────
4. % From D0 Close
─────────────────────────────────────────
WHAT IT IS:
This measures how far the current price has moved from the closing price on its initial earnings reaction day (D0). The "reaction day" is the first trading day that fully reflects the earnings news - typically the day after an after-hours announcement, or the announcement day itself for pre-market releases.
Calculation: ((Current Price - D0 Close) / D0 Close) × 100
HOW TO INTERPRET:
- Positive values: Stock has gained ground since earnings. The higher the percentage, the stronger the post-earnings drift.
- 0% to +5%: Modest positive drift - earnings were received well but momentum is limited.
- +5% to +15%: Strong drift - buyers continue accumulating.
- > +15%: Exceptional drift - significant institutional interest likely.
- Negative values: Stock has given back gains or extended losses since earnings. May indicate the initial reaction was overdone, or that sentiment is deteriorating.
This metric is most meaningful within the first 5-20 trading days after earnings. Extended drift (maintaining gains over 2+ weeks) is a stronger signal than a quick spike that fades.
─────────────────────────────────────────
5. # Pocket Pivots
─────────────────────────────────────────
WHAT IT IS:
Pocket Pivots are a volume-based pattern developed by Chris Kacher and Gil Morales. They identify days where institutional buyers are likely accumulating shares without causing obvious breakouts.
Calculation: A Pocket Pivot occurs when:
- The stock closes higher than it opened (up day)
- The stock closes higher than the previous day's close
- Today's volume exceeds the highest down-day volume of the prior 10 trading sessions
The screener counts how many Pocket Pivots have occurred since the earnings announcement.
HOW TO INTERPRET:
- 0 Pocket Pivots: No detected institutional accumulation patterns since earnings.
- 1-2 Pocket Pivots: Some institutional buying interest - worth monitoring.
- 3+ Pocket Pivots: Strong accumulation signal - institutions appear to be building positions.
Pocket Pivots are most significant when they occur:
- Immediately following earnings announcements
- Near moving average support (10-day, 21-day, or 50-day)
- On above-average volume
- After a period of price consolidation
Multiple Pocket Pivots in a short period suggest sustained institutional demand, not just a one-day event.
─────────────────────────────────────────
6. ADX/DI (Trend Strength and Direction)
─────────────────────────────────────────
WHAT IT IS:
ADX (Average Directional Index) measures trend strength regardless of direction. DI (Directional Indicator) shows whether the trend is bullish or bearish.
Calculation: ADX uses a 14-period lookback to measure how directional (trending) price movement is. Values range from 0 to 100. The +DI and -DI components compare upward and downward movement.
The screener shows:
- ADX value (trend strength)
- Direction indicator: "+" for bullish (price trending up), "-" for bearish (price trending down)
HOW TO INTERPRET:
- ADX < 20: Weak trend - the stock is moving sideways, choppy. Not ideal for momentum trading.
- ADX 20-25: Trend is emerging - potentially starting a directional move.
- ADX 25-40: Strong trend - clear directional movement. Good for momentum plays.
- ADX > 40: Very strong trend - powerful move in progress, but may be extended.
The direction indicator (+/-) tells you which way:
- "25+" means ADX of 25 with bullish direction (uptrend)
- "25-" means ADX of 25 with bearish direction (downtrend)
For post-earnings plays, ideal setups show ADX rising above 25 with positive direction, confirming the earnings reaction is developing into a sustained trend rather than a one-day spike.
─────────────────────────────────────────
7. Institutional Buying PASS
─────────────────────────────────────────
WHAT IT IS:
This proprietary composite indicator detects patterns consistent with institutional accumulation at three stages after earnings:
EARLY (Days 0-4): Looks for "large block" buying on the earnings reaction day (exceptionally high volume with a close in the upper half of the day's range) combined with follow-through buying on the next day.
MID (Days 5-9): Checks for sustained elevated volume (averaging 1.5x the 20-day average) combined with positive drift and consistent upward price movement (more up days than down days).
LATE (Days 10+): Detects either visible accumulation (positive drift with high volume) OR stealth accumulation (positive drift with unusually LOW volume - suggesting smart money is quietly building positions without attracting attention).
HOW TO INTERPRET:
- Check mark/value of '1': Institutional buying pattern detected. The stock shows characteristics consistent with large players accumulating shares.
- X mark/value of '0': No institutional buying pattern detected. This doesn't mean institutions aren't buying - just that the typical footprints aren't visible.
A passing grade here adds conviction to other bullish signals. Institutions have research teams, information advantages, and long time horizons. When their footprints appear in the data, it often precedes sustained moves.
Important: This is a pattern detection tool, not a guarantee. Always combine with other analysis.
─────────────────────────────────────────
8. Strong ATR Drift PASS
─────────────────────────────────────────
WHAT IT IS:
This measures whether the stock has drifted significantly relative to its own volatility. Instead of asking "did it move 10%?", it asks "did it move more than 1.5 ATRs?"
ATR (Average True Range) measures a stock's typical daily movement. A volatile stock might move 5% daily, while a stable stock might move 0.5%. Using ATR normalizes for this difference.
Calculation:
ATR Drift = (Current Close - D0 Close) / D0 ATR in dollars
The indicator passes when ATR Drift exceeds 1.5 AND at least 5 days have passed since earnings.
HOW TO INTERPRET:
- Check mark/value of '1': The stock has drifted more than 1.5 times its average daily range since earnings - a statistically significant move that suggests genuine momentum, not just noise.
- X mark/value of '0': The drift (if any) is within normal volatility bounds - could just be random fluctuation.
Why wait 5 days? The immediate post-earnings reaction (days 0-2) often includes gap fills and noise. By day 5, if the stock is still extended beyond 1.5 ATRs from the earnings close, it suggests real buying pressure, not just a reflexive gap.
A passing grade here helps filter out stocks that "beat earnings" but haven't actually moved meaningfully. It focuses attention on stocks where the market is voting with real capital.
─────────────────────────────────────────
9. Days Since D0
─────────────────────────────────────────
WHAT IT IS:
Simply counts the number of trading days since the earnings reaction day (D0).
HOW TO INTERPRET:
- Days 0-5 (Green): Fresh earnings - the information is new, institutional repositioning is active, and momentum trades are most potent. This is the "sweet spot" for PEAD strategies.
- Days 6-10 (Neutral): Mid-period - some edge remains but diminishing. Good for adding to winning positions, less ideal for new entries.
- Days 11+ (Red): Extended period - most of the post-earnings drift has typically played out. Higher risk that momentum fades or reverses.
Research shows PEAD effects are strongest in the first 5-10 days after earnings, then decay. Beyond 20-30 days, the informational advantage of the earnings surprise is largely priced in.
Use this to prioritize: focus on stocks with strong signals that are still in the early window, and be more selective about entries as days accumulate.
═══════════════════════════════════════════════════════════════
PUTTING IT ALL TOGETHER
═══════════════════════════════════════════════════════════════
You can use this screener in the chart view or in the Screener.
One combination of the above filters to develop a shortlist of positive drift candidates may be:
- SUE > 2.0 (significant earnings beat)
- SURGE > 1.5 (significant revenue beat)
- Positive % From D0 Close (price confirming the good news)
- Institutional Buying PASS (big players accumulating)
- Strong ATR Drift PASS (statistically significant movement)
- Days Since D0 < 10 (still in the active drift window)
No single indicator is sufficient. The power comes from convergence - when multiple independent measures all point the same direction.
═══════════════════════════════════════════════════════════════
SETTINGS
═══════════════════════════════════════════════════════════════
Key adjustable parameters:
- SUE Method: "Analyst-based" uses consensus estimates; "Time-series" uses year-over-year comparison
- Window Size: Number of quarters used for standardization (default: 8)
- ATR Drift Threshold: Minimum ATR multiple for "strong" classification (default: 1.5)
- Institutional Buying thresholds: Adjustable volume and CLV parameters
═══════════════════════════════════════════════════════════════
DISCLAIMER
═══════════════════════════════════════════════════════════════
This screener is a research tool, not financial advice. Past patterns do not guarantee future results. Always conduct your own due diligence and manage risk appropriately. Post-earnings trading involves significant uncertainty and volatility. The 'SUE' in this indicator does not represent a real person; any similarity to actual Sue's (or Susans for that matter) living or dead is quite frankly ridiculous, not to mention coincidental.

Seasonality Calculator Custom Date Range AnalysisThe Seasonality Calculator lets you manually test any seasonal window by choosing a start day/month and end day/month, and then evaluating how that exact period performed historically.
For the selected date range, the script looks back over past years and calculates:
Average return
Hit rate (win rate)
Winning years vs. total years
The results are displayed in a compact on-chart table showing:
Entry date & exit date (calendar days)
Pattern length
Average return & hit rate
Win/trade count
Optionally, the indicator can also draw highlighted boxes for each year of the chosen seasonal window, so you can visually inspect how that specific date range behaved in the past.
You can:
Choose the exact start and end dates (day & month),
Set how many years of history to include,
And filter by simple regimes such as US election cycle years.
All calculations are based on daily data, and the math is consistent with the Seasonality Screener: if you take a pattern from the Screener and enter the same dates into this Calculator, you will get the same historical statistics.
Use this tool to experiment with custom seasonal ideas and to fine-tune windows you discover with the Screener, always in combination with your own analysis and risk management.

Pops Dividend 7-Day RadarHow traders use it as a strategy anyway 🧠
In real life, this becomes a manual or semi-systematic strategy:
Strategy logic (human-driven):
Scan for highest yield stocks
Filter for ex-date within 7 days
Apply technical rules (trend, EMAs, support)
Enter before ex-date
Exit:
Before ex-date (momentum run-up)
On ex-date
Or after dividend (reversion play)
Indicator’s role:
“Tell me when a stock qualifies so I can decide how to trade it.”
That’s exactly what this tool does.
How we could turn this into a strategy-style framework
Even though Pine won’t let us backtest dividends properly, we can:
Build a rules-based checklist (entry/exit rules)
Create alerts that behave like strategy triggers
Combine with:
EMA trend filters
Volume conditions
ATR-based exits
Label it as:
“Pops Dividend Capture Playbook” (manual execution)
This keeps it honest, legal, and reliable.
Bottom line
🧩 Indicator = what we built
📘 Strategy = how you trade it using the indicator
⚠️ TradingView limitations prevent a true dividend strategy backtest

Seasonality Screener Best Long & Short Patterns Auto-ScanThe Seasonality Screener automatically scans a market’s history to find the most profitable seasonal patterns in the days ahead.
It searches for both long and short setups and shows you the two best patterns based on historical performance.
For each pattern, the screener looks back over past years and calculates:
Average return
Hit rate (win rate)
Winning years vs. total years
The results are displayed in a compact on-chart table with:
Entry date & exit date (calendar days)
Pattern length
Average return & hit rate
Win/trade count
Optionally, the indicator can also draw highlighted boxes in the chart’s history for the selected long and/or short pattern, so you can visually inspect how the seasonal window performed in each year.
You can:
Define how far ahead the screener should look (e.g. next X days),
Control the minimum and maximum pattern length,
Choose how many years of history to use,
And filter by simple regimes such as US election cycle years.
Internally, all calculations are based on daily data, so the seasonal analysis has to be done on the daily timeframe.
This tool is designed as a research and idea generator for seasonal tendencies and should be used together with your own risk management and trading plan.

Neosha Concept V4 (NY Time)
Imagine the financial market as a huge ocean. Millions of traders throw orders into it every second. But beneath all the noise, there is a powerful current that quietly controls where the waves move. That current is not a person, not a trader, and not random—it is an algorithm.
This algorithm is called the Interbank Price Delivery Algorithm (IPDA).
Think of it as the “navigation system” that guides price through the market.
IPDA has one job:
to move prices in a way that keeps the market efficient and liquid.
To do this, it constantly looks for two things:
1. Where liquidity is hiding
Liquidity is usually found above highs and below lows—where traders place stop losses. The algorithm moves price there first to collect that liquidity.
2. Where price became unbalanced
Sometimes price moves too fast and creates gaps or imbalances. IPDA returns to those areas later to “fix” the missing orders.
Once you start looking at the charts with this idea in mind, everything makes more sense:
Why price suddenly spikes above a high and crashes down
Why big moves leave gaps that price later fills
Why the market reverses right after taking stops
Why trends begin only after certain levels are hit
These are not accidents.
They are the algorithm doing its job.
Price moves in a repeating cycle:
Gather liquidity
Make a strong move (displacement)
Return to fix inefficiency
Deliver to the next target
Most beginners only see the candles.
But once you understand IPDA, you see the intention behind the candles.
Instead of guessing where price might go, you begin to understand why it moves there.
And once you understand the “why,” your trading becomes clearer, calmer, and far more accurate.

CRUX-3 Macro Regime Index"CRUX-3 Macro Regime Index"
Description:
CRUX-3 Macro Regime Index is a higher-timeframe macro indicator designed to evaluate how crypto markets are performing relative to traditional equities. It compares Bitcoin, Ethereum, and the broader altcoin market (TOTAL3) against the S&P 500 using Z-score normalization to highlight periods of relative outperformance or underperformance.
The indicator incorporates liquidity-based regime detection using Bitcoin dominance and stablecoin dominance to classify market environments as Risk-On, BTC-Led, or Risk-Off. Background shading visually highlights these regimes, helping users identify broader macro conditions rather than short-term trade signals.
CRUX-3 is intended for macro context, regime awareness, and allocation bias decisions, not for precise trade entries or timing.
How to Use:
Weekly timeframe recommended for best results
Rising Z-scores indicate crypto outperforming equities
ETH/SPX typically acts as an early rotation signal
TOTAL3/SPX confirms broader altcoin participation
Regime shading reflects liquidity conditions, not price forecasts
Regime Definitions:
Risk-On: BTC dominance and stablecoin dominance declining
BTC-Led: BTC dominance strong while stablecoin dominance eases
Risk-Off: BTC dominance and stablecoin dominance rising
Notes:
Forward regime bands are statistical reference guides based on historical behavior
This indicator does not predict future prices or market direction
Best used alongside price charts and other macro tools
Disclaimer:
This indicator is for educational and informational purposes only. It does not constitute financial advice, investment advice, or trading recommendations.
Recommended Settings:
Timeframe: Weekly (1W)
Z-Score Lookback: 52
Forward Regime Bands: Enabled

8.2 PRO @Mavrick8.2 PRO @Mavrick is a professional-grade predictive momentum indicator designed for traders who want early, high-confidence entries.
It intelligently combines trend structure, volume behavior, RSI, MACD, and price velocity to anticipate market moves before they fully develop. The indicator features auto-adaptive targets for BTC, ETH, SOL, and altcoins, advanced fake pump/dump detection, and an early momentum warning system to stay ahead of reversals.
A clean smart signal table displays real-time market strength, confidence levels, and actionable BUY/SELL readiness.
Best performance in strong trends and high-volume environments.

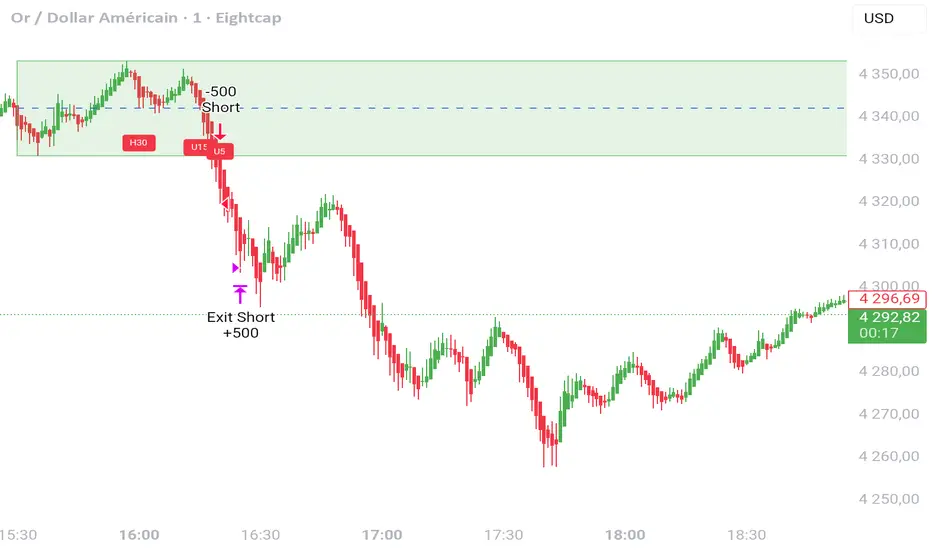
30min First Candle + Fibo50 + Sequential Multi-TF Break StrategyPrice action basée sur ouverture marché US a partir de la 1ere bougie
Réinitialisation chaque jour
Price action based on US market opening from 1st candle
Reset every day.

30min First Candle + Fibo50 + Sequential Multi-TF Break StrategyPrice action basée sur ouverture marché US avec Réinitialisation chaque jour
Daily Auto-Fib Zones (Custom Colors)This indicator automatically draws daily Fibonacci-based zones using the current session’s high and low. The levels update dynamically as new price action forms and include optional visual regions for several commonly referenced retracement percentages.
Features include:
• Automatic detection of the daily high and low
• Real-time updates throughout the session
• Optional zones for 0.11–0.17, 0.5, and 0.618–0.786 levels
• Custom color inputs for every line and zone
• Dynamic boxes that expand with the day’s range
• Lightweight visual layout with toggleable components
The tool is intended purely for chart visualization. It does not provide signals or trade recommendations.

Weekly Auto-Fib Zones (Custom Colors) This script automatically plots weekly Fibonacci-based zones using the current week’s high and low. It updates dynamically as new price action forms and provides optional visual regions for key retracement areas.
The indicator includes:
• Weekly high/low anchor lines
• Optional 0.11–0.17 zones
• Optional 0.5 midpoint (premium/discount)
• Optional 0.618–0.786 retracement band
• Customizable colors for each level
• Dynamic boxes that expand as the week progresses
It is designed as a visual aid for identifying weekly ranges, contextual zones, and potential areas of interest based solely on Fibonacci percentages. No signals, alerts, or trading recommendations are included.


Stochastic RSI with CrossesThis is the same Indicator on tradingview I just added a trigger for crosses for clarity. It has alerts and now you can clearly see who the STOCH/ RSI crosses.

Macroeconomic Dashboard by DGTMacroeconomic Dashboard is a script tailored for traders and investors using top-down strategies to navigate global markets. It integrates key macroeconomic indicators, such as monetary policy, inflation, yields, and market sentiment, directly into financial charts.
By visualizing real-time macro data alongside asset price movements, this tool bridges the gap between traditional economic metrics and technical analysis. Whether analyzing crypto or traditional markets, users can better contextualize price action within broader economic cycles and trends.
Designed to support macro-informed decision-making, it helps identify shifts in liquidity, policy direction, and risk appetite, enhancing strategic trade entries and portfolio positioning.
KEY FEATURES
⯌ Macro Dashboard
The script provides a macro dashboard that tracks changes across key economic dimensions: monetary policy, inflation and growth, bond markets, and risk indicators. With built-in anomaly detection and trend analysis across short-, mid-, and long-term timeframes, it helps interpret market moves through a macroeconomic lens, whether analyzing equities, commodities, or digital assets.
⯌ Macro on Chart
By visualizing macro data such as M2 money supply, CPI, treasury yields, and volatility indices, users can more easily correlate economic developments with price action, enhancing situational awareness and decision-making.
MACRO METRICS
The script covers five core macroeconomic domains, each with key metrics:
Liquidity & Monetary Policy
Global M2 Money Supply
Federal Funds Rate
Reverse Repo Operations
Inflation & Economic Growth
Consumer Price Index (CPI)
Producer Price Index (PPI)
Real GDP Growth
Yields & Bond Markets
10-Year Treasury Yield
2-Year Treasury Yield
Yield Curve (10Y–2Y Spread)
Global Risk & Currency Indicators
U.S. Dollar Index (DXY)
Volatility Index (VIX)
Economic Policy Uncertainty Index
Equities, Commodities & Crypto
S&P 500 (SPX)
Nasdaq 100 (NDX)
Gold (XAU/USD)
Crude Oil (WTI)
Bitcoin (BTCUSD)
DISCLAIMER
This script is intended for informational and educational purposes only. It does not constitute financial, investment, or trading advice. All trading decisions made based on its output are solely the responsibility of the user.
Płatny skrypt

(SM3) Volume Profile Tool-kitCore Concept
This indicator is a right-aligned fixed-range Volume Profile + SMT-style tools:
Volume Profile
Shows volume distribution over a fixed lookback window
Bars are colored by volume delta:
Teal = buyers (bullish volume ≥ bearish volume)
Fuchsia = sellers (bearish volume > bullish volume)
POC: highest volume price level
Value Area: price region containing X% of total volume (default 68%)
Liquidity Sweeps
Marks Buy-side Liquidity Sweeps (BSL) and Sell-side Liquidity Sweeps (SSL) based on pivot highs/lows
PDH/PDL Liquidity Boxes
Previous Day High (PDH) zone = red box
Previous Day Low (PDL) zone = green box
Based on the prior full calendar day’s high/low
Boxes extend across the current day only, adjusting bar by barCore Concept
This indicator is a right-aligned fixed-range Volume Profile + SMT-style tools:
Volume Profile
Shows volume distribution over a fixed lookback window
Bars are colored by volume delta:
Teal = buyers (bullish volume ≥ bearish volume)
Fuchsia = sellers (bearish volume > bullish volume)
POC: highest volume price level
Value Area: price region containing X% of total volume (default 68%)
Liquidity Sweeps
Marks Buy-side Liquidity Sweeps (BSL) and Sell-side Liquidity Sweeps (SSL) based on pivot highs/lows
PDH/PDL Liquidity Boxes
Previous Day High (PDH) zone = red box
Previous Day Low (PDL) zone = green box
Based on the prior full calendar day’s high/low
Boxes extend across the current day only, adjusting bar by bar

(SM3) Volume Profile Tool-kit1st pine script. It is a work in progress. I use this to mark previous day high and low value areas as well as overnight volume profile for NYSE open strategy.

Punjis Dynamic Daily EMA/SMA 5,9,21,50,100 LevelsPunjis Dynamic Daily EMA/SMA 5,9,21,50,100 Levels
Overview:
This indicator displays daily timeframe moving averages as horizontal lines extending to the right of your chart, regardless of what timeframe you're currently viewing. It includes six key moving averages: EMA 5, EMA 9, EMA 21, SMA 50, SMA 100, and SMA 200.
Key Features:
Clean Chart Design: Unlike traditional moving average lines that clutter your chart with curves across all candles, this indicator uses horizontal lines that extend only from the current price level to the right edge of your screen
Multi-Timeframe Analysis: View daily moving averages on any intraday timeframe (1min, 5min, 15min, etc.) without switching charts
Fully Customizable:
Toggle each moving average on/off independently
Adjust the period length for each MA
Customize colors for each line
Master toggle to show/hide all lines at once
Reduced Visual Noise: Horizontal lines keep your price action clean and easy to read while still providing critical support/resistance levels
Professional Layout: Perfect for traders who need to monitor multiple key levels without obscuring candlestick patterns and chart analysis
Benefits of Horizontal Lines:
Cleaner Charts: Traditional MAs draw lines through every candle, creating visual clutter. Horizontal lines only show current values, keeping your chart clean
Focus on Current Levels: What matters most is where the MAs are NOW relative to price - horizontal lines highlight this instantly
Better Price Action Visibility: See candlestick patterns, volume, and support/resistance levels clearly without MA lines crossing through them
Quick Reference: Instantly identify if price is above or below key moving averages without following curved lines across the chart
Professional Appearance: Clean, minimalist design preferred by institutional traders and technical analysts
Use Cases:
Day traders monitoring higher timeframe levels on intraday charts
Swing traders tracking daily moving averages as dynamic support/resistance
Multi-timeframe analysis without chart switching
Identifying trend direction and potential reversal zones
Clean workspace for pattern recognition and price action trading


Open Interest Z-Score [BackQuant]Open Interest Z-Score
A standardized pressure gauge for futures positioning that turns multi venue open interest into a Z score, so you can see how extreme current positioning is relative to its own history and where leverage is stretched, decompressing, or quietly re loading.
What this is
This indicator builds a single synthetic open interest series by aggregating futures OI across major derivatives venues, then standardises that aggregated OI into a rolling Z score. Instead of looking at raw OI or a simple change, you get a normalized signal that says "how many standard deviations away from normal is positioning right now", with optional smoothing, reference bands, and divergence detection against price.
You can render the Z score in several plotting modes:
Line for a clean, classic oscillator.
Colored line that encodes both sign and momentum of OI Z.
Oscillator histogram that makes impulses and compressions obvious.
The script also includes:
Aggregated open interest across Binance, Bybit, OKX, Bitget, Kraken, HTX, and Deribit, using multiple contract suffixes where applicable.
Choice of OI units, either coin based or converted to USD notional.
Standard deviation reference lines and adaptive extreme bands.
A flexible smoothing layer with multiple moving average types.
Automatic detection of regular and hidden divergences between price and OI Z.
Alerts for zero line and ±2 sigma crosses.
Aggregated open interest source
At the core is the same multi venue OI aggregation engine as in the OI RSI tool, adapted from NoveltyTrade's work and extended for this use case. The indicator:
Anchors on the current chart symbol and its base currency.
Loops over a set of exchanges, gated by user toggles:
Binance.
Bybit.
OKX.
Bitget.
Kraken.
HTX.
Deribit.
For each exchange, loops over several contract suffixes such as USDT.P, USD.P, USDC.P, USD.PM to cover the common perp and margin styles.
Requests OI candles for each exchange plus suffix pair into a small custom OI type that carries open, high, low and close of open interest.
Converts each OI stream into a common unit via the sw method:
In COIN mode, OI is normalized relative to the coin.
In USD mode, OI is scaled by price to approximate notional.
Exchange specific scaling factors are applied where needed to match contract multipliers.
Accumulates all valid OI candles into a single combined OI "candle" by summing open, high, low and close across venues.
The result is oiClose , a synthetic close for aggregated OI that represents cross venue positioning. If there is no valid OI data for the symbol after this process, the script throws a clear runtime error so you know the market is unsupported rather than quietly plotting nonsense.
How the Z score is computed
Once the aggregated OI close is available, the indicator computes a rolling Z score over a configurable lookback:
Define subject as the aggregated OI close.
Compute a rolling mean of this subject with EMA over Z Score Lookback Period .
Compute a rolling standard deviation over the same length.
Subtract the mean from the current OI and divide by the standard deviation.
This gives a raw Z score:
oi_z_raw = (subject − mean) ÷ stdDev .
Instead of plotting this raw value directly, the script passes it through a smoothing layer:
You pick a Smoothing Type and Smoothing Period .
Choices include SMA, HMA, EMA, WMA, DEMA, RMA, linear regression, ALMA, TEMA, and T3.
The helper ma function applies the chosen smoother to the raw Z score.
The result is oi_z , a smoothed Z score of aggregated open interest. A separate EMA with EMA Period is then applied on oi_z to create a signal line ma that can be used for crossovers and trend reads.
Plotting modes
The Plotting Type input controls how this Z score is rendered:
1) Line
In line mode:
The smoothed OI Z score is plotted as a single line using Base Line Color .
The EMA overlay is optionally plotted if Show EMA is enabled.
This is the cleanest view when you want to treat OI Z like a standard oscillator, watching for zero line crosses, swings, and divergences.
2) Colored Line
Colored line mode adds conditional color logic to the Z score:
If the Z score is above zero and rising, it is bright green, representing positive and strengthening positioning pressure.
If the Z score is above zero and falling, it shifts to a cooler cyan, representing positive but weakening pressure.
If the Z score is below zero and falling, it is bright red, representing negative and strengthening pressure (growing net de risking or shorting).
If the Z score is below zero and rising, it is dark red, representing negative but recovering pressure.
This mapping makes it easy to see not only whether OI is above or below its historical mean, but also whether that deviation is intensifying or fading.
3) Oscillator
Oscillator mode turns the Z score into a histogram:
The smoothed Z score is plotted as vertical columns around zero.
Column colors use the same conditional palette as colored line mode, based on sign and change direction.
The histogram base is zero, so bars extend up into positive Z and down into negative Z.
Oscillator mode is useful when you care about impulses in positioning, for example sharp jumps into positive Z that coincide with fast builds in leverage, or deep spikes into negative Z that show aggressive flushes.
4) None
If you only want reference lines, extreme bands, divergences, or alerts without the base oscillator, you can set plotting to None and keep the rest of the tooling active.
The EMA overlay respects plotting mode and only appears when a visible Z score line or histogram is present.
Reference lines and standard deviation levels
The Select Reference Lines input offers two styles:
Standard Deviation Levels
Plots small markers at zero.
Draws thin horizontal lines at +1, +2, −1 and −2 Z.
Acts like a classic Z score ladder, zero as mean, ±1 as normal band, ±2 as outer band.
This mode is ideal if you want a textbook statistical framing, using ±1 and ±2 sigma as standard levels for "normal" versus "extended" positioning.
Extreme Bands
Extreme bands build on the same ±1 and ±2 lines, then add:
Upper outer band between +3 and +4 Z.
Lower outer band between −3 and −4 Z.
Dynamic fill colors inside these bands:
If the Z score is positive, the upper band fill turns red with an alpha that scales with the magnitude of |Z|, capped at a chosen max strength. Stronger deviations towards +4 produce more opaque red fills.
If the Z score is negative, the lower band fill turns green with the same adaptive alpha logic, highlighting deep negative deviations.
Opposite side bands remain a faint neutral white when not in use, so they still provide structural context without shouting.
This creates a visual "danger zone" for position crowding. When the Z score enters these outer bands, open interest is many standard deviations away from its mean and you are dealing with rare but highly loaded positioning states.
Z score as a positioning pressure gauge
Because this is a Z score of aggregated open interest, it measures how unusual current positioning is relative to its own recent history, not just whether OI is rising or falling:
Z near zero means total OI is roughly in line with normal conditions for your lookback window.
Positive Z means OI is above its recent mean. The further above zero, the more "crowded" or extended positioning is.
Negative Z means OI is below its recent mean. Deep negatives often mark post flush environments where leverage has been cleared and the market is under positioned.
The smoothing options help control how much noise you want in the signal:
Short Z score lookback and short smoothing will react quickly, suited for short term traders watching intraday positioning shocks.
Longer Z score lookback with smoother MA types (EMA, RMA, T3) give a slower, more structural view of where the crowd sits over days to weeks.
Divergences between price and OI Z
The indicator includes automatic divergence detection on the Z score versus price, using pivot highs and lows:
You configure Pivot Lookback Left and Pivot Lookback Right to control swing sensitivity.
Pivots are detected on the OI Z series.
For each eligible pivot, the script compares OI Z and price at the last two pivots.
It looks for four patterns:
Regular Bullish – price makes a lower low, OI Z makes a higher low. This can indicate selling exhaustion in positioning even as price washes out. These are marked with a line and a label "ℝ" below the oscillator, in the bullish color.
Hidden Bullish – price makes a higher low, OI Z makes a lower low. This suggests continuation potential where price holds up while positioning resets. Marked with "ℍ" in the bullish color.
Regular Bearish – price makes a higher high, OI Z makes a lower high. This is a classic warning sign of trend exhaustion, where price pushes higher while OI Z fails to confirm. Marked with "ℝ" in the bearish color.
Hidden Bearish – price makes a lower high, OI Z makes a higher high. This is often seen in pullbacks within downtrends, where price retraces but positioning stretches again in the direction of the prevailing move. Marked with "ℍ" in the bearish color.
Each divergence type can be toggled globally via Show Detected Divergences . Internally, the script restricts how far back it will connect pivots, so you do not get stray signals linking very old structures to current bars.
Trading applications
Crowding and squeeze risk
Z scores are a natural way to talk about crowding:
High positive Z in aggregated OI means the market is running high leverage compared to its own norm. If price is also extended, the risk of a squeeze or sharp unwind rises.
Deep negative Z means leverage has been cleaned out. While it can be painful to sit through, this environment often sets up cleaner new trends, since there is less one sided positioning to unwind.
The extreme bands at ±3 to ±4 highlight the rare states where crowding is most intense. You can treat these events as regime markers rather than day to day noise.
Trend confirmation and fade selection
Combine Z score with price and trend:
Bull trends with positive and rising Z are supported by fresh leverage, usually more persistent.
Bull trends with flat or falling Z while price keeps grinding up can be more fragile. Divergences and extreme bands can help identify which edges you do not want to fade and which you might.
In downtrends, deep negative Z that stays pinned can mean persistent de risking. Once the Z score starts to mean revert back toward zero, it can mark the early stages of stabilization.
Event and liquidation context
Around major events, you often see:
Rapid spikes in Z as traders rush to position.
Reversal and overshoot as liquidations and forced de risking clear the book.
A move from positive extremes through zero into negative extremes as the market transitions from crowded to under exposed.
The Z score makes that path obvious, especially in oscillator mode, where you see a block of high positive bars before the crash, then a slab of deep negative bars after the flush.
Settings overview
Z Score group
Plotting Type – None, Line, Colored Line, Oscillator.
Z Score Lookback Period – window used for mean and standard deviation on aggregated OI.
Smoothing Type – SMA, HMA, EMA, WMA, DEMA, RMA, linear regression, ALMA, TEMA or T3.
Smoothing Period – length for the selected moving average on the raw Z score.
Moving Average group
Show EMA – toggle EMA overlay on Z score.
EMA Period – EMA length for the signal line.
EMA Color – color of the EMA line.
Thresholds and Reference Lines group
Select Reference Lines – None, Standard Deviation Levels, Extreme Bands.
Standard deviation lines at 0, ±1, ±2 appear in both modes.
Extreme bands add filled zones at ±3 to ±4 with adaptive opacity tied to |Z|.
Extra Plotting and UI
Base Line Color – default color for the simple line mode.
Line Width – thickness of the oscillator line.
Positive Color – positive or bullish condition color.
Negative Color – negative or bearish condition color.
Divergences group
Show Detected Divergences – master toggle for divergence plotting.
Pivot Lookback Left and Pivot Lookback Right – how many bars left and right to define a pivot, controlling divergence sensitivity.
Open Interest Source group
OI Units – COIN or USD.
Exchange toggles for Binance, Bybit, OKX, Bitget, Kraken, HTX, Deribit.
Internally, all enabled exchanges and contract suffixes are aggregated into one synthetic OI series.
Alerts included
The indicator defines alert conditions for several key events:
OI Z Score Positive – Z crosses above zero, aggregated OI moves from below mean to above mean.
OI Z Score Negative – Z crosses below zero, aggregated OI moves from above mean to below mean.
OI Z Score Enters +2σ – Z enters the +2 band and above, marking extended positive positioning.
OI Z Score Enters −2σ – Z enters the −2 band and below, marking extended negative positioning.
Tie these into your strategy to be notified when leverage moves from normal to extended states.
Notes
This indicator does not rely on price based oscillators. It is a statistical lens on cross venue open interest, which makes it a complementary tool rather than a replacement for your existing price or volume signals. Use it to:
Quantify how unusual current futures positioning is compared to recent history.
Identify crowded leverage phases that can fuel squeezes.
Spot structural divergences between price and positioning.
Frame risk and opportunity around events and regime shifts.
It is not a complete trading system. Combine it with your own entries, exits and risk rules to get the most out of what the Z score is telling you about positioning pressure under the hood of the market.

FOMC Federal Fund Rate Tracker [MHA Finverse]The FOMC Rate Tracker is a comprehensive indicator that visualizes Federal Reserve interest rate decisions and tracks market behavior during FOMC meeting periods. This tool helps traders analyze historical rate changes and anticipate market movements around Federal Open Market Committee announcements.
Key Features:
• Visual FOMC Periods - Automatically highlights each FOMC meeting period with colored boxes spanning from announcement to the next meeting
• Complete Rate Data - Displays actual rates, forecasts, previous rates, and rate differences for every meeting from 2021-2026
• Multiple Color Modes - Choose between cycle colors for visual distinction or rate difference colors (green for hikes, red for cuts, gray for holds)
• Smart Filtering - Filter periods by rate hikes only, cuts only, no change, or surprise moves to focus on specific market conditions
• Performance Metrics - Track average returns during rate hikes, cuts, and holds to identify historical patterns
• Volatility Analysis - Measure and compare price volatility across different FOMC periods
• Statistical Dashboard - View total hikes, cuts, holds, surprises, and longest hold streaks at a glance
• Built-in Alerts - Get notified 1 day before FOMC meetings, on meeting day, or when rates change
How It Works:
The indicator divides your chart into distinct periods between FOMC meetings, with each period showing a labeled box containing the meeting date, actual rate, forecast, previous rate, and rate difference. Future meetings are marked as "UPCOMING" to help you prepare for scheduled announcements.
Use Cases:
- Analyze how markets typically react to rate hikes vs. cuts
- Identify volatility patterns around FOMC announcements
- Backtest strategies based on monetary policy cycles
- Plan trades around upcoming Federal Reserve meetings
- Study the impact of surprise rate decisions on price action
Customization Options:
- Adjustable box transparency and outlines
- Customizable label sizes and colors
- Toggle individual dashboards on/off
- Filter specific types of rate decisions
- Configure alert preferences
This indicator is ideal for traders who incorporate fundamental analysis and monetary policy into their trading decisions. The historical data provides context for understanding market reactions to Federal Reserve actions.
