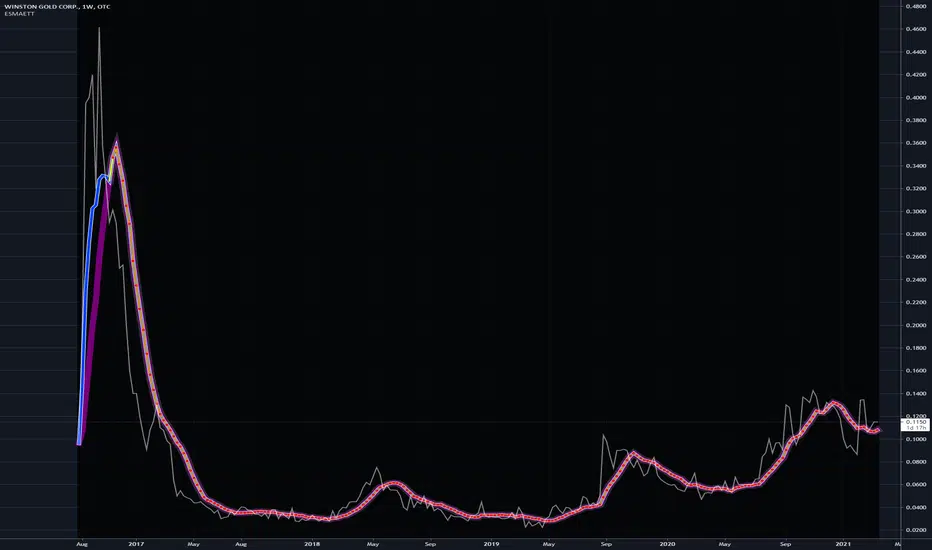
Ehlers Simple Window Indicator [CC]The Simple Window Indicator was created by John Ehlers (Stocks and Commodities Sep 2021) and this is the last of the 4 new indicators that he published in the latest issue of Stocks & Commodities. Since these are all part of a series, the idea behind each indicator is the exact same. The only difference is of course the calculation for each indicator. This script is different mostly because it is extremely noisy in comparison so I had to smooth it twice to provide clear buy and sell signals. Window functions are used in digital signal processing to filter out noise and the end result is an oscillator that centers around the 0 line. The easy way to understand these indicators that I will be publishing and those are that when they are above 0, it usually means an uptrend and below 0 then a downtrend. For more immediate signals, I have included both normal and strong buy and sell signals so darker colors for strong signals and lighter colors for normal signals. Buy when the line turns green and sell when it turns red.
Let me know if there are any other indicators you would like me to publish!
Filter

Ehlers Triangle Window Indicator [CC]The Triangle Window Indicator was created by John Ehlers (Stocks and Commodities Sep 2021) and this is one of 4 new indicators that he published in the latest issue of Stocks & Commodities and I will be publishing the last one tomorrow. Since these are all part of a series, the idea behind each indicator is the exact same. The only difference is of course the calculation for each indicator. Window functions are used in digital signal processing to filter out noise and the end result is an oscillator that centers around the 0 line. The easy way to understand these indicators that I will be publishing and those are that when they are above 0, it usually means an uptrend and below 0 then a downtrend. For more immediate signals, I have included both normal and strong buy and sell signals so darker colors for strong signals and lighter colors for normal signals. Buy when the line turns green and sell when it turns red.
Let me know if there are any other indicators you would like me to publish!

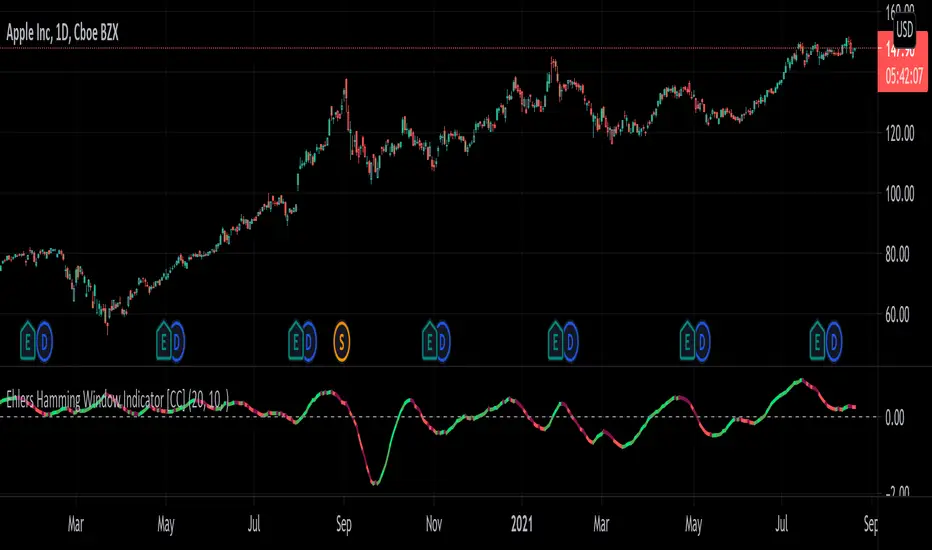
Ehlers Hamming Window Indicator [CC]The Hamming Window Indicator was created by John Ehlers (Stocks and Commodities Sep 2021) and this is one of 4 new indicators that he published in the latest issue of Stocks & Commodities and I will be publishing the other 2 in the next few days. Since these are all part of a series, the idea behind each indicator is the exact same. The only difference is of course the calculation for each indicator. Window functions are used in digital signal processing to filter out noise and the end result is an oscillator that centers around the 0 line. The easy way to understand these indicators that I will be publishing and those are that when they are above 0, it usually means an uptrend and below 0 then a downtrend. For more immediate signals, I have included both normal and strong buy and sell signals so darker colors for strong signals and lighter colors for normal signals. Buy when the line turns green and sell when it turns red.
Let me know if there are any other indicators you would like me to publish!
Ehlers Hann Window Indicator [CC]The Hann Window Indicator was created by John Ehlers (Stocks & Commodities Sep 2021) and this is one of 4 new indicators that he published in the latest issue of Stocks & Commodities and I will be publishing the other 3 in the next few days. Since these are all part of a series, the idea behind each indicator is the exact same. The only difference is of course the calculation for each indicator. Window functions are used in digital signal processing to filter out noise and the end result is an oscillator that centers around the 0 line. The easy way to understand these indicators that I will be publishing and those are that when they are above 0, it usually means an uptrend and below 0 then a downtrend. For more immediate signals, I have included both normal and strong buy and sell signals so darker colors for strong signals and lighter colors for normal signals. Buy when the line turns green and sell when it turns red.
Let me know if there are any other indicators you would like me to publish!

Ehlers Optimum Predictor [CC]The Optimum Predictor was created by John Ehlers (Rocket Science For Traders pgs 209-210) and this indicator does a pretty good job of predicting major market moves. When the blue line crosses over the red line then this indicator is predicting an upcoming uptrend and when the blue line crosses under the red line then it is predicting an upcoming downtrend. Ehlers recommends using this indicator with an entire trading system to filter out any bad signals but most of the signals it gives are pretty accurate. He uses advanced digital signal processing to predict the future prices and uses it in an ema formula for the calculation. There are several ways to interpret this indicator: you can look for crossovers, you can also look for when the indicator goes above 0 for a general uptrend or below 0 for a general downtrend.
Let me know if there are any other scripts you would like to see me publish!

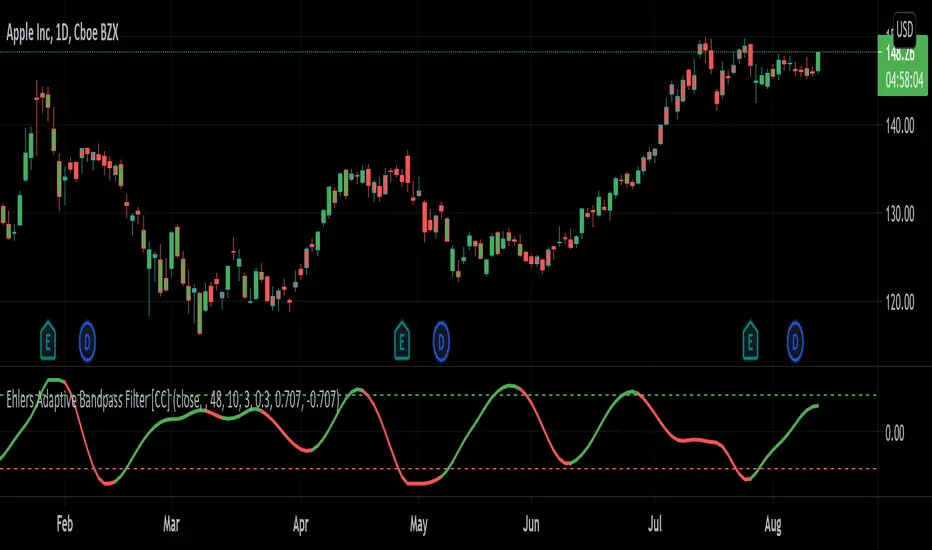
Ehlers Adaptive Bandpass Filter [CC]The Adaptive Bandpass Filter was created by John Ehlers (Cycle Analytics For Traders pgs 153-156) and this uses his autocorrelation code to provide the adaptive lengths to use for the underlying bandpass filter. The bandpass filter is a common way in digital signal processing to filter out the underlying noise in the data. It can actually be turned into a leading indicator by changing the bw variable to a smaller amount. Since this indicator is adaptive using the cycle period, the buy and sell signals are different compared to the normal bandpass filter. Buy signals for this indicator according to Ehlers are when the line is red and the line is under the oversold line (also red) then you buy when the indicator line turns green and then you exit when the indicator line turns red and is above the overbought line. This indicator doesn't provide clear buy and sell signals in all circumstances but generally speaking buy when the indicator line turns green and sell when it turns red. Feel free to experiment with this one.
Let me know if there are any other scripts you would like to see me publish!
Fast Fourier Transform (FFT) FilterDear friends!
I'm happy to present an implementation of the Fast Fourier Transform (FFT) algorithm. The script uses the FFT procedure to decompose the input time series into its cyclical constituents, in other words, its frequency components , and convert it back to the time domain with modified frequency content, that is, to filter it.
Input Description and Usage
Source and Length :
Indicates where the data comes from and the size of the lookback window used to build the dataset.
Standardize Input Dataset :
If enabled, the dataset is preprocessed by subtracting its mean and normalizing the result by the standard deviation, which is sometimes useful when analyzing seasonalities. This procedure is not recommended when using the FFT filter for smoothing (see below), as it will not preserve the average of the dataset.
Show Frequency-Domain Power Spectrum :
When enabled, the results of Fourier analysis (for the last price bar!) are plotted as a frequency-domain power spectrum , where “power” is a measure of the significance of the component in the dataset. In the spectrum, lower frequencies (longer cycles) are on the right, higher frequencies are on the left. The graph does not display the 0th component, which contains only information about the mean value. Frequency components that are allowed to pass through the filter (see below) are highlighted in magenta .
Dominant Cycles, Rows :
If this option is activated, the periods and relative powers of several dominant cyclical components that is, those that have a higher power, are listed in the table. The number of the component in the power spectrum (N) is shown in the first column. The number of rows in the table is defined by the user.
Show Inverse Fourier Transform (Filtered) :
When enabled, the reconstructed and filtered time-domain dataset (for the last price bar!) is displayed.
Apply FFT Filter in a Moving Window :
When enabled, the FFT filter with the same parameters is applied to each bar. The last data point of the reconstructed and filtered dataset is used to build a new time series. For example, by getting rid of high-frequency noise, the FFT filter can make the data smoother. By removing slowly evolving low-frequency components (including non-periodic constituents), one can reveal and analyze shorter cycles. Since filtering is done in real-time in a moving window (similar to the moving average), the modified data can potentially be used as part of a strategy and be subjected to other technical indicators.
Lowest Allowed N :
Indicates the number of the lowest frequency component used in the reconstructed time series.
Highest Allowed N :
Indicates the number of the highest frequency component used in the reconstructed time series.
Filtering Time Range block:
Specifies the time range over which real-time FFT filtering is applied. The reason for the presence of this block is that the FFT procedure is relatively computationally intensive. Therefore, the script execution may encounter the time limit imposed by TradingView when all historical bars are processed.
As always, I look forward to your feedback!
Also, leave a comment if you'd be interested in the tutorial on how to use this tool and/or in seeing the FFT filter in a strategy.

Daily SeasonalityDay trading trend filter indicator designed to hep get better entries or exits based on historical opens and closes each hour.
This indicator is NOT designed as an entry or exit signal. The purpose behind it is to give you statistical information about how likely certain times of day are either bullish , bearish or neutral and use that to confirm or reject other trading signals.
For example you might be anticipating a breakout based on your strategy or another indicator but see that the next few days are usually bearish and re-evaluate entering the trade.
The Daily Seasonality indicator calculates the percentage of candles per day of the week that had a higher close than open.
Default settings are:
- a look-back of 52 weeks (1 year).
- extreme bullish ( bright green) above 74%
-extreme bearish ( bright red) below 25%
- bullish (green) above 55%
- bearish (red) below 45%
- neutral (white) exactly 50%
- no trend (gray) 46% - 54%
All of these are updatable via the settings.
This indicator is designed to work only on the Daily timeframe.

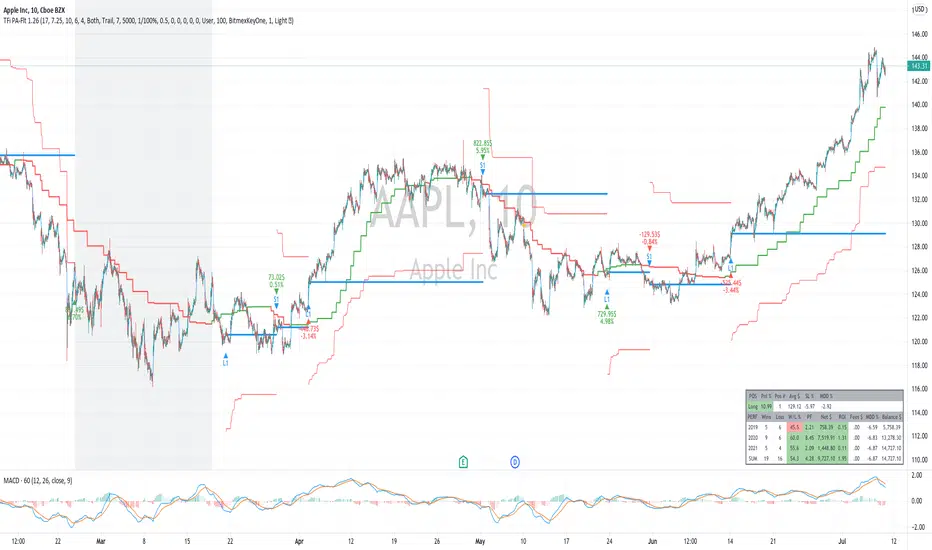
TFi Price Action Resampling Filter V1 - FULLThe script is resampling the price based on its range/price-action and creates an alternative filter to smoothen price movements.
Overview of features:
Optional stop-loss
Optional flags to control the position entry
Optional flags to control the position exit
Built-in backtesting engine with start balance, position size and pyramiding; each year will be evaluated separately
Inputs for a percentage entry and exit slippage, entry/exit and daily funding fees
Configurable alerts, which follow the exact position of the entry/exit marker
Alert messages contain predefined trading instruction to execute orders via Alertatron or TradeFab's proprietary trading server, or can be defined by the user
The script renders a performance/status table, which shows the current position status and result of the built-in trading simulation results.
It shows the following statistic values:
Current position PnL - also background turns green if position is in profit and red if in loss
Average entry price and number of positions
Current percentage distance to the optional stop-loss level
Current Maximum Draw Down
Number of wins and losses and the win/loss ratio per year and overall
Profit and loss amount, paid fees per year and overall
Profit-ratio and Maximum Draw Down per year and overall
Balance and ROI per year and overall
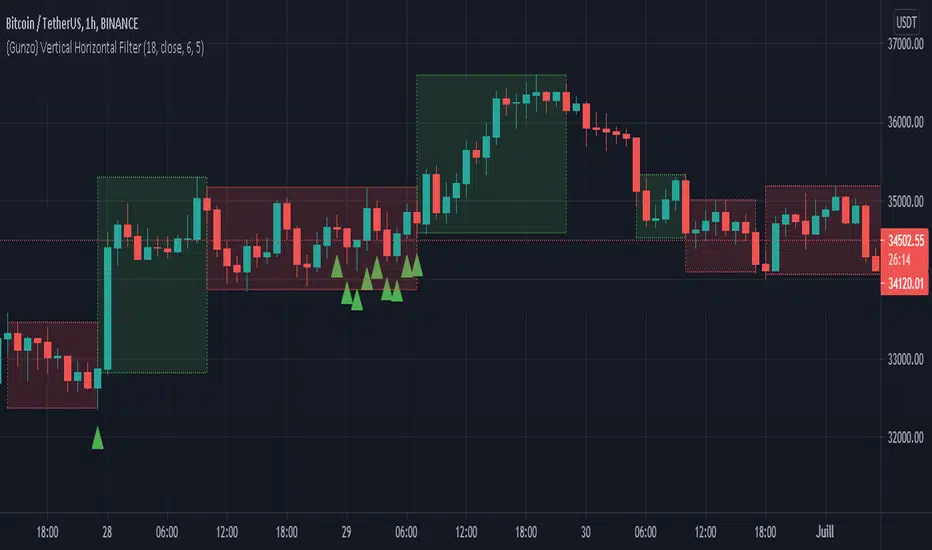
{Gunzo} Vertical Horizontal Filter (Trading ranges)Vertical Horizontal Filter indicator is a tool that can be used to identify market conditions (ranging or trending). It measures if the price is going vertical (uni-directional) or horizontal (non-directional).
OVERVIEW :
The Vertical Horizontal Filter is a technical analysis indicator created by Adam White in 1991. He described it in the “Issues of Futures” magazine for the first time. The indicator is only composed of one line that measures the level of trend activity.
If the VHF line is increasing, we consider that the trend is getting stronger (up-trend or down-trend). Otherwise, if the VHF line is decreasing, we consider that the trend is weakening (going sideways or even ranging) as the market is getting calmer
CALCULATION :
The level of trend activity is calculated as the ratio between the distance from the highest to the lowest value (on the last N days) and the movement of the closing price.
VHF = ( highest (high) – lowest (low) ) / sum( close – previous close)
SETTINGS :
VHF length : Length of the vertical horizontal filter (28 or 18 recommended)
VHF source : Source of the vertical horizontal filter (close recommended)
VHF smoothing length : Extra smoothing applied on the VHF line to filter noise (1 or 6 or 9 or 14 recommended)
Display ranging market rectangles : Display rectangles on the chart around the area where VHF is decreasing (ranging market)
Display trending market rectangles : Display rectangles on the chart around the area where VHF is increasing (trending market up or down)
Minimum rectangle size : Hide rectangles that are smaller than X candles
Display signal line : Display circles at the bottom of the chart with the raw VHF direction (green if increasing /red if decreasing)
Display VHF tops and bottoms : Display triangles if the VHF line is reaching a new high or new low over the last 100 candles. When consecutive triangles appear, it may be a sign that the current market conditions are ending. Green triangles mean the possible end of the ranging market and red triangles mean the possible end of the trending market.
VISUALIZATIONS :
This indicator has 3 possible visualizations :
Rectangles : the rectangles are drawn on areas where the VHF is decreasing (red) or increasing (green) for a minimum number of consecutive candles. The first candles of an area may not be representative of the market conditions as the VHF line is still in extreme values but going slowly in the opposite direction. The market conditions (ranging or trending) get stronger with the VHF line keeping the same direction.
Signal line : The signal line is the VHF raw data : the red circle is a decreasing VHF line, and the green circle is an increasing VHF line.
Tops and bottoms : The tops and bottoms are signals indicating that the VHF line is reaching extreme values, there is a high probability that the market conditions are going to change after that.
USAGE :
This indicator can be used as a filter for strategies based on other technical analysis indicators.
If you are using trending indicators like moving averages, you should consider using them only when the market is trending. You can use VHF increasing to confirm that the market is not ranging.
If you are using oscillating indicators like stochastic or commodity channel index, you may prefer using them when the market is ranging as trending indicators may not be useful. You can use the VHF decreasing to confirm that the market is ranging.
Ehlers Distance Coefficient Filter [CC]The Distance Coefficient Filter was created by John Ehlers and this is one of his more unknown moving averages. It works well because in an uptrend or downtrend it behaves more like a trailing stop system but it also deals with issues like pullbacks pretty quickly. I think it works well with the default values but let me know if you find a more profitable system. Buy when the indicator turns green and sell when it turns red.
Let me know if there are any other indicators you would like to see me publish!

Volume, Momentum and Volatility weighted moving averageMoving averages are filters on price data. This moving average creates a filter which factors in:
- the price RSI or it's Momentum
- the volume RSI
- the RVI or Volatility
Each factor is put through a least squares filter to smooth them first.
Then the factors are used to build a coefficient for an exponentially weighted average.
The chart above shows a comparison of standard average types with this script.
This is useful if you are looking for a moving average based trigger and do not wish to react to candle noise price action.

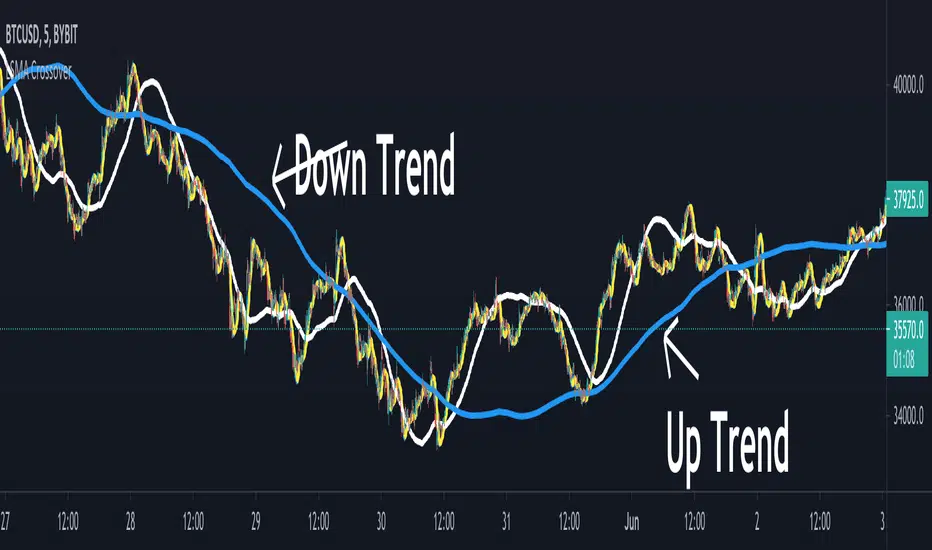
LSMA CrossoverThis is a simple script designed to help filter out bad trades. LSMA is a trend king and by using the 21,200 and 1000 length lines traders can get a clear view of where price action is travelling. This indicator is the perfect companion to the LSMA Wave Rider indicator. Once a pullback is discovered (price action crosses under blue or white line) Traders can use LSMA Wave Rider to locate perfect entry point.
Least Squares Moving Average follows these rules:
When price crosses over it signals a bull trend.
When price crosses under it signals bear trend.
When price stays close or on the line sideways action is to be expected.
The direction of the line shows the direction of the trend.
Here is an example of finding good trades. Price action pulls below white or blue line.
Another example of what a pullback looks like.
This example shows how to find trend using crossovers.
Another example how trend can be found but by using line direction.
LSMA Wave Rider can be found here:
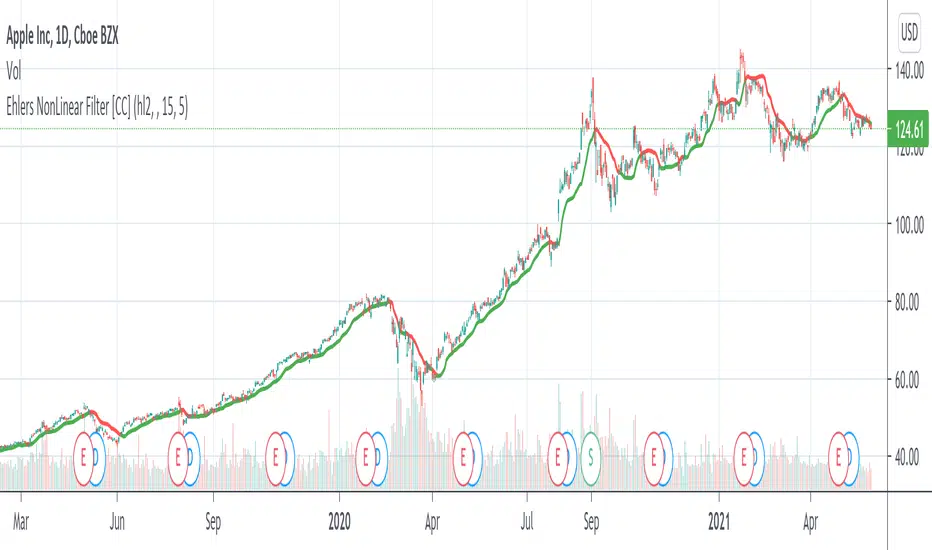
Ehlers NonLinear Filter [CC]The NonLinear Filter was created by John Ehlers and this one of his more unknown filters that work very well as a trendline and moving average. This is one of my favorites along with the instantenous trendlines that he created. Buy when the line turns green and sell when it turns red.
Let me know if there are any other indicators you would like to see me publish scripts for!
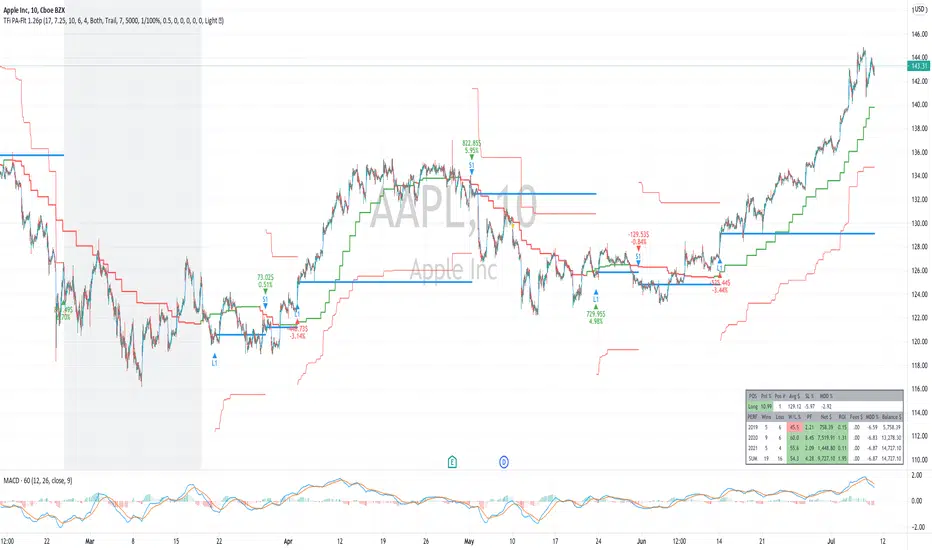
TFi Price Action Resampling Filter V1The script is resampling the price based on its range/price-action and creates an alternative filter to smoothen price movements.
Overview of features:
Optional stop-loss
Optional flags to control the position entry
Optional flags to control the position exit
Built-in backtesting engine with start balance, position size and pyramiding
Inputs for a percentage entry and exit slippage, entry/exit and daily funding fees
Configurable alerts, which follow the exact position of the entry/exit marker
Alert messages contain predefined trading instruction to execute orders via Alertatron or TradeFab's proprietary trading server
The script renders a status box at the last bar, which shows the current position status and result of the built-in trading simulation results.
It shows the following statistic values:
Current position PnL - also background turns green if position is in profit and red if in loss
Average entry price and number of positions
Current percentage distance to the optional stop-loss level
Current Maximum Draw Down
Overall number of wins and losses and the win/loss ratio
Overall profit and loss amount, paid fees
Overall profit-ratio and Maximum Draw Down
Overall balance and ROI
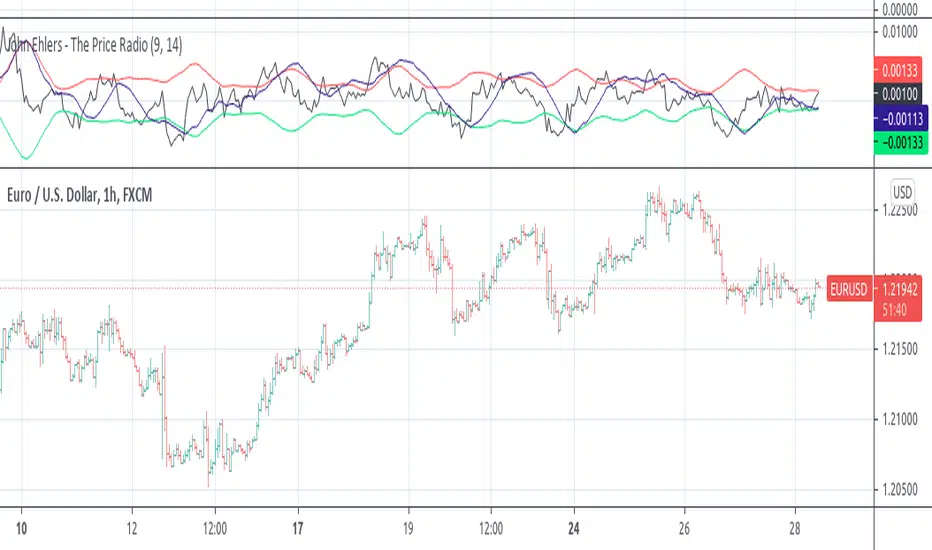
John Ehlers - The Price RadioPrice curves consist of much noise and little signal. For separating the latter from the former, John Ehlers proposed in the Stocks&Commodities May 2021 issue an unusual approach: Treat the price curve like a radio wave. Apply AM and FM demodulating technology for separating trade signals from the underlying noise.
reference: financial-hacker.com
Percentile Rank Market FilterA simple script to filter bull and bear markets by using percentile rank filter. Using market regimes to filter by bull/bear/sideways markets helps to understand how your strategy will
behave in various market regimes and allows you to avoid unprofitable regimes and only trade in profitable ones.
The idea of market regime filtering is used in the most successful technical algorithmic trading strategies, as one should always design a trading strategy with a particular market in mind according to trading legend, Larry Connors
Feel free to use this script in your strategies to improve your profits and lower drawdowns.

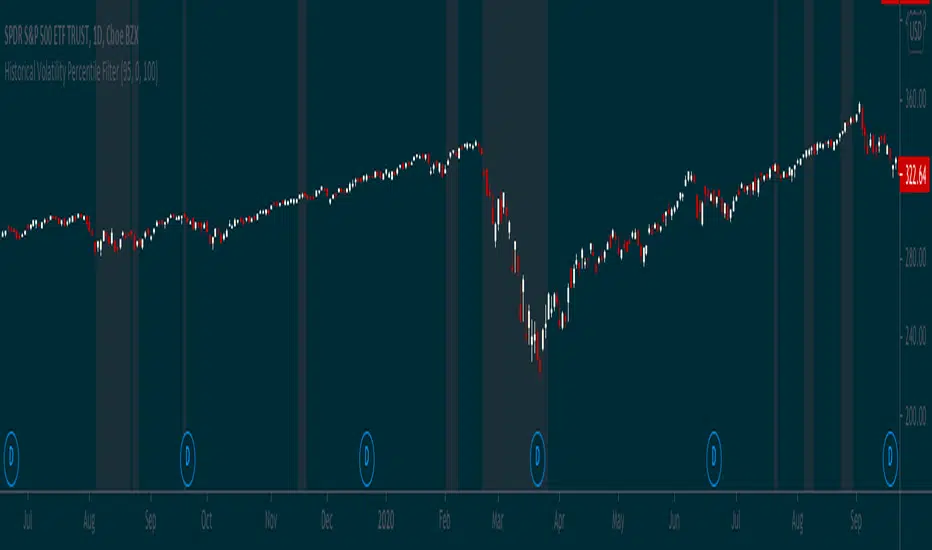
Historical Volatility Percentile FilterThis indicator provides a simple market regime filter for Historical Volatility. Depending on the strategy that you are using, it is useful to know how your strategy will perform at different
ranges of volatility, as this can greatly impact your performance. For instance, some of my long-only mean reversion strategies will only take trades where the volatility percentile is not extremely high, as this can often indicate fundamental changes in the security or the start of a big market correction. Some strategies may work better when volatility is higher
Feel free to use the following code along with your strategies to help improve performance and reduce the volatility of your gains in the long term.
Bot go_up strategyHello. This strategy is based on go_up alerts.
Our task is to find the local minimum. The trade is entered on the basis of RSI and SMA according to a specific formula, which is embedded in the code. When the RSI crosses the SMA upside down, a long position is entered. You can change the length of the RSI . The longer the length, the less frequent, but more accurate the entrance, and vice versa. You can use a different time frame.
The settings have:
1) RSI length, the lower the length, the more often the entry.
2) Testing results for any period of time
3) Take profit for any percentage
4) Stop order for any percentage
5) If there is a check mark ✅, then purchases will always be made, and if not, then purchases will be made, BUT, if the next payback is lower than the previous one, it does not matter by what percentage.
6) If there is a check mark ✅, then each trace of the purchase will be made provided that it is lower by the percentage specified, even if the conditions of the purchase are triggered.
7) The filled area is made for visual display of consolidation zones
Default settings:
RSI length 15, step 1.5, take profit 15, stop order 30.
Also in the settings there is a pyramid of the order, keep this in mind. Enter a deal for a small part of the deposit, and not for all the money at once! You can remove pyramiding and see the results with one entry.
For a more visual understanding, overlay the go_up script.
You can choose a strategy for yourself based on history! If you need examples of strategies, then write to me, my contacts are in the column: instructions from the author.
Successful trades, dear friends, I am glad that you trust me!

GBP-USD with w.volumethis script is base o 200 ema filter and trend for gbp-usd
1. long signal above 36 ema and long trend
2. short signal bellow 36 ema and short trend
3. take 2 profit target according %
4. trailing stoploss on close of every candel

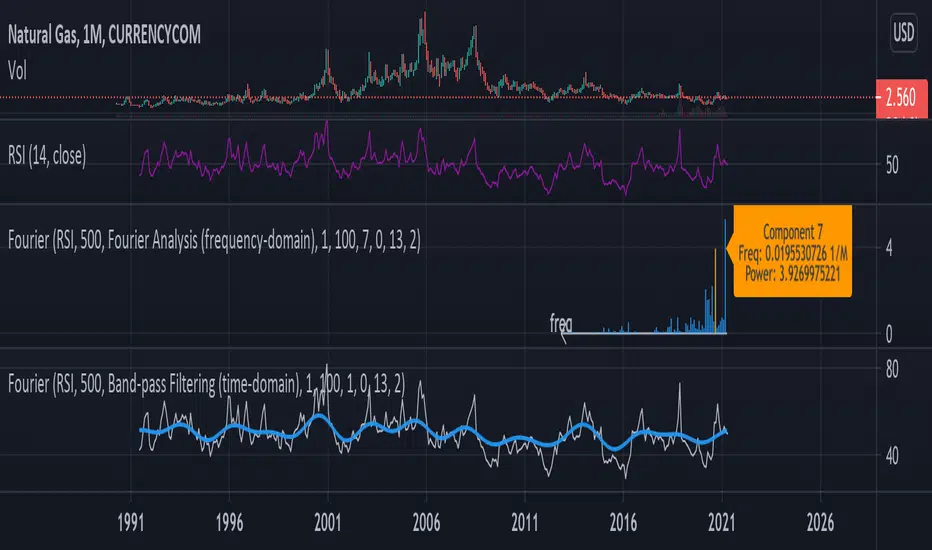
Fourier Analysis and Filtering [tbiktag]This tool uses Fourier transform to decompose the input time series into its periodic constituents and seasonalities , in other words, its frequency components . It also can reconstruct the time-domain data while using only the frequency components within a user-defined range (band-pass filtering). Thereby, this tool can reveal the cyclical characteristics of the studied market.
USAGE
The source and the size of the input data can be chosen by the “ Dataset Source ” and “ Dataset Size ” options. Price, volume, or some technical indicator (e.g., RSI, MACD, etc.) can serve as a source of the input data.
“ Action ” defines the type of the plot that will be displayed. Two options are available:
- Fourier Analysis
If selected, the frequency spectrum of the squares of the Fourier coefficient magnitudes is displayed. The zero-frequency component is on the right. Since the magnitudes of half of the coefficients are repeated, the graph displays only half of the frequency components.
The squared magnitude of a given frequency component is a measure of its power , that is, its contribution to the total variance of the dataset. Thus, by analyzing the frequency-domain spectrum, one can identify the most prominent seasonalities and then visualize them by using the " Band-pass Filtering " option (see below). Note that the zero component stores information about the amount of data, so it is naturally higher when the data is not centered at zero.
By activating the " Info about Frequency Component " option, the user can display information about the power and frequency of the selected Fourier component.
- Band-pass Filter
This option reconstructs and plots the dataset in the time domain, blocking frequency components outside of the cutoff frequencies (defined by the input parameters “ Upper Cutoff ” and “ Lower Cutoff ” input parameters in the “ Band-pass Filter Properties ” section).
FURTHER READING
In general, Fourier analysis has a long history of attempted applications for analyzing price data and estimating market cycles. For example, see the paper by John Ehlers
www.mesasoftware.com
and also some tools available here on TradingView, such as:
“Function: Discrete Fourier Transform” by @RicardoSantos
“Fourier series Model Of The Market” by @e2e4mfck
“Ehlers Discrete Fourier Transform” by @cheatcountry
Thus, I tried to make this tool versatile and user-friendly so you all can experiment with your own analysis.
Enjoy and don't hesitate to leave your feedback in the comments below!
The Bayesian Q OscillatorFirst of all the biggest thanks to @tista and @KivancOzbilgic for publishing their open source public indicators Bayesian BBSMA + nQQE Oscillator. And a mighty round of applause for @MarkBench for once again being my superhero pinescript guy that puts these awesome combination Ideas and ES stradegies in my head together. Now let me go ahead and explain what we have here.
I am gonna call it the Bayesian Q Oscillator I suppose. The goal of the script is to solve an issue both indicators on their own suffer from. QQE signals are not new and often the problem has always been false signals for them. They are good for scalping but the difference between a quality move and a small to nearly nonexistent move following a signal is not so clear. Kivanc made his normalized version to help reduce this problem by adding colors to his histogram type verision that would essentially represent if price was a trending move or in a ranging structure. As you can see I have kept this Idea but instead opted for lines as the oscillator. two yellow line (default color) is a ranging sideways area and when there is red or green it is trending up or down. I wanted to take this to the next level with combining the Bayesian probability oscillator that tista put together.
The Bayesian indicator is the opposite for its issue as it is a probability indicator that shows which candle or price movement is more likely to come next. Red rising means possibly down move soon and green means up soon. I will not go into the complex details of this indicator but will suggest others take a look at his and others to understand the idea behind them. The point I am driving at is that it show probabilities or likelyhood without the most effecient signal device to match it. This original was line form and now it is background filled colors.
The idea. is that you can potentially get some stronger and more accurate reversal signals with these two paired together. when you see a sell signal or cross with the towering or rising red... maybe it is a good jump potentially. The same for green. At the same time it is a double added filter effect from just having yellow represent it is ranging... but now if you get a buy signal (example) and have yellow lines (example) along wi5h a red rising or mountain color background... it not only is an indication of ranging, but also that there is potentially even a counter move coming based on the probabilities. Also if you get into a good trade and see dual yellow qqe crosses with no color represented by the bayesian background... it is possible it might only be noise.
I have found them to work decently in the 1 hour timframe. Let me know your experience.
I hope everyone takes a look at the originals to understand them. Full credit goes to those guys for this to be here. Let me know how it is working out for you.
Here are the original links.
bayesian
Normalized QQE

Exotic SMA Explorations Treasure TroveThis is my "Exotic SMA Explorations Treasure Trove" intended for educational purposes, yet these functions will also have utility in special applications with other algorithms. Firstly, the Pine built-in sma() is exceedingly more efficient computationally on TV servers than these functions will be. I just wanted to make that very crystal clear. My notes elaborate on this in the code blatantly.
Anyhow, the simple moving average(SMA) is one of the most common averaging filters used in a wide variety of algorithms. "Simply put," it's name says a lot about it. The purpose of this script, is to demonstrate variations of it's calculation in a multitude of exotic forms. In certain scenarios our algorithms may require a specific mathemagical touch that is pertinent to our intended goals. Like screwdrivers, we often need different types depending on the objective we are trying to attain. The SMA also serves as the most basic of finite impulse response(FIR) algorithms. For example, things like weighted moving averages can be constructed by using the foundational code of SMA.
One other intended demonstration of this script, is running multiple functions for comparison. I have had to use this from time to time for my own comparisons of performance. Also, imbedded into this code is a method to generically and recklessly in this case, adapt an algorithm. I will warn you, RSI was NEVER intended to adapt an algorithm. It only serves as a crude method to display the versatility of these different algorithms, whether it be a benefit or hinderance concerning dynamic adaptability.
Lastly, this script shows the versatility of TV's NEW additions input(group=) and input(inline=) upgrades in action. The "Immense Power of Pine" is always evolving and will continue to do so, I assure you of that. We can now categorize our input()s without using the input(type=input.bool) hackTrick. Although, that still will have it's enduring versatility, at least for myself.
NOTICE: You have absolute freedom to use this source code any way you see fit within your new Pine projects. You don't have to ask for my permission to reuse these functions in your published scripts, simply because I have better things to do than answer requests for the reuse of these functions. Sufficient accreditation regarding this script and compliance with "TV's House Rules" regarding code reuse, is as easy as copying the functions in their entirety as is. Fair enough? Good!
When available time provides itself, I will consider your inquiries, thoughts, and concepts presented below in the comments section, should you have any questions or comments regarding this indicator. When my indicators achieve more prevalent use by TV members, I may implement more ideas when they present themselves as worthy additions. Have a profitable future everyone!