Wskaźniki, strategie i biblioteki
Hello Traders, This is " ZigZag with Fibonacci Levels " script. It finds the ZigZag, draw Fibonacci lines and put labels accordingly. I get many requests for this script, so here it is. You can set ZigZag period as you wish. Bigger numbers (such 20, 30) may give better perspective and result. It draws Fibonacci levels between 0%-100% and If the price goes...
Alternative to Fibonacci levels. There are actually many such ratios besides the golden ratio and the Fib sequence. This is based on the plastic ratio or the Padovan sequence. If you wish to use the ratios in the fib tool, the following are the corresponding alternate values : 0.245 0.325 0.430 0.570 0.755 1.000 1.325 1.755 2.325 3.080 4.080
This is a modded version of TV builtin "Auto Fib Retracement". This version has the option to format price label. Sometimes when you analyzing e.g. altcoin charts against BTC. They can have more then 2 decimal points and the old version displays 0 when that happens. I also optimized it a little so it should be faster now
This is a new indicator that uses Murrey Math formulas to find the tops and bottoms, then uses those tops and bottoms to draw long-term fibonacci retracement levels. The genius of Murrey was his geometric formulas to calculate the right place to start plotting the lines, but I think the fibonacci ratios typically seem more accurate than the MM line ratios. So in...
Fibonacci retracements are popular among technical traders. In technical analysis, a Fibonacci retracement is created by taking two extreme points (usually a peak and a trough) on a stock chart and dividing the vertical distance by the key Fibonacci ratios of 23.6%, 38.2%, 50%, 61.8%, and 100%. Basic fibo levels are often known to be 14.6%, 23.6%, 38.2%, 50%,...
Hello Traders This script finds Tops when RSI is in overbought area or Bottoms when RSI is in oversold area and checks the divergence between them. it checks divergence at tops/bottoms after RSI exited from OB/OS areas. You can change overbought / oversold levels. You can limit the time that RSI is in OB/OS area with the option "Max Number of Bars in OB/OS" you...
The fib are plotted to previous day High and low to find next days support and resistance based on fibs.
This script draws a High-To-Low or Low-To-High Fibonacci Retrace over the chart, based on which of those two happens in the given time period (Default is 144 Candles). Updates from older versions: - Paints 0.5, 0.618, 0.65 and spaces in between, giving good hindsight to the trend, and ideas of where strong support/resistance may lie. - Silver Paint Strip = 0.50...
This script calculates and plots the All time Fibonacci Retracement of the chart. It's based on the ATH (All Time High) and the ATL (All Time Low). Made simple, you can choose which levels you wanna plot in the parameters menu. Enjoy !
Hello Traders! After the addition of "Arrays" to the Pine, I developed new and improved version of Support Resistance - Dynamic script as version 2. In this script Arrays were used. This can be used as Support Resistance tool, also it will be an example for the people who want to learn Array usage in Pine. Many thanks to Pine Team for adding Arrays! The...
TMSignal Auto Fibonacci V1.0: Automatically calculates the Fibonacci Retracement + Extension of 161.8% in order to always have it plotted in a "millimeter" way. At the same time, it allows viewing or removing the different levels, so that each one can be configured as desired. We hope you like it! Contact us any question or improvement suggestions.
Hello Traders, With the info "Trend is Your Friend ", you should not take position against the trend. This script checks multipte moving averages if they are above/below the closing price and try to find trend. The moving averages with the length 8, 13, 21, 34, 55, 89, 144, 233, 377 used. these are fibonacci numbers, but optionally you can change the lengths...
Auto Fibonacci levels using the current day's high and low
Simple Fibonacci Retracement is a free and easy to use script to plot Fibonacci levels, for any assets like Stocks, Forex, Commodities , Cryptocurrencies etc. on any time frame chart. Fibonacci Levels can be plotted using Lookback or manual Price input from the settings. 1. Lookback type - Candles Determines the High and Low price of the user input number...
Hello Traders! This is the script that finds Consolidation Zones in Realtime. How it works? - The script finds highest/lowest bars by using "Loopback Period" - Then it calculates direction - By using the direction and highest/lowest bar info it calculates consolidation zones in realtime - If the length of consolidation area is equal/greater than user-defined...
This script will allow to automatically draw levels on the chart for a potential pullback play like shown in this snapshot here It will draw risk/reward levels upon your favorite ema (default is 13ema) as the price goes and it will work for both long or short scenarios for a potential trend continuation play. You got the option to align your level to match...
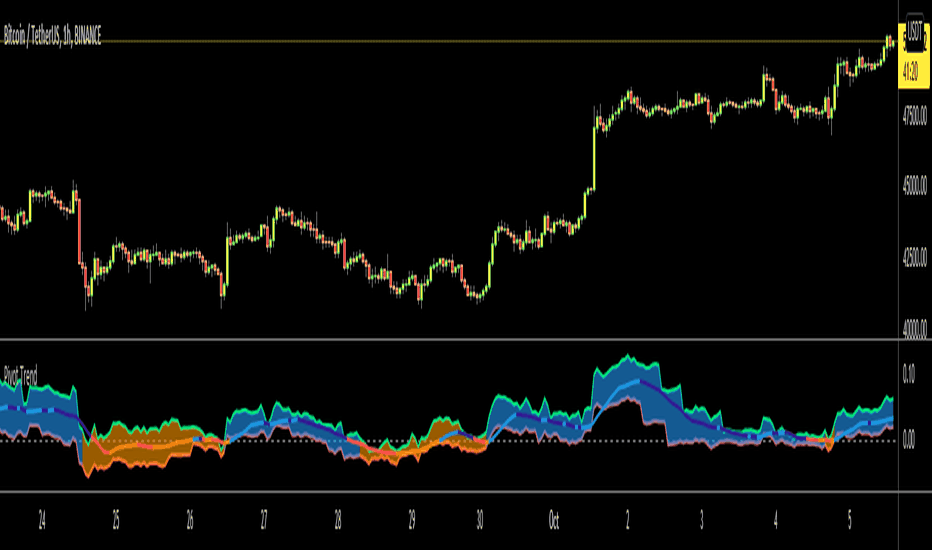
Hello Traders, Another original idea is here with you. Actualy I can say that it's a breakout strategy that uses multiple Pivot Point's averages. How it works? - it finds the Pivot Points, you can set the length as you want - it gets averages of Pivot Highs and Pivot Lows, you can set the number of Pivot Points to be included - it compares the current closing...
A series of Fibonacci sequences using a variety of triggers to base highs and lows off. High and low look back length can be altered, fibs and fib extensions can be shown or hidden and the background can be filled or transparent.


![[JRL] MM Fibonacci EURUSD: [JRL] MM Fibonacci](https://s3.tradingview.com/e/eIHtlRnM_mid.png)


