PCCE + False Breakout DetectorPCCE + False Breakout Detector
Type: Invite-Only Indicator (closed source)
Purpose : Detect price compression and the first expansion after it, while flagging failed breakouts (bull/bear traps) for risk control.
1) What’s original here!
This tool integrates three behaviour-driven tests that work in a single decision flow:
A compression score built from:
(a) monotonic body shrink,
(b) wick-dominance, and
(c) relative range contraction versus history.
This is not a bands/oscillator port; it’s a structure-first filter that isolates coils.
A thrusted expansion requirement that combines real-body impulse and relative-volume participation (+ optional EMA alignment) to qualify a breakout beyond the coil envelope.
An immediate post-breakout failure test (trap logic) that checks whether the breakout re-enters the prior swing range within a short window.
Used together, these steps turn raw breaks into contextual, risk-aware events: setup → trigger → validation. That is the value of the combination.
⸻
2) Concepts behind the calculations:
Let body_t = |close_t − open_t|,
uw_t = high_t − max(open_t, close_t) (upper wick),
lw_t = min(open_t, close_t) − low_t (lower wick),
R_t(k) = highest(high, k)_t − lowest(low, k)_t (range over k bars),
MA_body(k) = SMA(body, k), MA_vol(k) = SMA(volume, k).
2.1 Compression (coil) detection
We evaluate within a window k = coilLength:
• Body shrink count: number of consecutive steps where body_(t−i) < body_(t−i−1).
• Wick dominance: AvgWickBody = avg( (uw + lw) / body ) over the window; require AvgWickBody > wickRatioMin.
• Relative range contraction: current R_t(k) must be less than α × avg( R_(t−j)(k) ) computed over a lookback of rangeWindow windows, with α < 1 (tight market).
When all three are true, we mark a coil zone; the coil bounds are High_coil = highest(high, k), Low_coil = lowest(low, k).
2.2 Expansion (“Burst”) confirmation
A breakout is only qualified when all hold on bar close:
• Direction: close > High_coil → up; close < Low_coil → down.
• Body thrust: body_t > MA_body(k) × bodyMult.
• Participation: volume_t > MA_vol(k) × volumeMultiplier.
• Trend alignment (optional): close_t > EMA(emaLen) for up / < EMA for down.
• Cooldown: t − lastSignal > cooldownBars.
If satisfied, print Burst↑ or Burst↓ on that bar.
2.3 Failed breakout (trap) detection
Let H_s and L_s be the prior swing high/low from a lookback rangeLookback (excluding the current bar). Define:
• Bull break attempt: a bar that closed above H_s.
Bull trap: within fakeoutBars bars after that attempt, any close returns below H_s. Mark ❌ red above that bar.
• Bear break attempt: a bar that closed below L_s.
Bear trap: within fakeoutBars bars after that attempt, any close returns above L_s. Mark ❌ green below that bar.
Alerts fire on bar close only.
⸻
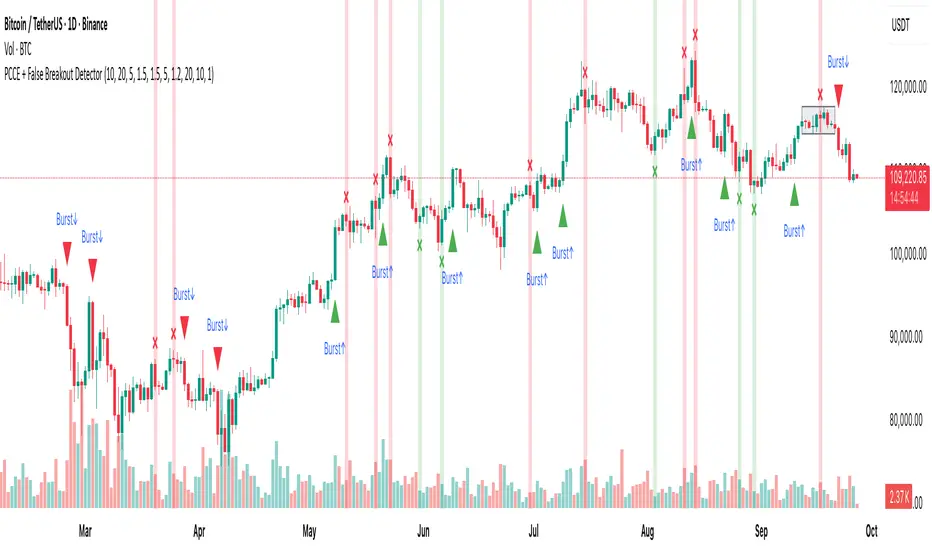
3) What you’ll see on the chart
• Coil box: shaded envelope (tight-range bounds).
• Burst labels: Burst↑ / Burst↓ only when thrust + volume (and optional EMA) confirm the break.
• Trap markers: ❌ red (failed bullish breakout) / ❌ green (failed bearish breakout).
• Alerts: “Burst Up” and “Burst Down” (close-based).
⸻
4) How to use it
1. Preparation : When a coil box appears, mark the bounds; expect expansion risk to rise.
2. Trigger : Act only on Burst labels (they already encode body/volume thrust and optional trend).
3. Validation : If a ❌ trap prints shortly after a breakout, treat it as a warning/exit event; breakouts that re-enter the prior swing range are statistically fragile.
4. Context : Works well on 15m–4H where structure is visible. Combine with your own higher-timeframe bias, S/R, liquidity pools, and risk rules.
5. Tuning :
• Tighten/loosen coil sensitivity via coilLength, wickRatioMin, and the range contraction factor.
• Use larger bodyMult / volumeMultiplier to demand stronger breaks.
• cooldownBars controls clustering in fast sessions.
• rangeLookback and fakeoutBars control how strict the trap check is.
⸻
5) Repainting, scope, and limitations
• Burst and trap labels are evaluated on bar close; once printed, they do not repaint. Coil boxes can update while forming; they stabilize once conditions are met.
• Sudden news/illiquid periods can defeat filters; adjust multipliers and cooldown for your instrument.
• This is an indicator, not a strategy; it does not publish PnL, win-rate, or forward promises.
Falsebreakout
PCCE + False Breakout DetectorPCCE + False Breakout Detector
Type: Invite‑Only Indicator (closed source)
Purpose: Identify volatility compression (“coil”) and the first expansion after it, while filtering failed breakouts (bull/bear traps).
What it does — in plain language
This tool unifies two complementary behaviours that often appear back‑to‑back around strong moves:
1. Price Coil Compression & Expansion (PCCE) – finds compact ranges created by shrinking candle bodies, wick dominance, and contracting range relative to recent history. When price expands out of that coil with strength, it prints a Burst↑ / Burst↓ label.
2. False Breakout Detection – monitors recent swing extremes. If price closes beyond a prior high/low but re‑enters that range within a short window, it marks a trap (❌ red for failed bullish breakout, ❌ green for failed bearish breakout).
Why combine them?
PCCE tells you where the next move is likely brewing; the trap filter validates whether the breakout is genuine or failing. Used together they turn raw breakouts into structured, risk‑aware opportunities.
How it works — concepts behind the calculations
1) Detecting “Coil” (compression)
• Body contraction: Count of consecutive bars where |close-open| is decreasing within a sliding window.
• Wick dominance: Average (upper wick + lower wick) / body must exceed a threshold → indecision/liquidity probing.
• Relative range: Current high‑low over the window must be smaller than the average of prior windows (tight market).
• Coil zone: When the above conditions align, the most recent high/low envelope defines the coil’s bounds.
2) Confirming “Burst” (expansion)
A breakout through the coil high/low is only labelled when:
• Body thrust: current body > moving‑average body × multiplier (large real body).
• Relative volume: volume > moving‑average volume × multiplier (participation filter).
• Trend alignment (optional): close vs EMA to avoid counter‑trend bursts.
• Cooldown: minimum bars between signals to reduce clustering.
Result: Burst↑ if closing beyond coil high with thrust; Burst↓ if closing beyond coil low with thrust.
3) Flagging failed breakouts (traps)
• Track recent swing high/low from a lookback excluding the current bar.
• If a bar closes beyond that swing but within N bars price closes back inside the swing range → flag a trap:
• Bull trap: ❌ red above bar (break above failed)
• Bear trap: ❌ green below bar (break below failed)
⸻
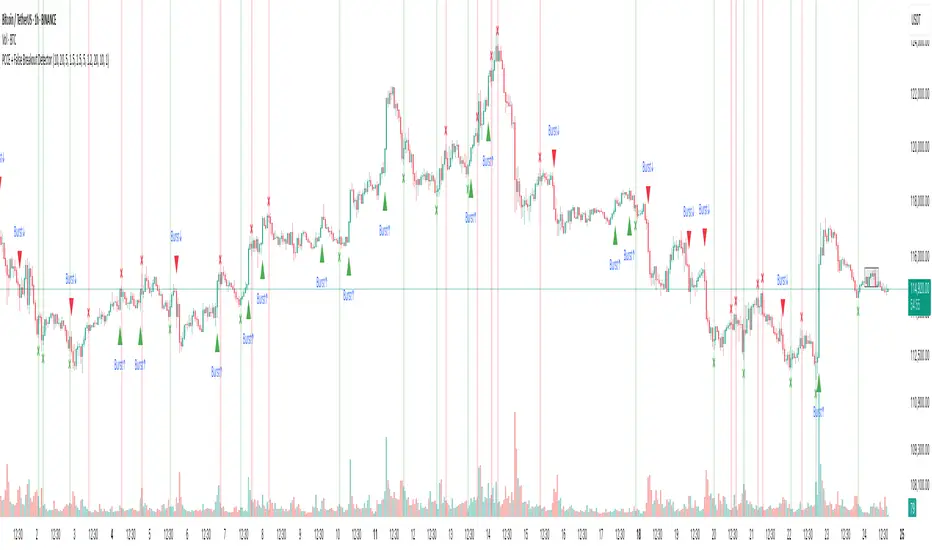
What you see on the chart
• Coil zone: a shaded box (tight range envelope).
• Burst labels: Burst↑ (triangle up) and Burst↓ (triangle down) at confirmed expansion bars.
• Trap markers: ❌ red (failed bullish breakout), ❌ green (failed bearish breakout).
• Alerts: “Burst Up”, “Burst Down” (fires on bar close only).
⸻
How to use it
1. Preparation : When a coil box forms, mark the zone and wait.
2. Trigger : A Burst label confirms the first expansion with thrust/volume; treat it as an entry cue only within your own plan.
3. Validation : If a ❌ trap appears shortly after a break, treat it as caution/exit info; the breakout is failing.
4. Context : Best on 15m–4H. Combine with higher‑timeframe bias, nearby S/R, and risk controls.
5. Parameters to tune :
• Coil window, wick‑to‑body threshold, and range tightness
• Body/volume multipliers
• EMA trend filter on/off
• Trap lookback and confirmation bars
• Cooldown bars
⸻
Originality & usefulness
• Behaviour‑first compression scoring: Coil detection blends monotonic body shrink, wick dominance, and relative range contraction—not generic bands or a single oscillator.
• Two‑stage discipline: A burst is not just any break; it requires body thrust + relative volume (+ optional trend) to reduce noise.
• Immediate invalidation layer: The trap filter is evaluated right after the burst context, turning breakouts into risk‑aware signals rather than blind entries.
• Operator controls: Cooldown + multipliers let traders adapt the strictness to instrument/session behaviour.
⸻
Repainting & limitations
• Signals are evaluated on bar close; no lookahead, no request.security() with lookahead_on.
• Coil boxes while forming can update until confirmed; Burst/Trap labels do not repaint after their bar closes.
• News spikes and illiquid hours can still create noise; adjust multipliers and cooldown for your market.
⸻
Disclaimer
This indicator is an educational decision‑support tool, not financial advice. Markets are uncertain; past behaviour does not guarantee future results. Use with your own analysis and risk management.
Liquidity Sweep Scanner [TradingFinder]🔵 Introduction
Recognizing how liquidity develops and how price reacts at key structural levels is critical for spotting precise, low-risk trade entries. The Liquidity Sweep Scanner is an advanced tool built to track market activity in real time, pinpoint liquidity sweeps, define reaction zones, and identify confirmation candles across multiple instruments and timeframes.
Key Advantages :
Detects high-probability reversal points with precision.
Combines liquidity analysis, market structure, and candle confirmation.
Works seamlessly across multiple symbols and timeframes.
This screener can scan a broad watchlist or analyze every timeframe of a single asset to find optimal reversal zones. It starts by identifying a clear swing point either a swing high or swing low and marking a reaction zone between that point and the candle’s highest or lowest open/close value.
If price revisits the zone, performs a liquidity grab, and forms an indecision candle such as a doji or narrow-bodied bar that closes inside the zone, this may indicate rejection of the level and a failed breakout attempt. Based on the surrounding market context, the screener then flags a potential bullish or bearish reversal and generates the appropriate Long or Short signal.
By focusing on precise entry timing, institutional order flow alignment, and filtering out false breakouts, the Liquidity Sweep Scanner zeroes in on the market areas where liquidity engineering, reversal potential, and inefficiency overlap. This makes it an indispensable tool for price action traders who rely on clear, high-quality setups without the distraction of market noise.
🔵 How to Use
The Liquidity Sweep Scanner continuously evaluates market structure, issuing alerts when a potential reversal setup emerges. It merges liquidity behavior, swing point analysis, and candle confirmation within predefined reaction zones.
To illustrate, imagine price forms a swing high or low, then later returns to that level. If it sweeps the prior extreme and produces a qualifying candle inside the reaction zone, the tool signals a possible reversal.
🟣 Long Setup
For a bullish scenario, the screener first spots a valid swing low a level often packed with sell-side liquidity. From there, it defines a reaction zone stretching from the swing low to the candle’s lowest open/close point.
If price retests this area with a wick dipping below the swing low but then closes back inside the zone, it signals absorption of selling pressure and rejection of further downside. The screener then awaits a confirmation candle commonly a doji or small-bodied bar closing inside the zone. Once these conditions align, a Long signal is logged and, if alerts are active, the trader receives a notification.
🟣 Short Setup
For bearish opportunities, the process begins by locating a valid swing high typically an area dense with buy-side liquidity. The reaction zone is drawn from the swing high to the candle’s highest open/close value.
When price retests this zone, sweeps above the swing high, and fails to close higher, it suggests a bull trap and waning upward momentum. The screener then requires a confirmation candle often a doji or rejection bar that closes back within the zone before confirming a Short signal.
These bearish setups help traders pinpoint likely institutional sell zones, offering a clear view of where price may reverse following a liquidity event.
🔵 Settings
🟣 Logical settings
Liquidity Swing period : You can set the swing detection period.
Market Structure Period :You can set the Pivot Period to determine the detection direction.
Max Swing Back Method : It is in two modes "All" and "Custom". If it is in "All" mode, it will check all swings, and if it is in "Custom" mode, it will check the swings to the extent you determine.
Max Swing Back : You can set the number of swings that will go back for checking.
Maximum Distance Between Swing and Signal : The maximum number of candles allowed between the swing point and the potential signal. The default value is 50, ensuring that only recent and relevant price reactions are considered valid.
🟣 Display Settings
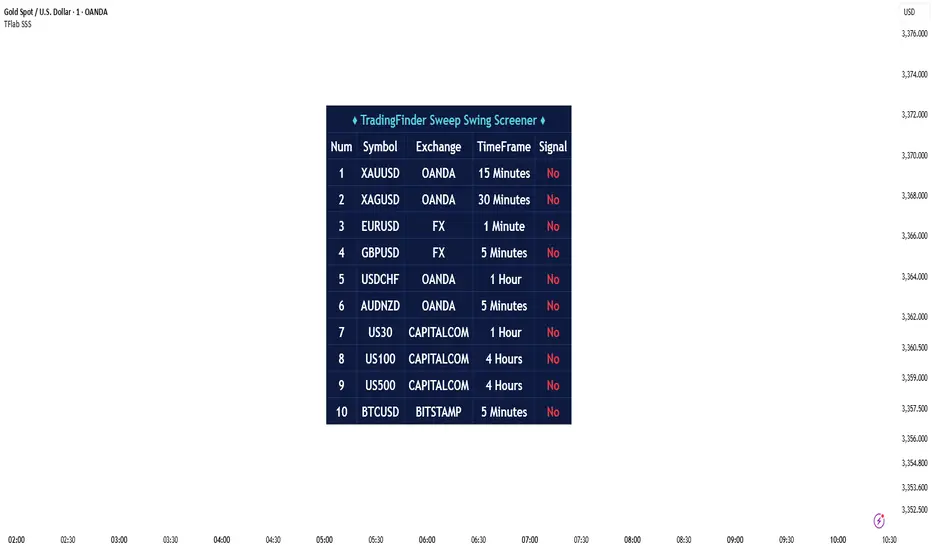
Table on Chart : Allows users to choose the position of the signal dashboard either directly on the chart or below it, depending on their layout preference.
Number of Symbols : Enables users to control how many symbols are displayed in the screener table, from 10 to 20, adjustable in increments of 2 symbols for flexible screening depth.
Table Mode : This setting offers two layout styles for the signal table :
Basic : Mode displays symbols in a single column, using more vertical space.
Extended : Mode arranges symbols in pairs side-by-side, optimizing screen space with a more compact view.
Table Size : Lets you adjust the table’s visual size with options such as: auto, tiny, small, normal, large, huge.
Table Position : Sets the screen location of the table. Choose from 9 possible positions, combining vertical (top, middle, bottom) and horizontal (left, center, right) alignments.
🟣 Symbol Settings
Each of the 10 symbol slots comes with a full set of customizable parameters :
Symbol : Define or select the asset (e.g., XAUUSD, BTCUSD, EURUSD, etc.).
Timeframe : Set your desired timeframe for each symbol (e.g., 15, 60, 240, 1D).
🟣 Alert Settings
Alert : Enables alerts for LSS.
Message Frequency : Determines the frequency of alerts. Options include 'All' (every function call), 'Once Per Bar' (first call within the bar), and 'Once Per Bar Close' (final script execution of the real-time bar). Default is 'Once per Bar'.
Show Alert Time by Time Zone : Configures the time zone for alert messages. Default is 'UTC'.
🔵 Conclusion
The Liquidity Sweep Scanner equips traders with a precise, structured method for spotting high-probability reversals by merging liquidity sweeps, reaction zone mapping, and candle confirmation.
It not only filters out market noise but also highlights price areas where inefficiency and reversal potential align. Beyond identifying clean entry points, the tool includes a market direction detection feature allowing traders to quickly determine the prevailing trend and align their trades accordingly.
With adjustable settings such as the Pivot Period for fine-tuning detection direction, it adapts to various trading styles and timeframes, making it a powerful and versatile addition to any trader’s strategy.
Płatny skrypt

Sweep Swing Screener [TradingFinder]🔵 Introduction
Understanding how liquidity forms and how price reacts around key structural levels is essential for identifying precise, low-risk entry points. The Sweep Swing Screener is a specialized tool developed to continuously monitor market activity and detect liquidity sweeps, reaction zones, and valid confirmation candles across various trading instruments and timeframes.
This tool can be applied both to scan multiple symbols at once and to analyze all timeframes of a specific asset for potential reversal points. It begins by identifying a clear swing point, whether a swing high or a swing low, and then outlines a reaction zone between that level and either the highest or lowest value of the swing candle's open or close.
If the price revisits this zone, performs a liquidity grab, and prints an indecision candle like a doji or a narrow-bodied bar that closes within the zone, this may indicate a rejection of the level and the failure of a breakout attempt. At that moment, depending on the context, the screener may identify a bullish or bearish reversal and generate a corresponding Long or Short signal.
By emphasizing accurate entry timing, alignment with institutional order flow, and avoidance of common traps, this approach highlights market areas where liquidity engineering, reversal probability, and price inefficiency come together. As a result, the Sweep Swing Screener becomes a valuable part of any trader’s toolkit, particularly for those who rely on price action and liquidity logic to drive their decisions. It allows traders to focus on clean, actionable setups without getting lost in noise or misleading breakouts.
🔵 How to Use
The Sweep Swing Screener is designed to track market structure in real time and alert users when conditions for a potential reversal are present. Its methodology combines liquidity behavior with swing analysis and candle confirmation, all within predefined reaction zones.
To better understand this logic, consider a basic market flow where a swing high or low forms, followed by a return to that level. If the price sweeps the previous extreme and forms a confirming candle within the reaction zone, a signal is issued.
🟣 Long Signal
To identify a long setup, the screener looks for a valid swing low, often a level below which sell-side liquidity is likely to be clustered. Once found, it defines a reaction zone from the swing low to the lowest point between the candle’s open and close.
If the price returns to this area and creates a lower wick that extends beneath the swing low, the tool checks whether the price manages to close back inside the range, rejecting the breakdown. This indicates absorption of selling pressure and failure to sustain the move lower.
The screener then waits for a confirmation candle to appear. Typically, this is a doji or other small-bodied candle that closes inside the zone. If these conditions are met, the screener records a Long signal for that asset and, if enabled, sends a notification to alert the user.
🟣 Short Signal
For bearish setups, the screener begins by identifying a valid swing high, which usually marks a level where buy-side liquidity is concentrated. It then creates a reaction zone from the swing high to the highest point between the candle’s open and close.
When price returns to this level, sweeps above the swing high, and then fails to close higher, it may signal the presence of a bull trap and early exhaustion in the upward move.
A confirmation candle, usually a doji or a rejection bar that closes back within the zone, is then required. Once that occurs, the screener marks the asset with a Short signal and optionally sends a real-time alert to the user.
This type of setup helps highlight potential institutional sell zones, offering insight into where price is likely to reverse following a liquidity event.
🔵 Settings
🟣 Logical settings
Swing period : You can set the swing detection period.
Max Swing Back Method : It is in two modes "All" and "Custom". If it is in "All" mode, it will check all swings, and if it is in "Custom" mode, it will check the swings to the extent you determine.
Max Swing Back : You can set the number of swings that will go back for checking.
Maximum Distance Between Swing and Signal : The maximum number of candles allowed between the swing point and the potential signal. The default value is 50, ensuring that only recent and relevant price reactions are considered valid.
🟣 Display Settings
Table Size : Lets you adjust the table’s visual size with options such as: auto, tiny, small, normal, large, huge.
Table Position : Sets the screen location of the table. Choose from 9 possible positions, combining vertical (top, middle, bottom) and horizontal (left, center, right) alignments.
🟣 Symbol Settings
Each of the 10 symbol slots comes with a full set of customizable parameters :
Symbol : Define or select the asset (e.g., XAUUSD, BTCUSD, EURUSD, etc.).
Timeframe : Set your desired timeframe for each symbol (e.g., 15, 60, 240, 1D).
🟣 Alert Settings
Alert : Enables alerts for SSS.
Message Frequency : Determines the frequency of alerts. Options include 'All' (every function call), 'Once Per Bar' (first call within the bar), and 'Once Per Bar Close' (final script execution of the real-time bar). Default is 'Once per Bar'.
Show Alert Time by Time Zone : Configures the time zone for alert messages. Default is 'UTC'.
🔵 Conclusion
The Sweep Swing Screener provides a systematic method for identifying potential reversal zones by combining price structure, liquidity behavior, and candle-based confirmation. In markets that are often noisy and full of failed breakouts, focusing on these three elements helps clarify directional bias and supports more confident decision-making.
With the ability to scan multiple symbols and timeframes efficiently, this tool allows traders to stay focused on high-quality setups without the need to manually sift through dozens of charts. The inclusion of optional alerts further enhances its utility by offering timely updates when criteria are met.
By moving away from reactive strategies and toward structural anticipation, this screener supports traders who align their methods with institutional logic and the mechanics of smart money.
True Breakout Pattern [TradingFinder] Breakout Signal Indicator🔵 Introduction
In many market conditions, what initially appears to be a decisive breakout often turns out to be nothing more than a false breakout or fake breakout. Price breaks through a key swing level or an important support and resistance zone, only to quickly return to its previous range.
These failed breakouts, which are often the result of liquidity traps or market manipulation, serve more as a warning sign of structural weakness than confirmation of a new trend.
This indicator is designed around the concept of the fake breakout.
The logic is simple but precise : when price breaks a swing level and returns to that level within a maximum of five candles, the move is considered a false breakout. At this point, a Fibonacci retracement is applied to the recent price swing to evaluate the pullback area.
If price, within ten candles after the return to the breakout level, enters the Fibonacci zone between 0.618 and 1.0, the setup becomes valid for a potential entry. This area is identified as a long entry zone, with the stop loss placed just beyond the 1.0 level and the take profit defined based on the desired risk-to-reward ratio.
By combining accurate detection of false breakouts, analysis of price reaction to swing levels, and alignment with Fibonacci retracement logic, this framework allows traders to identify opportunities often missed by others. In a market where failed breakouts are a common and recurring phenomenon, this indicator aims to transform these traps into measurable trading opportunities.
Long Setup :
Short Setup :
🔵 How to Use
This indicator operates based on the recognition of false breakouts from structural levels in the market, specifically swing levels, and combines that with Fibonacci retracement analysis.
In this strategy, trades are only considered when price returns to the broken level within a defined time window and reacts appropriately inside a predefined Fibonacci range. Depending on the direction of the initial breakout, the system outlines two scenarios for long and short setups.
🟣 Long Setup
In the long setup, price initially breaks below a support level or swing low. If the price returns to the broken level within a maximum of five candles, the move is identified as a fake breakout.
At this stage, a Fibonacci retracement is drawn from the recent high to the low. If price, within ten candles of returning to the level, moves into the 0.618 to 1.0 Fibonacci zone, the conditions for a long entry are met.
The stop loss is placed slightly below the 1.0 level, while the take profit is set based on the trader’s preferred risk-reward ratio. This setup aims to capture deeply discounted entries at low risk, aligned with smart money reversals.
🟣 Short Setup
In the short setup, the price breaks above a resistance level or swing high. If the price returns to that level within five candles, the move is again treated as a false breakout. Fibonacci is then drawn from the recent low to the high to observe the retracement area.
Should price enter the 0.618 to 1.0 Fibonacci range within ten candles of returning, a short entry is considered valid. In this case, the stop loss is placed just above the 1.0 level, and the take profit is adjusted based on the intended risk-reward target. This method allows traders to identify high-probability short setups by focusing on failed breakouts and deep pullbacks.
🔵 Settings
🟣 Logical settings
Swing period : You can set the swing detection period.
Valid After Trigger Bars : Limits how many candles after a fake breakout the entry zone remains valid.
Max Swing Back Method : It is in two modes "All" and "Custom". If it is in "All" mode, it will check all swings, and if it is in "Custom" mode, it will check the swings to the extent you determine.
Max Swing Back : You can set the number of swings that will go back for checking.
🟣 Display settings
Displaying or not displaying swings and setting the color of labels and lines.
🟣 Alert Settings
Alert False Breakout : Enables alerts for Breakout.
Message Frequency : Determines the frequency of alerts. Options include 'All' (every function call), 'Once Per Bar' (first call within the bar), and 'Once Per Bar Close' (final script execution of the real-time bar). Default is 'Once per Bar'.
Show Alert Time by Time Zone : Configures the time zone for alert messages. Default is 'UTC'.
🔵 Conclusion
A sound understanding of the false breakout phenomenon and its relationship to structural price behavior is essential for technical traders aiming to improve precision and consistency. Many poor trading decisions stem from misinterpreting failed breakouts and entering too early into weak signals.
A structured approach, grounded in the analysis of swing levels and validated through specific price action and timing rules, can turn these misleading moves into valuable trade opportunities.
This indicator, by combining fake breakout detection with time filters and Fibonacci-based retracement zones, helps traders only engage with the market when multiple confirming factors are in alignment. The result is a strategy that emphasizes probability, risk control, and clarity in decision-making, offering a solid edge in navigating today’s volatile markets.

ICT Setup 04 [TradingFinder] SFP Sweep Liquidity Fake CHoCH/BOS🔵 Introduction
In smart money and ICT based trading, liquidity is never random. Some of the most meaningful market moves begin with a liquidity sweep where price intentionally hunts a previous swing high or swing low to trigger stop loss orders and absorb volume.
This manipulation is often followed by a sharp reversal from a reaction zone, creating ideal conditions for a high probability entry. This indicator is built to detect exactly that. It identifies a valid swing point and defines a reaction zone where price is likely to react.
For short setups, the zone lies between the swing high and the maximum of the candle’s open or close. For long setups, it’s drawn from the swing low to the minimum of the open or close.
When price returns to this zone and forms a qualified confirmation candle typically a doji or a small bodied candle that closes inside the zone while sweeping the liquidity this is a potential sign of reversal.
The candle must show both the sweep and the inability to hold above or below the key level, signaling a fake breakout or failed move. By combining elements of liquidity hunt, reaction zone rejection, and candle based entry confirmation, this tool highlights sniper entry points used by smart money to trap retail traders and reverse the trend. It helps filter out noise and enhances timing, making it ideal for trading in alignment with institutional order flow.
Long Position :
Short Position :
🔵 How to Use
This indicator is designed to highlight precise moments where price sweeps liquidity and reacts within a high probability reversal zone. By identifying clean swing highs and lows and defining a smart reaction zone around them, it filters out weak fakeouts and focuses only on setups with strong institutional footprints.
The tool works best when combined with market structure analysis and is suitable for both scalping and intraday trading. Below is a breakdown of how to interpret the signals for long and short positions based on the visual setups provided.
🟣 Long Setup
In a long setup, the indicator first detects a valid swing low where liquidity has likely accumulated below. A reaction zone is then drawn between the swing low and the minimum of the open or close of the swing candle.
When price returns to this zone, it must sweep the previous low and form a precise confirmation candle, such as a doji or a small bodied candle, that closes inside the zone. This candle must also reject the lower level, showing failure to continue downward.
As shown in the chart, once the liquidity grab is complete and the confirmation candle forms, a clean long signal is issued, indicating a potential bullish reversal backed by smart money behavior.
🟣 Short Setup
In a short setup, the indicator identifies a swing high where buy-side liquidity is resting. It then constructs a reaction zone between the high and the maximum of the open or close of the swing candle. Price must return to this zone, sweep the swing high, and form a bearish confirmation candle inside the zone.
A classic example is a doji or rejection candle that traps breakout buyers and fails to hold above the previous high. In the provided chart, the price aggressively hunts the liquidity above the swing high, but the close within the reaction zone signals exhaustion, prompting a short signal with high reversal probability.
These setups represent moments where price action, liquidity behavior, and candle structure align to offer strong entries. By focusing on clean sweeps and reactive confirmations, the indicator helps traders stay on the side of smart money and avoid common breakout traps.
🔵 Settings
🟣 Logical settings
Swing period : You can set the swing detection period.
Max Swing Back Method : It is in two modes "All" and "Custom". If it is in "All" mode, it will check all swings, and if it is in "Custom" mode, it will check the swings to the extent you determine.
Max Swing Back : You can set the number of swings that will go back for checking.
Maximum Distance Between Swing and Signal :The maximum number of candles allowed between the swing point and the potential signal. The default value is 50, ensuring that only recent and relevant price reactions are considered valid.
🟣 Display settings
Displaying or not displaying swings and setting the color of labels and lines.
🟣 Alert Settings
Alert SFP : Enables alerts for Swing Failure Pattern.
Message Frequency : Determines the frequency of alerts. Options include 'All' (every function call), 'Once Per Bar' (first call within the bar), and 'Once Per Bar Close' (final script execution of the real-time bar). Default is 'Once per Bar'.
Show Alert Time by Time Zone : Configures the time zone for alert messages. Default is 'UTC'.
🔵 Conclusion
This indicator is built for traders who rely on liquidity driven setups and smart money principles. By combining swing structure analysis with precision reaction zones and strict entry confirmation, it isolates the exact moments where price sweeps liquidity and fails to continue. These are high value points where institutional activity often reveals itself, and retail traps unfold.
Unlike generic breakout tools, this script focuses on quality over quantity by requiring both a sweep of a swing high or low and a confirmed rejection candle that closes inside a predefined zone. With customizable swing depth, proximity filters, visual highlights, and alert functions, it offers a complete framework for identifying and acting on fake breakouts with confidence. Whether you trade forex, crypto, or indices, this tool enhances your ability to align with true order flow and take entries where liquidity is most likely to shift.

False Breakout PRO📌 False Breakout PRO – Enhanced False Breakout Detection Tool
False Breakout PRO is an advanced version of the original "False Breakout (Expo)" indicator by .
This tool is designed to help traders detect bullish and bearish false breakouts with high precision. By offering a more customizable and smarter interface, it helps reduce noise and false signals through various filtering and visualization options.
🔍 How It Works
The script continuously scans for new highs or lows based on a user-defined period.
It identifies false breakouts when price briefly breaks out of a recent high/low but then quickly reverses. These are often seen as market traps, and this indicator aims to highlight them early.
✅ Key Features in the PRO Version
📌 Toggle to display all signals or only the most recent one
💬 Price labels with clean text and optional visibility
📊 Smart summary table for instant signal reference
📈 Auto-extended lines that follow price action
⚡ Lightweight and optimized for speed and real-time responsiveness
🛠 Configurable Settings
False breakout detection period
Signal validity window (how long a signal is considered active)
Smoothing types: Raw (💎), WMA, or HMA
Aggressive mode for early signal generation
Enable or disable:
Price labels
Summary table
Only latest signal mode
⚠️ License Notice
This script is derived from @Zeiierman’s original work and is published under the Creative Commons BY-NC-SA 4.0 license.
🔒 Commercial use is NOT allowed. Attribution to the original author is required.
🇸🇦 False Breakout PRO – أداة متقدمة لكشف الكسر الكاذب
False Breakout PRO هو إصدار مطور من السكريبت الأصلي "False Breakout (Expo)" من تطوير ، وتم تحسينه لتقديم تجربة استخدام أكثر احترافية ومرونة للمستخدمين للكشف عن الكسر الكاذب
🔍 آلية العمل
يقوم السكريبت بمراقبة القمم والقيعان الجديدة بناءً على فترة يتم تحديدها من قبل المستخدم.
ثم يحدد الكسر الكاذب عندما يكسر السعر مستوى مرتفعًا أو منخفضًا ثم يعود بسرعة. هذه الحركة غالبًا ما تكون خداعًا للمضاربين، ويقوم المؤشر بكشفها مبكرًا.
✅ أهم ميزات النسخة PRO
📌 التبديل بين عرض جميع الإشارات أو أحدث إشارة فقط
💬 عرض سعر الإشارة بنص نظيف واختياري
📊 جدول ملخص ذكي لعرض آخر الإشارات بسرعة
📈 تمديد تلقائي للخطوط لمتابعة حركة السعر
⚡ واجهة خفيفة وسريعة ومناسبة للعرض اللحظي
🛠 الإعدادات القابلة للتعديل
فترة تحديد الكسر الكاذب
مدة صلاحية الإشارة
أنواع الفلترة: 💎 خام، WMA، أو HMA
وضع الكشف العدواني (Aggressive)
خيارات العرض:
إظهار أو إخفاء السعر
إظهار أو إخفاء الجدول
عرض آخر إشارة فقط
⚠️ رخصة الاستخدام
تم تطوير هذا السكريبت بالاعتماد على السكريبت الأصلي من @Zeiierman
وهو مرخص بموجب Creative Commons BY-NC-SA 4.0
🔒 الاستخدام التجاري غير مسموح. ويجب نسب الفضل للمطور الأصلي.

Swing Failure Pattern SFP [TradingFinder] SFP ICT Strategy🔵 Introduction
The Swing Failure Pattern (SFP), also referred to as a "Fake Breakout" or "False Breakout," is a vital concept in technical analysis. This pattern is derived from classic technical analysis, price action strategies, ICT concepts, and Smart Money Concepts.
It’s frequently utilized by traders to identify potential trend reversals in financial markets, especially in volatile markets like cryptocurrencies and forex. SFP helps traders recognize failed attempts to breach key support or resistance levels, providing strategic opportunities for trades.
The Swing Failure Pattern (SFP) is a popular strategy among traders used to identify false breakouts and potential trend reversals in the market. This strategy involves spotting moments where the price attempts to break above or below a previous high or low (breakout) but fails to sustain the move, leading to a sharp reversal.
Traders use this strategy to identify liquidity zones where stop orders (stop hunt) are typically placed and targeted by larger market participants or whales.
When the price penetrates these areas but fails to hold the levels, a liquidity sweep occurs, signaling exhaustion in the trend and a potential reversal. This strategy allows traders to enter the market at the right time and capitalize on opportunities created by false breakouts.
🟣 Types of SFP
When analyzing SFPs, two main variations are essential :
Real SFP : This occurs when the price breaks a critical level but fails to close above it, then quickly reverses. Due to its clarity and strong signal, this SFP type is highly reliable for traders.
Considerable SFP : In this scenario, the price closes slightly above a key level but quickly declines. Although significant, it is not as definitive or trustworthy as a Real SFP.
🟣 Understanding SFP
The Swing Failure Pattern, or False Breakout, is identified when the price momentarily breaks a crucial support or resistance level but cannot maintain the movement, leading to a rapid reversal.
The pattern can be categorized as follows :
Bullish SFP : This type occurs when the price dips below a support level but rebounds above it, signaling that sellers failed to push the price lower, indicating a potential upward trend.
Bearish SFP : This pattern forms when the price surpasses a resistance level but fails to hold, suggesting that buyers couldn’t maintain the higher price, leading to a potential decline.
🔵 How to Use
To effectively identify an SFP or Fake Breakout on a price chart, traders should follow these steps :
Identify Key Levels: Locate significant support or resistance levels on the chart.
Observe the Fake Breakout: The price should break the identified level but fail to close beyond it.
Monitor Price Reversal: After the breakout, the price should quickly reverse direction.
Execute the Trade: Traders typically enter the market after confirming the SFP.
🟣 Examples
Bullish Example : Bitcoin breaks below a $30,000 support level, drops to $29,000, but closes above $30,000 by the end of the day, signaling a Real Bullish SFP.
Bearish Example : Ethereum surpasses a $2,000 resistance level, rises to $2,100, but then falls back below $2,000, forming a Bearish SFP.
🟣 Pros and Cons of SFP
Pros :
Effective in identifying strong reversal points.
Offers a favorable risk-to-reward ratio.
Applicable across different timeframes.
Cons :
Requires experience and deep market understanding.
Risk of encountering false breakouts.
Should be combined with other technical tools for optimal effectiveness.
🔵 Settings
🟣 Logical settings
Swing period : You can set the swing detection period.
SFP Type : Choose between "All", "Real" and "Considerable" modes to identify the swing failure pattern.
Max Swing Back Method : It is in two modes "All" and "Custom". If it is in "All" mode, it will check all swings, and if it is in "Custom" mode, it will check the swings to the extent you determine.
Max Swing Back : You can set the number of swings that will go back for checking.
🟣 Display settings
Displaying or not displaying swings and setting the color of labels and lines.
🟣 Alert Settings
Alert SFP : Enables alerts for Swing Failure Pattern.
Message Frequency : Determines the frequency of alerts. Options include 'All' (every function call), 'Once Per Bar' (first call within the bar), and 'Once Per Bar Close' (final script execution of the real-time bar). Default is 'Once per Bar'.
Show Alert Time by Time Zone : Configures the time zone for alert messages. Default is 'UTC'.
🔵 Conclusion
The Swing Failure Pattern (SFP), or False Breakout, is an essential analytical tool that assists traders in identifying key market reversal points for successful trading.
By understanding the nuances between Real SFP and Considerable SFP, and integrating this pattern with other technical analysis tools, traders can make more informed decisions and better manage their trading risks.

False Breakouts [TradingFinder] Fake Breakouts Failure🔵 Introduction
Technical indicators are essential tools for analysts and traders in financial markets, helping them predict price movements and make better trading decisions. One of the key concepts in technical analysis that should be carefully considered is the "False Breakout."
This phenomenon occurs when a price temporarily breaks through a significant support or resistance level but fails to hold and quickly returns to its previous range. Understanding this concept and applying it in trading can reduce risks and increase profitability.
🟣 What is a False Breakout?
A Fake Breakout, as the name suggests, refers to a breakout that appears to occur but fails to sustain, leading the price to quickly revert back to its previous range. This situation often happens when inexperienced or non-professional traders, under psychological pressure and eager to enter the market quickly, initiate trades.
This creates opportunities for professional traders to take advantage of these short-term fluctuations and execute successful trades.
🟣 The Importance of Recognizing False Breakouts
Recognizing False Breakouts is crucial for any trader aiming for success in financial markets. False Breakouts typically occur when the market approaches a critical support or resistance level.
In these situations, many traders are waiting to see if the price will break through this level. However, when the price quickly returns to its previous range, it indicates weakness in the movement and the inability to sustain the breakout.
🟣 How to identify False Breakouts?
To identify Fake Breakouts, it is important to carefully analyze price charts and look for signs of a quick price reversal after breaking a key level.
Here are some chart patterns that may help you identify a False Breakout :
1. Pin Bar Pattern : The Pin Bar is a candlestick pattern that indicates a price reversal. This pattern usually appears near support and resistance levels, showing that the price attempted to break through a key level but failed and reversed.
2. Fakey Pattern : This pattern, which consists of several candlesticks, indicates a False Breakout and a quick price return to the previous range. It usually appears near key levels and can signal a trend reversal.
3. Using Multiple Timeframes : One way to identify False Breakouts is by using charts of different timeframes. Sometimes, a breakout on a one-hour chart may be a False Breakout on a daily chart. Analyzing charts across multiple timeframes can help you accurately identify this phenomenon.
🔵 How to Use
Once you identify a False Breakout, you can use it as a trading signal. For this, it is best to look for trading opportunities in the opposite direction of the False Breakout. In other words, if a False Breakout occurs at a resistance level, you might consider selling opportunities, and if it happens at a support level, you might look for buying opportunities.
Here are some key points for trading based on False Breakouts :
1. Patience and Discipline : Patience and discipline are crucial when trading with False Breakouts. Wait for the False Breakout to clearly form before entering a trade.
2. Use Stop Loss : Setting an appropriate stop loss is vital when trading based on False Breakouts. Typically, the stop loss can be placed near the level where the False Breakout occurred.
3. Seek Confirmations : Before entering a trade, look for additional confirmations. These can include other analyses or technical indicators that show the price is likely to return to its previous level.
🔵 Settings
🟣 Logical settings
Swing period : You can set the swing detection period.
Max Swing Back Method : It is in two modes "All" and "Custom". If it is in "All" mode, it will check all swings, and if it is in "Custom" mode, it will check the swings to the extent you determine.
Max Swing Bac k: You can set the number of swings that will go back for checking.
🟣 Display settings
Displaying or not displaying swings and setting the color of labels and lines.
🟣 Alert Settings
Alert False Breakout : Enables alerts for Breakout.
Message Frequency : Determines the frequency of alerts. Options include 'All' (every function call), 'Once Per Bar' (first call within the bar), and 'Once Per Bar Close' (final script execution of the real-time bar). Default is 'Once per Bar'.
Show Alert Time by Time Zone : Configures the time zone for alert messages. Default is 'UTC'.
🔵Conclusion
False Breakouts, as a key concept in technical analysis, are powerful tools for identifying sudden price changes and using them in trading. Understanding this phenomenon and applying it can help traders perform better in financial markets and avoid potential losses.
To benefit from False Breakouts, traders need to carefully analyze charts and use the appropriate analytical tools. By leveraging this strategy, traders can achieve lower-risk and higher-reward trades.

Wunder False Breakout1. The basic concept for this strategy is to use false breakout logic based on price levels.
2. We will enter a trade when the price exhibits a false breakout, where it initially breaks a level but then reverses direction.
3. The main concept of this strategy is to capitalize on false breakouts of price levels. The strategy involves building levels based on the highs and lows over a certain period. When these price levels appear to break out but then reverse, we use these false breakouts as entry points. You can adjust the period to find setups that suit your trading pair and timeframe.
4. A function for calculating risk on the portfolio (your deposit) has been added to the Wunder False Breakout. When this option is enabled, you get a calculation of the entry amount in dollars relative to your Stop Loss. In the settings, you can select the risk percentage on your portfolio. The loss will be calculated from the amount that will be displayed on the chart.
5. For example, if your deposit is $1000 and you set the risk to 1%, with a Stop Loss of 5%, the entry volume will be $200. The loss at SL will be $10. 10$, which is your 1% risk or 1% of the deposit.
Important! The risk per trade must be less than the Stop Loss value. If the risk is greater than SL, then you should use leverage.
The amount of funds entering the trade is calculated in dollars. This option was created if you want to send the dollar amount from Tradingview to the exchange. However, putting your volume in dollars you get the incorrect net profit and drawdown indication in the backtest results, as TradingView calculates the backtest volume in contracts.
To display the correct net profit and drawdown values in Tradingview Backtest results, use the ”Volume in contract” option.

Breakout Detector (Previous MTF High Low Levels) [LuxAlgo]The Breakout Detector (Previous MTF High Low Levels) indicator highlights breakouts of previous high/low levels from a higher timeframe.
The indicator is able to: display take-profit/stop-loss levels based on a user selected Win/Loss ratio, detect false breakouts, and display a dashboard with various useful statistics.
Do note that previous high/low levels are subject to backpainting, that is they are drawn retrospectively in their corresponding location. Other elements in the script are not subject to backpainting.
🔶 USAGE
Breakouts occur when the price closes above a previous Higher Timeframe (HTF) High or below a previous HTF Low.
On the advent of a breakout, the closing price acts as an entry level at which a Take Profit (TP) and Stop Loss (SL) are placed. When a TP or SL level is reached, the SL/TP box border is highlighted.
When there is a breakout in the opposite direction of an active breakout, previous breakout levels stop being updated. Not reaching an SL/TP level will result in a partial loss/win,
which will result in the box being highlighted with a dotted border (default). This can also be set as a dashed or solid border.
Detection of False Breakouts (default on) can be helpful to avoid false positives, these can also be indicative of potential trend reversals.
This indicator contains visualization when a new HTF interval begins (thick vertical grey line) and a dashboard for reviewing the breakout results (both defaults enabled; and can be disabled).
As seen in the example above, the active, open breakout is colored green/red.
You can enable the setting ' Cancel TP/SL at the end of HTF ', which will stop updating previous TP/SL levels on the occurrence of a new HTF interval.
🔶 DETAILS
🔹 Principles
Every time a new timeframe period starts, the previous high and low are detected of the higher timeframe. On that bar only there won't be a breakout detection.
A breakout is confirmed when the close price breaks the previous HTF high/low
A breakout in the same direction as the active breakout is ignored.
A breakout in the opposite direction stops previous breakout levels from being updated.
Take Profit/Stop Loss, partially or not, will be highlighted in an easily interpretable manner.
🔹 Set Higher Timeframe
There are 2 options for choosing a higher timeframe:
• Choose a specific higher timeframe (in this example, Weekly higher TF on a 4h chart)
• Choose a multiple of the current timeframe (in this example, 75 minutes TF on a 15 min chart - 15 x 5)
Do mind, that when using this option, non-standard TFs can give less desired timeframe changes.
🔹 Setting Win/Loss Levels
The Stop Loss (SL) / Take Profit (TP) setting has 2 options:
W%:L% : A fixed percentage is chosen, for TP and SL.
W:L : In this case L (Loss-part) is set through Loss Settings , W (Win-part) is calculated by multiplying L , for example W : L = 2 : 1, W will be twice as large as the L .
🔹 Loss Settings
The last drawing at the right is still active (colored green/red)
The Loss part can be:
A multiple of the Average True Range (ATR) of the last 200 bars.
A multiple of the Range Cumulative Mean (RCM).
The Latest Swing (with Length setting)
Range Cumulative Mean is the sum of the Candle Range (high - low) divided by its bar index.
🔹 False Breakouts
A False Breakout is confirmed when the price of the bar immediately after the breakout bar returns above/below the breakout level.
🔹 Dashboard
🔶 ALERTS
This publication provides several alerts
Bullish/Bearish Breakout: A new Breakout.
Bullish/Bearish False Breakout: False Breakout detected, 1 bar after the Breakout.
Bullish/Bearish TP: When the TP/profit level has been reached.
Bullish/Bearish Fail: When the SL/stop-loss level has been reached.
Note that when a new Breakout causes the previous Breakout to stop being updated, only an alert is provided of the new Breakout.
🔶 SETTINGS
🔹 Set Higher Timeframe
Option : HTF/Mult
HTF : When HTF is chosen as Option , set the Higher Timeframe (higher than current TF)
Mult : When Mult is chosen as Option , set the multiple of current TF (for example 3, curr. TF 15min -> 45min)
🔹 Set Win/Loss Level
SL/TP : W:L or W%:L%: Set the Win/Loss Ratio (Take Profit/Stop Loss)
• W : L : Set the Ratio of Win (TP) against Loss (SL) . The L level is set at Loss Settings
• W% : L% : Set a fixed percentage of breakout price as SL/TP
🔹 Loss Settings
When W : L is chosen as SL/TP Option, this sets the Loss part (L)
Base :
• RCM : Range Cumulative Mean
• ATR : Average True Range of last 200 bars
• Last Swing : Last Swing Low when bullish breakout, last Swing High when bearish breakout
Multiple : x times RCM/ATR
Swing Length : Sets the 'left' period ('right' period is always 1)
Colours : colour of TP/SL box and border
Borders : Style border when breakout levels stop being updated, but TP/SL is not reached. (Default dotted dot , other option is dashed dsh or solid sol )
🔹 Extra
Show Timeframe Change : Show a grey vertical line when a new Higher Timeframe interval begins
Detect False Outbreak
Cancel TP/SL at end of HTF
🔹 Show Dashboard
Location: Location of the dashboard (Top Right or Bottom Right/Left)
Size: Text size (Tiny, Small, Normal)
See USAGE/DETAILS for more information

TouchedLibrary "Touched"
Breakout(zone, lookback)
Tells if the zone has been broken on the current bar.
Parameters:
zone (Zone) : The definitiin of the zone.
lookback (int) : How many bars to look back.
Returns: a Touch object that tells if the zone has been broken up or down.
FalseBreakout(zone, lookback)
Tells if the zone has a false breakout on the current bar.
Parameters:
zone (Zone) : The definitiin of the zone.
lookback (int) : How many bars to look back.
Returns: a Touch object that tells if the zone has had a false breakout up or down.
Retest(zone, lookback)
Tells if the zone has been retested on the current bar.
Parameters:
zone (Zone) : The definitiin of the zone.
lookback (int) : How many bars to look back.
Returns: a Touch object that tells if the zone has been retested up or down.
Zone
Fields:
High (series__float)
Low (series__float)
BaseTime (series__integer)
Touch
Fields:
Up (series__bool)
Down (series__bool)

Turtle Soup IndicatorTurtle Soup Indicator plots a shape when we have a 20-period high or 20-period low.
Turtle Soup Setup
The Turtle Soup setup was published in the book Street Smarts by Laurence A Connors and Linda Raschke. You can learn about it there. It is a great setup for false breakouts or breakdowns in the group failure tests.
Going long
1) We have a new 20-period low
2) that must have occured at least four trading sessions earlier <- this is very important
Then we place a buy stop above 5-10 ticks or 5 to 10 cents above the previous 20-period low.
If filled immediately place a good til cancelled sell stop one tick or one cent below todays low.
Turtle Soup Plus One
Similar to above but occurs one day later. It should close at/below previous 20-period low.
Buy stop at earlier 20 day low. Cancel fi not filled on day 2.
Take partials within 2-6 bars on this one and trail stop rest of position.
Going short
Reverse
Time frames
Works on all timeframes. Only adjust stoplosses accordingly to chosen timeframe.
Settings
You can change the color, shape and placement of the indicator shape. I actually prefer a grey color for both highs and lows as the color actually doesn't add much information. The placement says it all but it is up to you to change this as you like.

2B Reversal Pattern (Expo)█ Overview
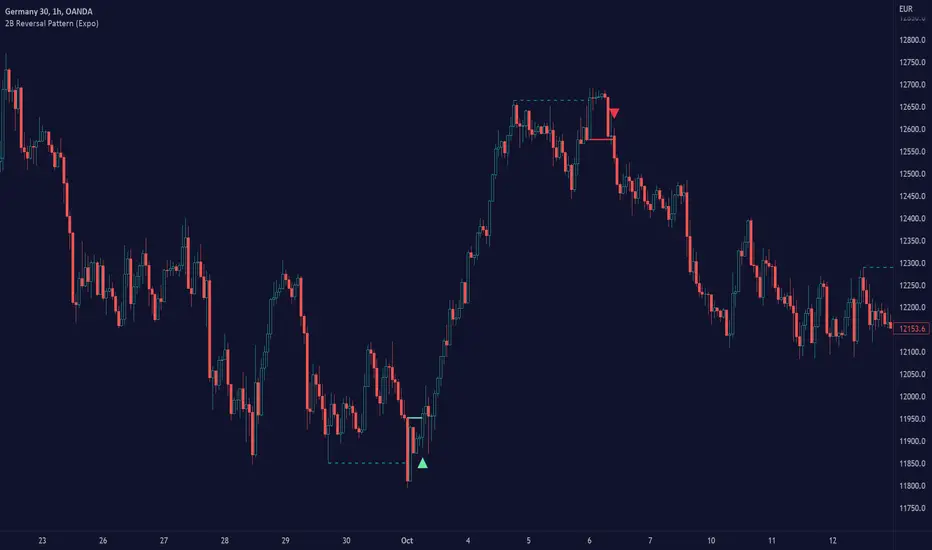
The 2B reversal pattern , also called the "spring pattern", is a popular chart pattern professional traders use to identify potential trend reversals. It occurs when the price appears to be breaking down or up and then suddenly bounces back up/down, forming a "spring" or "false breakout" pattern. This pattern indicates that the trend is losing momentum and that a reversal is coming.
In a bearish market , the "spring pattern" occurs when the price of an asset breaks below a support level, causing many traders to sell their positions and causing the price to drop even further. However, the selling pressure eases at some point, and the price begins to rebound, "springing" back above the support level. This rebound creates a long opportunity for traders who can enter the market at a lower price.
In a bullish market , the "spring pattern" occurs when the price of an asset breaks above a resistance level, causing many traders to buy into the asset and drive the price up even further. However, the buying pressure eases at some point, and the price begins to decline, "springing" below the resistance level. This decline creates a selling opportunity for traders who can short the market at a higher price.
█ What are the benefits of using the 2B Reversal Pattern?
The benefits of using the 2B Reversal pattern as a trader include identifying potential buying or selling opportunities with reduced risk. By waiting for the price to "spring back" to the initial breakout level, traders can avoid entering the market too soon and minimize the risk of potential losses.
█ How to use
Traders can use the 2B reversal pattern to identify reversals. If the pattern occurs after an uptrend, traders may sell their long positions or enter a short position, anticipating a reversal to a downtrend. If the pattern occurs after a downtrend, traders may sell their short positions or enter a long position, anticipating a reversal to an uptrend.
█ Consolidation Strategy
First, traders should identify a period of price consolidation or a trading range where the price has been trading sideways for some time. The key feature of the "spring pattern" is a sudden, sharp move downward/upwards through the lower/upper boundary of this trading range, often accompanied by high volume.
However, instead of continuing to move lower/higher, the price then quickly recovers and moves back into the trading range, often on low volume. This quick recovery is the "spring" part of the pattern and suggests that the market has rejected the lower/higher price and that buying/selling pressure is building.
Traders may use the "spring pattern" as a signal to buy/sell the asset, suggesting strong demand/supply for the stock at the lower/higher price level. However, as with all trading strategies, it is important to use other indicators and to manage risk to minimize potential losses carefully.
-----------------
Disclaimer
The information contained in my Scripts/Indicators/Ideas/Algos/Systems does not constitute financial advice or a solicitation to buy or sell any securities of any type. I will not accept liability for any loss or damage, including without limitation any loss of profit, which may arise directly or indirectly from the use of or reliance on such information.
All investments involve risk, and the past performance of a security, industry, sector, market, financial product, trading strategy, backtest, or individual's trading does not guarantee future results or returns. Investors are fully responsible for any investment decisions they make. Such decisions should be based solely on an evaluation of their financial circumstances, investment objectives, risk tolerance, and liquidity needs.
My Scripts/Indicators/Ideas/Algos/Systems are only for educational purposes!
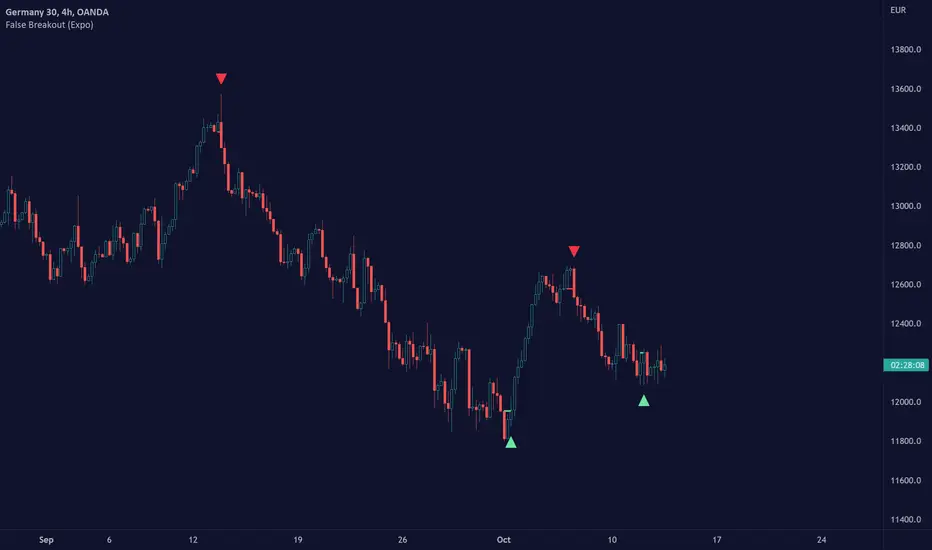
False Breakout (Expo)█ Overview
False Breakout (Expo) is an indicator that detects false breakouts in real-time. A false breakout occurs when the price moves through a certain level but doesn't continue to accelerate in that direction. This is because the price does not have enough momentum and the buying interest at this level is not high enough to keep pushing the price in that direction. Instead, the market reverses! All breakout traders are now forced to close their positions at a loss. However, contrarian traders that have identified this false breakout do get a perfect entry for a great reversal trade!
False Breakout is one of the most important price action trading patterns to learn because it can help traders understand whether a breakout is valid or false.
█ How to use
Identify False Breakouts
Identify Reversal trades
-----------------
Disclaimer
The information contained in my Scripts/Indicators/Ideas/Algos/Systems does not constitute financial advice or a solicitation to buy or sell any securities of any type. I will not accept liability for any loss or damage, including without limitation any loss of profit, which may arise directly or indirectly from the use of or reliance on such information.
All investments involve risk, and the past performance of a security, industry, sector, market, financial product, trading strategy, backtest, or individual's trading does not guarantee future results or returns. Investors are fully responsible for any investment decisions they make. Such decisions should be based solely on an evaluation of their financial circumstances, investment objectives, risk tolerance, and liquidity needs.
My Scripts/Indicators/Ideas/Algos/Systems are only for educational purposes!
Volume Status by BobRivera990This indicator is a tool that shows a relative view of the trading volume and classifies the volume into 5 different levels and makes it easy to compare it in different periods.
It is also specifically designed for detecting failed (fake) breakouts.
How it works?
This tool uses something similar to Bollinger Bands , but with more bands.
I used two standard deviations (positive and negative) on either side of a simple moving average ( SMA ) of the trading volume .
I also used twice the standard deviation (negative and positive) on either side of the SMA to create more bands.
The classification is made as follows:
Usage:
This indicator is a tool to compare the volume , relatively and in different periods. It is also a good tool for detecting failed (fake) breakouts.
Fake Breakouts Occurs when a support or resistance is broken but the market does not accept and support these price changes. This lack of support will cause trading volume to decrease during or after the breakout.
So, if the indicator shows Low-Volume or Minor-Volume status at the time of the breakout or right after that, it may be a fake breakout.
The truth is you cannot avoid false breakouts completely as long as you trade breakouts but you can minimize the risk and the loss.
Thank you all for forming this unique community.
Parameters:
" Volume SMA Length " => The length of the simple moving average of the Volume

stop out or margin call price levelsAbstract
This script finds the potential stop out or margin call price levels without considering timeframe.
This script computes stop out or margin call price levels that over leveraged positions buy cheap enough.
You can use this indicator to follow stop hunters.
Introduction
Stop hunting exists because of benefit conflict.
When most of retails traders are in the correct direction, big banks do not want to buy more expensive then retail traders.
Therefore, Big banks create sell pressure to make retail traders misunderstand their trade decisions are wrong.
When retail traders decide to cut loss, it is time big banks buy cheaper.
Many courses recommend average true range as a stop loss reference.
However, in different timeframe, average true ranges are different.
Therefore, we need to have a method to measure potential stop hunting levels which is not relative to timeframe.
There is a method because there are observable levels where over leveraged positions must cut loss.
For example, for a 100 leverage position, its margin call level is 0.005, so 0.005 drawdown is a potential stop hunting level.
Computing
For buy
potential stop out or margin call price level = low * ( 1 - ratio )
For sell
potential stop out or margin call price level = high * ( 1 + ratio )
Parameters
There are 4 levels available for adjusting.
The default values are :
(1) 0.001 : 500 leverage , 50% margin call
(2) 0.0025 : 200 leverage , 50% margin call
(3) 0.005 : 100 leverage , 50% margin call
(4) 0.010 : 50 leverage , 50% margin call
Usage
(1) Find an oversold price level. If you don't want to use an another indicator, you can use previous low.
(2) Memorize their stop out or margin call price levels of that level.
(2) Consider buy near those levels.
(3) If there are quick price rejection near those levels, better entry opportunities.
(4) Take profit and stop loss : you decide.
Conclusion
This script can find potential stop out or margin call price levels that over leveraged positions buy cheap enough.
If you are bored, you can consider find 100 signals you are interested in and share your observation.
Reference
Brokers, leverage and margin call threshold
False BreakoutA false breakout is when the price temporarily moves above or below a key support or resistance level, but then later retreats back to the same side as it started.
The “False Breakout” indicator reveals false breakouts in comparison to the previous candle.
In case we're looking to trade the stock for long this would mean that the price of the stock broke the previous low (support) and then got back above that low.
In case we're looking to trade the stock for short then a false breakout would mean the stock broke the previous high (resistance) and then got back below that high.
How to use the indicator?
First choose the direction you're looking to trade, meaning either long or short.
Then choose how strict you want to be about the Falls brakes.
There are three options:
The first option named “All“ means that it's enough that the stock broke the previous level and then get back to the original side.
The second option is “Supporting Change” meaning not only that the stock broke the previous key level (support or resistance), but also the change at the end of the candle is supporting the main direction - meaning the change is positive for long or negative for short.
The third option is “Engulfing”. This is a well-known candle, but to make it clear, in our case “Engulfing” means that not only the stock broke the previous level but it also ended the day on the other side of the candle - higher than the previous high, in case of long, and lower than the previous low, in case of short.
When you choose the level of strictness you determine how many indications you're going to get on the chart.
If you choose the highest level of strictness, meaning “Engulfing”, you would only see the red flags indicating engulfing candles.
If you choose the lowest level of strictness, meaning “All”, you will get more indications on your chart, including every false breakout.
When the direction you're looking for is long, all indications would appear below the candles.
When the direction you're looking for is short, then all indications would appear above the candles.
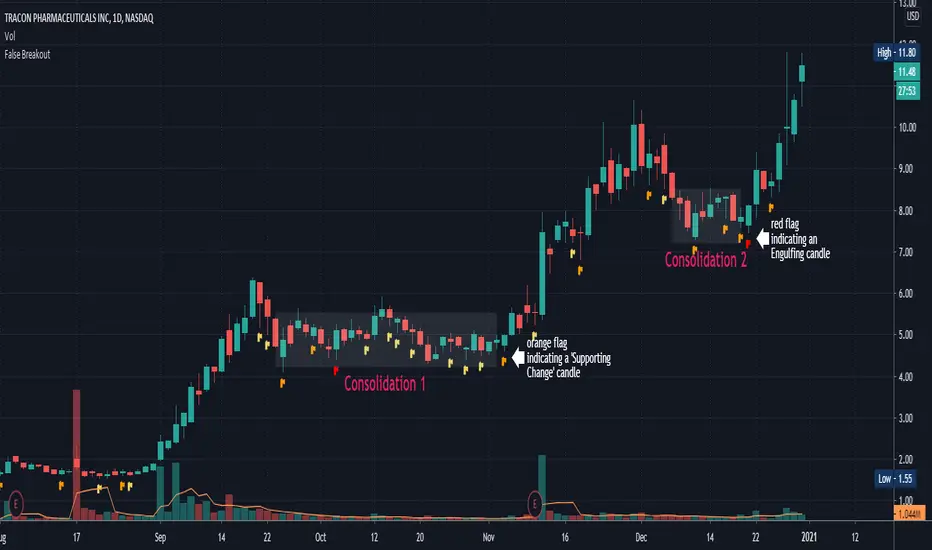
The Engulfing candles are represented by Red flags, and the Simple breakouts candles are represented by yellow. All colors may be adjusted to your preference.
Explaining the example above:
In the chart above we can see two consolidations. At the end of each consolidation, we can see a candle with an indication from the indicator that points out that this could be the end of the consolidation and the stock might continue its move.
In “consolidation 1” we can see that there is an orange flag below the candle right before the stock began to move up again.
In “consolidation 2” we can see that there is a red flag below the candle, right before the stock began another move.
Wishing you all the best :)
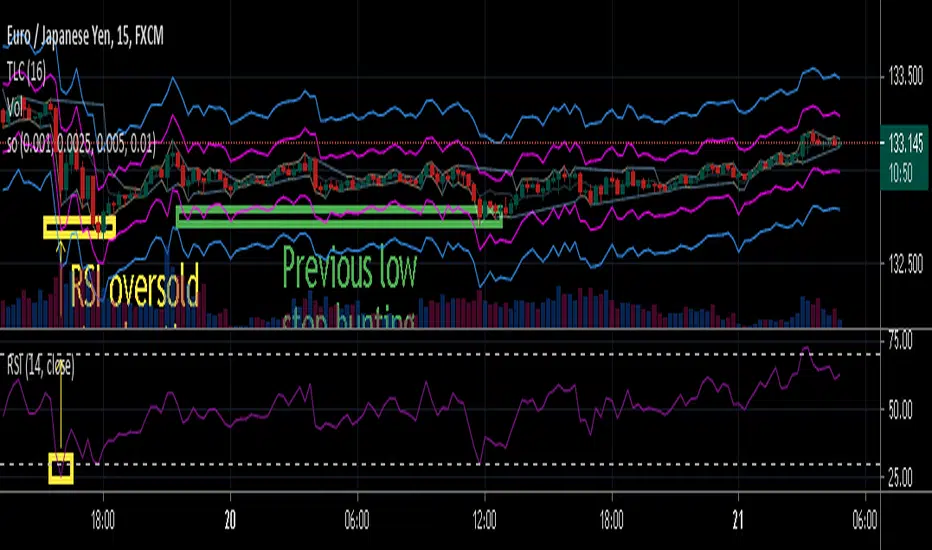
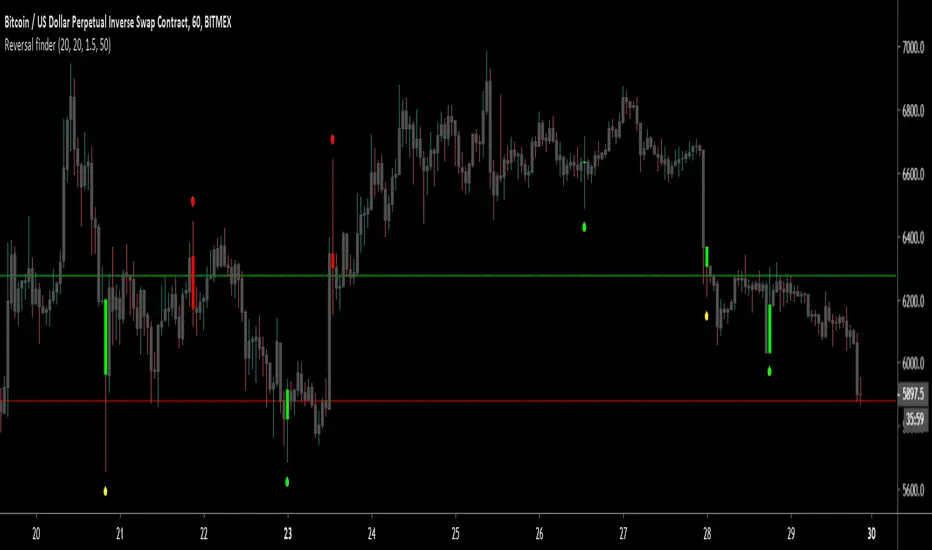
Reversal finderThis script is used to visually highlight candles which may signal a reversal following a false break of a support or resistance level.
Inputs are:
Lookback period: look for the highest high and the lowest low of the prior x bars.
SMA length: used for a simple moving average of the range (high minus low) of the prior x bars.
Range multiple: used to filter out signals for any bars with a range smaller than the average range of the preceding bars (determined by SMA length above) e.g. a range multiple of 2 will only show signals for bars with a range twice of that of the average range of the preceding bars.
Range threshold: used to filter signals for bars both the open and close of the bar are at the extreme end of the bar e.g. a threshold setting of 33% will only show buy signals for bars which open and close within the upper 1/3rd of the bar’s high/low range (vice versa for sell signals). This helps highlight, for example, bars with a high which exceeds resistance in a current range but which close back inside the range.
Highlight signal bars?: This will highlight bars with a buy signal in green, sell signal bars in red, and all other bars in grey. The script was designed for use with a dark background, so you will need to play around with the bar colours in the style settings to suit your preferences.
Settings used in the example chart are not the default – they are lookback: 5, SMA length: 20, range multiple: 1.2, range threshold: 33%.
Enjoy!
Trading Range ExpansionThis script is trading for the false breakout of the trading range. Once the price makes a break out and get rejected back into the range. The signal triggered for the opposite direction.
