Daily/Weekly FVG by KrisThis indicator is a Multi-Timeframe (MTF) tool designed to automatically identify and project Fair Value Gaps (Imbalances) from Daily and Weekly timeframes onto your current chart. It helps traders locate higher-timeframe Areas of Interest (POI) and liquidity voids without manually switching charts.
How it works:
The script utilizes `request.security` to fetch High and Low data from Daily and Weekly timeframes. It identifies a Fair Value Gap (FVG) based on the 3-candle formation logic where price moves inefficiently, leaving a gap between the wicks.
- Bullish FVG: Identified when the current Daily/Weekly Low is greater than the High of the candle from 2 periods ago.
- Bearish FVG: Identified when the current Daily/Weekly High is lower than the Low of the candle from 2 periods ago.
The indicator draws a box extending to the right to visualize the zone, along with a dotted midline which often acts as a sensitive support/resistance level.
Unique Feature: Smart Mitigation (Auto-Hide)
To keep your chart clean and focused on relevant data, the script includes a "Full Fill" logic. It continuously monitors price action relative to existing FVG boxes.
- If price completely crosses through a box (fully fills the gap), the indicator considers it "mitigated" and automatically hides the box and its midline (sets transparency to 100%).
- This ensures you only see "fresh" or unfilled gaps that are still relevant for trading.
Settings:
- TF Checkboxes (Daily/Weekly FVG): Toggle the visibility of Daily or Weekly gaps independently based on your analysis needs.
- Design Mode:
Colored: Uses classic Green (Bullish) and Red (Bearish) colors for easy trend identification.
Monochrome: Uses Gray tones for a minimalist look that reduces visual noise on the chart.
Usage:
Use these zones to identify potential reversal points or liquidity targets. Since these are higher-timeframe levels, they often carry more weight than intraday imbalances.
Fair

FAIRPRICE_VWAP_RDFAIRPRICE_VWAP_RD
This script plots an **anchored VWAP (Volume Weighted Average Price)** that resets
based on the user-selected anchor period. It acts as a dynamic “fair value” line
that reflects where the market has actually transacted during the chosen period.
FEATURES
- Multiple anchor options: Session, Week, Month, Quarter, Year, Decade, Century,
Earnings, Dividends, or Splits.
- Intelligent handling of the “Session” anchor so it works correctly on both 1m
(resets each new day) and 1D (continuous, non-resetting VWAP).
- Manual VWAP calculation using cumulative(price * volume) and cumulative(volume),
ensuring the line is stable and works on all timeframes.
- Optional hiding of VWAP on daily or higher charts.
- Offset input for horizontal shifting if desired.
- VWAP provides a true “fair price” reference for trend, mean-reversion,
and institutional-level analysis.
PURPOSE
This indicator solves the common problem of VWAP behaving incorrectly on higher
timeframes, on synthetic data, or with unusual anchors. By implementing VWAP
manually and allowing flexible reset conditions, it functions reliably as
an institutional-style fair value benchmark across any timeframe.

ICT Fair Value Gap (FVG) Detector │ Auto-Mitigated │ 2025Accurate ICT / Smart Money Concepts Fair Value Gap (FVG) detector
Features:
• Detects both Bullish (-FVG) and Bearish (+FVG) using strict 3-candle rule
• Boxes automatically extend right until price mitigates them
• Boxes auto-delete when price closes inside the gap (true mitigation)
• No repainting – 100% reliable
• Clean, lightweight, and works on all markets & timeframes
• Fully customizable colors and transparency
How to use:
– Bullish FVG (green) = potential support / buy zone in uptrend
– Bearish FVG (red) = potential resistance / sell zone in downtrend
Exactly matches The Inner Circle Trader (ICT) methodology used by thousands of SMC traders in 2024–2025.
Enjoy and trade safe!

FVG Volume Profile [ChartPrime]⯁ OVERVIEW
FVG Volume Profile is a smart volume analysis tool that identifies Fair Value Gaps (FVGs) and overlays a volume profile inside each gap using data from lower timeframes. The indicator automatically selects the best time resolution or allows for manual control, giving traders deeper insight into the volume structure within each imbalance. POC levels and total volumes gives a full microstructure view inside every FVG.
⯁ KEY FEATURES
Fair Value Gap Detection (Bullish & Bearish)
Detects price gaps where inefficiency exists using a 3-bar structure.
-Bullish Gaps: Low > High with confirming middle bar.
-Bearish Gaps: High < Low with confirming middle bar.
Only significant gaps (filtered by standard deviation) are plotted to avoid noise.
Multi-Timeframe Volume Profiling
Pulls granular candle and volume data from a lower timeframe —
In Auto Mode, uses a resolution ~10x lower than the current chart.
In Manual Mode, lets the user select a custom timeframe.
This ensures accurate intra-gap volume distribution.
Dynamic Volume Binning
Each FVG is divided into vertical volume bins based on the Resolution input.
Each bin displays relative volume intensity as a horizontal box, scaled by percentage of the max bin volume.
Point of Control (PoC) Line & Label
The bin with the maximum volume inside each FVG is marked with:
A horizontal line (PoC) extending from the left to right side.
A label showing the absolute volume of that bin.
Color-coded to match bullish or bearish FVGs.
Total Volume Label Inside FVG
Each FVG displays the total volume sum from its profile:
For bullish FVGs , shown in the bottom-right corner.
For bearish FVGs , shown in the top-right corner.
Auto-Removal of Invalid Gaps
If price fully closes the gap (crosses its bounds), the FVG, profile, and PoC are deleted automatically.
This keeps the chart clean and focused only on active zones.
Toggleable Volume Profile Display
User can show or hide the volume profiles within FVGs using the "Display" toggle under the "FVG Volume Profile" group.
Only the PoC and FVG boxes remain visible if toggled off.
Volume Resolution Customization
Control the number of bins used for each FVG profile.
Higher resolution = more bins and finer volume analysis. (default 15)
Auto Timeframe Validation Warning
If the selected lower timeframe isn’t actually lower than the chart's, the script shows a visible warning label prompting adjustment.
Helps prevent calculation errors.
⯁ USAGE
Use this tool to identify active imbalance zones (FVGs) with embedded volume context.
Look for PoC positioning inside gaps — near top may indicate absorption or reversal zones.
Combine with price action at the PoC level for precision entries.
Hide volume profile for a cleaner view while retaining key POC and FVG boxes.
Use resolution controls to zoom into fine-grained profiles inside large gaps.
Consider Auto mode for seamless multi-timeframe analysis, or switch to Manual for full control.
⯁ CONCLUSION
FVG Volume Profile transforms raw imbalance detection into actionable insight by embedding lower-timeframe volume structure inside each Fair Value Gap. With PoC highlights, total volume labels, and customizable bin resolution, this indicator is essential for traders who want to understand not just where the gap is — but what volume did inside it .

Inversion Fair Value Gap Signals [AlgoAlpha]🟠 OVERVIEW
This script is a custom signal tool called Inversion Fair Value Gap Signals (IFVG) , designed to detect, track, and visualize fair value gaps (FVGs) and their inversions directly on price charts. It identifies bullish and bearish imbalances, monitors when these zones are mitigated or rejected, and extends them until resolution or expiration. What makes this script original is the inclusion of inversion logic—when a gap is filled, the area flips into an opposite "inversion fair value gap," creating potential reversal or continuation zones that give traders additional context beyond classic FVG analysis.
🟠 CONCEPTS
The script builds on the Smart Money Concepts (SMC) principle of fair value gaps, where inefficiencies form when price moves too quickly in one direction. Detection requires a three-bar sequence: a strong up or down move that leaves untraded price between bar highs and lows. To refine reliability, the script adds an ATR-based size filter and prevents overlap between zones. Once created, gaps are tracked in arrays until mitigation (price closing back into the gap), expiration, or transformation into an inversion zone. Inversions act as polarity flips, where bullish gaps become bearish resistance and bearish gaps become bullish support. Lower-timeframe volume data is also displayed inside zones to highlight whether buying or selling pressure dominated during gap creation.
🟠 FEATURES
Automatic detection of bullish and bearish FVGs with ATR-based thresholding.
Inversion logic: mitigated gaps flip into opposite-colored IFVG zones.
Volume text overlay inside each zone showing up vs down volume.
Visual markers (△/▽ for FVG, ▲/▼ for IFVG) when price exits a zone without mitigation.
🟠 USAGE
Apply the indicator to any chart and enable/disable bullish or bearish FVG detection depending on your focus. Use the colored gap zones as areas of interest: bullish gaps suggest possible continuation to the upside until mitigated, while bearish gaps suggest continuation down. When a gap flips into an inversion zone, treat it as potential support/resistance—bullish IFVGs below price may act as demand, while bearish IFVGs above price may act as supply. Watch the embedded up/down volume data to gauge the strength of participants during gap formation. Use the △/▽ and ▲/▼ markers to spot when price rejects gaps or inversions without filling them, which can indicate strong trending momentum. For practical use, combine alerts with your trade plan to track when new gaps form, when old ones are resolved, or when key zones flip into inversions, helping you align entries, targets, or reversals with institutional order flow logic.

Volumatic Fair Value Gaps [BigBeluga]🔵 OVERVIEW
The Volumatic Fair Value Gaps indicator detects and plots size-filtered Fair Value Gaps (FVGs) and immediately analyzes the bullish vs. bearish volume composition inside each gap. When an FVG forms, the tool samples volume from a 10× lower timeframe , splits it into Buy and Sell components, and overlays two compact bars whose percentages always sum to 100%. Each gap also shows its total traded volume . A live dashboard (top-right) summarizes how many bullish and bearish FVGs are currently active and their cumulative volumes—offering a quick read on directional participation and trend pressure.
🔵 CONCEPTS
FVGs (Fair Value Gaps) : Imbalance zones between three consecutive candles where price “skips” trading. The script plots bullish and bearish gaps and extends them until mitigated.
Size Filtering : Only significant gaps (by relative size percentile) are drawn, reducing noise and emphasizing meaningful imbalances.
// Gap Filters
float diff = close > open ? (low - high ) / low * 100 : (low - high) / high *100
float sizeFVG = diff / ta.percentile_nearest_rank(diff, 1000, 100) * 100
bool filterFVG = sizeFVG > 15
Volume Decomposition : For each FVG, the indicator inspects a 10× lower timeframe and aggregates volume of bullish vs. bearish candles inside the gap’s span.
100% Split Bars : Two inline bars per FVG display the % Bull and % Bear shares; their total is always 100%.
Total Gap Volume : A numeric label at the right edge of the FVG shows the total traded volume associated with that gap.
Mitigation Logic : Gaps are removed when price closes through (or touches via high/low—user-selectable) the opposite boundary.
Dashboard Summary : Counts and sums the active bullish/bearish FVGs and their total volumes to gauge directional dominance.
🔵 FEATURES
Bullish & Bearish FVG plotting with independent color controls and visibility toggles.
Adaptive size filter (percentile-based) to keep only impactful gaps.
Lower-TF volume sampling at 10× faster resolution for more granular Buy/Sell breakdown.
Per-FVG volume bars : two horizontal bars showing Bull % and Bear % (sum = 100%).
Per-FVG total volume label displayed at the right end of the gap’s body.
Mitigation source option : choose close or high/low for removing/invalidating gaps.
Overlap control : older overlapped gaps are cleaned to avoid clutter.
Auto-extension : active gaps extend right until mitigated.
Dashboard : shows count of bullish/bearish gaps on chart and cumulative volume totals for each side.
Performance safeguards : caps the number of active FVG boxes to maintain responsiveness.
🔵 HOW TO USE
Turn on/off FVG types : Enable Bullish FVG and/or Bearish FVG depending on your focus.
Tune the filter : The script already filters by relative size; if you need fewer (stronger) signals, increase the percentile threshold in code or reduce the number of displayed boxes.
Choose mitigation source :
close — stricter; gap is removed when a closing price crosses the boundary.
high/low — more sensitive; a wick through the boundary mitigates the gap.
Read the per-FVG bars :
A higher Bull % inside a bullish gap suggests constructive demand backing the imbalance.
A higher Bear % inside a bearish gap suggests supply is enforcing the imbalance.
Use total gap volume : Larger totals imply more meaningful interest at that imbalance; confluence with structure/HTF levels increases relevance.
Watch the dashboard : If bullish counts and cumulative volume exceed bearish, market pressure is likely skewed upward (and vice versa). Combine with trend tools or market structure for entries/exits.
Optional: hide volume bars : Disable Volume Bars when you want a cleaner FVG map while keeping total volume labels and the dashboard.
🔵 CONCLUSION
Volumatic Fair Value Gaps blends precise FVG detection with lower-timeframe volume analytics to show not only where imbalances exist but also who powers them. The per-gap Bull/Bear % bars, total volume labels, and the cumulative dashboard together provide a fast, high-signal read on directional participation. Use the tool to prioritize higher-quality gaps, align with trend bias, and time mitigations or continuations with greater confidence.

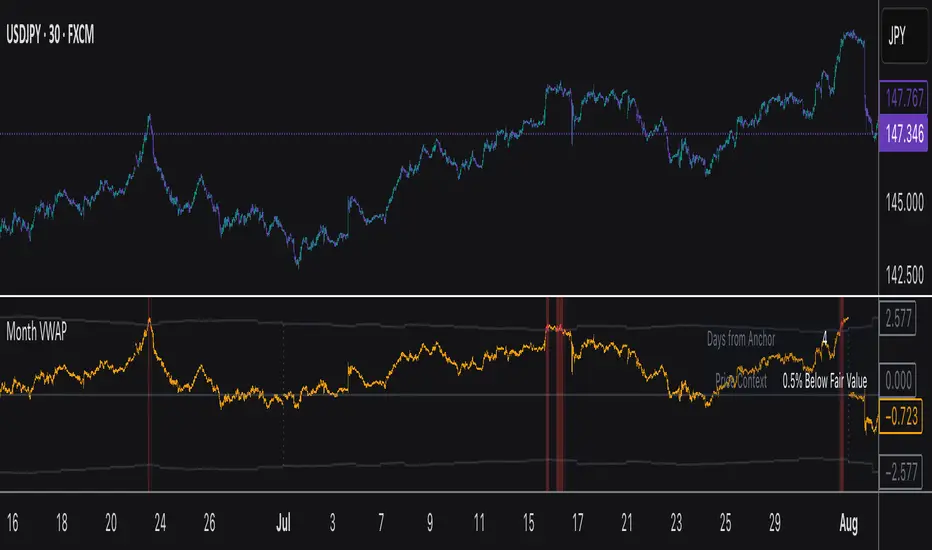
Monthly VWAPDescription
This indicator identifies potential mean reversion opportunities by tracking price deviations from monthly VWAP with dynamic volatility-adjusted thresholds.
Core Logic:
The indicator monitors when price moves significantly away from monthly VWAP and looks for potential reversal opportunities. It uses ATR-based dynamic thresholds that adapt to current market volatility, combined with volume confirmation to filter out weak signals.
Key Features:
Adaptive Thresholds: ATR-based bands that adjust to market volatility
Volume Confirmation: Requires average volume spike to validate signals
Monthly Reset: VWAP anchors reset each month for fresh reference levels
Visual Clarity: Color-coded deviation line with background highlights for active signals
Info Panel: Shows days from anchor and current price context vs fair value
Signal Generation:
Buy Signal: Price below monthly VWAP by threshold amount with elevated volume
Sell Signal: Price above monthly VWAP by threshold amount with elevated volume
Neutral: Price within threshold range or insufficient volume
Best Used For:
Mean reversion strategies in ranging markets
Identifying potential oversold/overbought conditions
Understanding price position relative to monthly fair value
FVG Candle HighlighterThis indicator highlights only the true Fair Value Gap (FVG) creator candle — the middle candle in a 3-bar FVG formation — with zero clutter.
🔹 Bullish FVG: Candle is colored if price gaps above the high two bars back
🔹 Bearish FVG: Candle is colored if price gaps below the low two bars back
✨ No boxes. No zones. Just pure, visual price-action accuracy.
🔧 Powered by Pine Script v6
🧠 Based on institutional-style FVG logic
🎯 Ideal for Smart Money / ICT / Order Block strategies

Time-Based Fair Value Gaps (FVG) with Inversions (iFVG)Overview
The Time-Based Fair Value Gaps (FVG) with Inversions (iFVG) (ICT/SMT) indicator is a specialized tool designed for traders using Inner Circle Trader (ICT) methodologies. Inspired by LuxAlgo's Fair Value Gap indicator, this script introduces significant enhancements by integrating ICT principles, focusing on precise time-based FVG detection, inversion tracking, and retest signals tailored for institutional trading strategies. Unlike LuxAlgo’s general FVG approach, this indicator filters FVGs within customizable 10-minute windows aligned with ICT’s macro timeframes and incorporates ICT-specific concepts like mitigation, liquidity grabs, and session-based gap prioritization.
This tool is optimized for 1–5 minute charts, though probably best for 1 minute charts, identifying bullish and bearish FVGs, tracking their mitigation into inverted FVGs (iFVGs) as key support/resistance zones, and generating retest signals with customizable “Close” or “Wick” confirmation. Features like ATR-based filtering, optional FVG labels, mitigation removal, and session-specific FVG detection (e.g., first FVG in AM/PM sessions) make it a powerful tool for ICT traders.
Originality and Improvements
While inspired by LuxAlgo’s FVG indicator (credit to LuxAlgo for their foundational work), this script significantly extends the original concept by:
1. Time-Based FVG Detection: Unlike LuxAlgo’s continuous FVG identification, this script filters FVGs within user-defined 10-minute windows each hour (:00–:10, :10–:20, etc.), aligning with ICT’s emphasis on specific periods of institutional activity, such as hourly opens/closes or kill zones (e.g., New York 7:00–11:00 AM EST). This ensures FVGs are relevant to high-probability ICT setups.
2. Session-Specific First FVG Option: A unique feature allows traders to display only the first FVG in ICT-defined AM (9:30–10:00 AM EST) or PM (1:30–2:00 PM EST) sessions, reflecting ICT’s focus on initial market imbalances during key liquidity events.
3. ICT-Driven Mitigation and Inversion Logic: The script tracks FVG mitigation (when price closes through a gap) and converts mitigated FVGs into iFVGs, which serve as ICT-style support/resistance zones. This aligns with ICT’s view that mitigated gaps become critical reversal points, unlike LuxAlgo’s simpler gap display.
4. Customizable Retest Signals: Retest signals for iFVGs are configurable for “Close” (conservative, requiring candle body confirmation) or “Wick” (faster, using highs/lows), catering to ICT traders’ need for precise entry timing during liquidity grabs or Judas swings.
5. ATR Filtering and Mitigation Removal: An optional ATR filter ensures only significant FVGs are displayed, reducing noise, while mitigation removal declutters the chart by removing filled gaps, aligning with ICT’s principle that mitigated gaps lose relevance unless inverted.
6. Timezone and Timeframe Safeguards: A timezone offset setting aligns FVG detection with EST for ICT’s New York-centric strategies, and a timeframe warning alerts users to avoid ≥1-hour charts, ensuring accuracy in time-based filtering.
These enhancements make the script a distinct tool that builds on LuxAlgo’s foundation while offering ICT traders a tailored, high-precision solution.
How It Works
FVG Detection
FVGs are identified when a candle’s low is higher than the high of two candles prior (bullish FVG) or a candle’s high is lower than the low of two candles prior (bearish FVG). Detection is restricted to:
• User-selected 10-minute windows (e.g., :00–:10, :50–:60) to capture ICT-relevant periods like hourly transitions.
• AM/PM session first FVGs (if enabled), focusing on 9:30–10:00 AM or 1:30–2:00 PM EST for key market opens.
An optional ATR filter (default: 0.25× ATR) ensures only gaps larger than the threshold are displayed, prioritizing significant imbalances.
Mitigation and Inversion
When price closes through an FVG (e.g., below a bullish FVG’s bottom), the FVG is mitigated and becomes an iFVG, plotted as a support/resistance zone. iFVGs are critical in ICT for identifying reversal points where institutional orders accumulate.
Retest Signals
The script generates signals when price retests an iFVG:
• Close: Triggers when the candle body confirms the retest (conservative, lower noise).
• Wick: Triggers when the candle’s high/low touches the iFVG (faster, higher sensitivity). Signals are visualized with triangular markers (▲ for bullish, ▼ for bearish) and can trigger alerts.
Visualization
• FVGs: Displayed as colored boxes (green for bullish, red for bearish) with optional “Bull FVG”/“Bear FVG” labels.
• iFVGs: Shown as extended boxes with dashed midlines, limited to the user-defined number of recent zones (default: 5).
• Mitigation Removal: Mitigated FVGs/iFVGs are removed (if enabled) to keep the chart clean.
How to Use
Recommended Settings
• Timeframe: Use 1–5 minute charts for precision, avoiding ≥1-hour timeframes (a warning label appears if misconfigured).
• Time Windows: Enable :00–:10 and :50–:60 for hourly open/close FVGs, or use the “Show only 1st presented FVG” option for AM/PM session focus.
• ATR Filter: Keep enabled (multiplier 0.25–0.5) for significant gaps; disable on 1-minute charts for more FVGs during volatility.
• Signal Preference: Use “Close” for conservative entries, “Wick” for aggressive setups.
• Timezone Offset: Set to -5 for EST (or -4 for EDT) to align with ICT’s New York session.
Trading Strategy
1. Macro Timeframes: Focus on New York (7:00–11:00 AM EST) or London (2:00–5:00 AM EST) kill zones for high institutional activity.
2. FVG Entries: Trade bullish FVGs as support in uptrends or bearish FVGs as resistance in downtrends, especially in :00–:10 or :50–:60 windows.
3. iFVG Retests: Enter on retest signals (▲/▼) during liquidity grabs or Judas swings, using “Close” for confirmation or “Wick” for speed.
4. Session FVGs: Use the “Show only 1st presented FVG” option to target the first gap in AM/PM sessions, often tied to ICT’s market maker algorithms.
5. Risk Management: Combine with ICT concepts like order blocks or breaker blocks for confluence, and set stops beyond FVG/iFVG boundaries.
Alerts
Set alerts for:
• “Bullish FVG Detected”/“Bearish FVG Detected”: New FVGs in selected windows.
• “Bullish Signal”/“Bearish Signal”: iFVG retest confirmations.
Settings Description
• Show Last (1–100, default: 5): Number of recent iFVGs to display. Lower values reduce clutter.
• Show only 1st presented FVG : Limits FVGs to the first in 9:30–10:00 AM or 1:30–2:00 PM EST sessions (overrides time window checkboxes).
• Time Window Checkboxes: Enable/disable FVG detection in 10-minute windows (:00–:10, :10–:20, etc.). All enabled by default.
• Signal Preference: “Close” (default) or “Wick” for iFVG retest signals.
• Use ATR Filter: Enables ATR-based size filtering (default: true).
• ATR Multiplier (0–∞, default: 0.25): Sets FVG size threshold (higher values = larger gaps).
• Remove Mitigated FVGs: Removes filled FVGs/iFVGs (default: true).
• Show FVG Labels: Displays “Bull FVG”/“Bear FVG” labels (default: true).
• Timezone Offset (-12 to 12, default: -5): Aligns time windows with EST.
• Colors: Customize bullish (green), bearish (red), and midline (gray) colors.
Why Use This Indicator?
This indicator empowers ICT traders with a tool that goes beyond generic FVG detection, offering precise, time-filtered gaps and inversion tracking aligned with institutional trading principles. By focusing on ICT’s macro timeframes, session-specific imbalances, and customizable signal logic, it provides a clear edge for scalping, swing trading, or reversal setups in high-liquidity markets.

Smarter Money Concepts - FVGs [PhenLabs]📊 Smarter Money Concepts - FVGs
Version: PineScript™ v6
📌 Description
Smarter Money Concepts - FVGs is a sophisticated indicator designed to identify and track Fair Value Gaps (FVGs) in price action. These gaps represent market inefficiencies where price moves quickly, creating imbalances that often attract subsequent price action for mitigation. By highlighting these key areas, traders can identify potential zones for reversals, continuations, and price targets.
The indicator employs volume filtering ideology to highlight only the most significant FVGs, reducing noise and focusing on gaps formed during periods of higher relative volume. This combination of price structure analysis and volume confirmation provides traders with high-probability areas of interest that institutional smart money may target during future price movements.
🚀 Points of Innovation
Volume-Filtered Gap Detection : Eliminates low-significance FVGs by requiring a minimum volume threshold, focusing only on gaps formed with institutional participation
Equilibrium Line Visualization : Displays the midpoint of each gap as a potential precision target for trades
Automated Gap Mitigation Tracking : Monitors when price revisits and mitigates gaps, automatically managing visual elements
Time-Based Gap Management : Intelligently filters gaps based on a configurable timeframe, maintaining chart clarity
Dual Direction Analysis : Simultaneously tracks both bullish and bearish gaps, providing a complete market structure view
Memory-Optimized Design : Implements efficient memory management for smooth chart performance even with numerous FVGs
🔧 Core Components
Fair Value Gap Detection : Identifies price inefficiencies where the current candle’s low is higher than the previous candle’s high (bearish FVG) or where the current candle’s high is lower than the previous candle’s low (bullish FVG).
Volume Filtering Mechanism : Calculates relative volume compared to a moving average to qualify only gaps formed during significant market activity.
Mitigation Tracking : Continuously monitors price action to detect when gaps get filled, with options to either hide or maintain visual representation of mitigated gaps.
🔥 Key Features
Customizable Gap Display : Toggle visibility of bullish and bearish gaps independently to focus on your preferred market direction
Volume Threshold Control : Adjust the minimum volume ratio required for gap qualification, allowing fine-tuning between sensitivity and significance
Flexible Mitigation Methods : Choose between “Wick” or “Close” methods for determining when a gap has been mitigated, adapting to different trading styles
Visual Customization : Full control over colors, transparency, and style of gap boxes and equilibrium lines
🎨 Visualization
Gap Boxes : Rectangular highlights showing the exact price range of each Fair Value Gap. Bullish gaps indicate potential upward price targets, while bearish gaps show potential downward targets.
Equilibrium Lines : Dotted lines running through the center of each gap, representing the mathematical midpoint that often serves as a precision target for price movement.
📖 Usage Guidelines
General Settings
Days to Analyze : Default: 15, Range: 1-100. Controls how many days of historical gaps to display, balancing between comprehensive analysis and chart clarity
Visual Settings
Bull Color : Default:(#596fd33f). Color for bullish Fair Value Gaps, typically using high transparency for clear chart visibility
Bear Color : Default:(#d3454575). Color for bearish Fair Value Gaps, typically using high transparency for clear chart visibility
Equilibrium Line : Default: Enabled. Toggles visibility of the center equilibrium line for each FVG
Eq. Line Color : Default: Black with 99% transparency. Sets the color of equilibrium lines, usually kept subtle to avoid chart clutter
Eq. Line Style : Default: Dotted, Options: Dotted, Solid, Dashed. Determines the line style for equilibrium lines
Mitigation Settings
Mitigation Method : Default: Wick, Options: Wick, Close. Determines how gap mitigation is calculated - “Wick” uses high/low values while “Close” uses open/close values for more conservative mitigation criteria
Hide Mitigated : Default: Enabled. When enabled, gaps become transparent once mitigated, reducing visual clutter while maintaining historical context
Volume Filter
Volume Filter : Default: Enabled. When enabled, only shows gaps formed with significant volume relative to recent average
Min Ratio : Default: 1.5, Range: 0.1-10.0. Minimum volume ratio compared to average required to display an FVG; higher values filter out more gaps
Periods : Default: 15, Range: 5-50. Number of periods used to calculate the average volume baseline
✅ Best Use Cases
Identifying potential reversal zones where price may react after extended moves
Finding precise targets for take-profit placement in trend-following strategies
Detecting institutional interest areas for potential breakout or breakdown confirmations
Plotting significant support and resistance zones based on structural imbalances
Developing fade strategies at key market structure points
Confirming trade entries when price approaches significant unfilled gaps
⚠️ Limitations
Works best on higher timeframes where gaps reflect more significant market inefficiencies
Very choppy or ranging markets may produce small gaps with limited predictive value
Volume filtering depends on accurate volume data, which may be less reliable for some symbols
Performance may be affected when displaying a very large number of historical gaps
Some gaps may never be fully mitigated, particularly in strongly trending markets
💡 What Makes This Unique
Volume Intelligence : Unlike basic FVG indicators, this script incorporates volume analysis to identify the most significant structural imbalances, focusing on quality over quantity.
Visual Clarity Management : Automatic handling of mitigated gaps and memory management ensures your chart remains clean and informative even over extended analysis periods.
Dual-Direction Comprehensive Analysis : Simultaneously tracks both bullish and bearish gaps, providing a complete market structure picture rather than forcing a directional bias.
🔬 How It Works
1. Gap Detection Process :
The indicator examines each candle in relation to previous candles, identifying when a gap forms between the low of candle and high of candle (bearish FVG) or between the high of candle and low of candle (bullish FVG). This specific candle relationship identifies true structural imbalances.
2. Volume Qualification :
For each potential gap, the algorithm calculates the relative volume compared to the configured period average. Only gaps formed with volume exceeding the minimum ratio threshold are displayed, ensuring focus on institutionally significant imbalances.
3. Equilibrium Calculation :
For each qualified gap, the script calculates the precise mathematical midpoint, which becomes the equilibrium line - a key target that price often gravitates toward during mitigation attempts.
4. Mitigation Tracking :
The indicator continuously monitors price action against existing gaps, determining mitigation based on the selected method (wick or close). When price reaches the equilibrium point, the gap is considered mitigated and can be visually updated accordingly.
💡 Note:
Fair Value Gaps represent market inefficiencies that often, but not always, get filled. Use this indicator as part of a complete trading strategy rather than as a standalone system. The most valuable signals typically come from combining FVG analysis with other confirmatory indicators and overall market context. For optimal results, start with the default settings and gradually adjust parameters to match your specific trading timeframe and style.

Imbalance(FVG) DetectorImbalance (FVG) Detector
Overview
The Imbalance (FVG) Detector is a technical analysis tool designed to highlight price inefficiencies by identifying Fair Value Gaps (FVGs). These gaps occur when rapid price movement leaves an area with little to no traded volume, which may later act as a zone of interest. The indicator automatically detects and marks these imbalances on the chart, allowing users to observe historical price behavior more effectively.
Key Features
- Automatic Imbalance Detection: Identifies bullish and bearish imbalances based on a structured three-bar price action model.
- Customizable Sensitivity: Users can adjust the minimum imbalance percentage threshold to tailor detection settings to different assets and market conditions.
- Real-time Visualization: Marked imbalances are displayed as colored boxes directly on the chart.
- Dynamic Box Updates: Imbalance zones extend forward in time until price interacts with them.
- Alert System: Users can set alerts for when new imbalances appear or when price tests an existing imbalance.
How It Works
The indicator identifies market imbalances using a three-bar price structure:
- Bullish Imbalance: Occurs when the high of three bars ago is lower than the low of the previous bar, forming a price gap.
- Bearish Imbalance: Occurs when the low of three bars ago is higher than the high of the previous bar, creating a downward gap.
When an imbalance is detected:
- Green Boxes indicate bullish imbalances.
- Red Boxes indicate bearish imbalances.
- Once price interacts with an imbalance, the box fades to gray, marking it as tested.
! Designed for Crypto Markets
This indicator is particularly useful in crypto markets, where frequent volatility can create price inefficiencies. It provides a structured way to visualize gaps in price movement, helping users analyze historical liquidity areas.
Customization Options
- Min Imbalance Percentage Size: Adjusts the sensitivity of the imbalance detection.
- Alerts: Users can enable alerts to stay notified of new or tested imbalances.
Important Notes
- This indicator is a technical analysis tool and does not provide trading signals or financial advice.
- It does not predict future price movement but highlights historical price inefficiencies.
- Always use this tool alongside other market analysis methods and risk management strategies.

Higher Time Frame Fair Value Gap [ZeroHeroTrading]A fair value gap (FVG) highlights an imbalance area between market participants, and has become popular for technical analysis among price action traders.
A bullish (respectively bearish) fair value gap appears in a triple-candle pattern when there is a large candle whose previous candle’s high (respectively low) and subsequent candle’s low (respectively high) do not fully overlap the large candle. The space between these wicks is known as the fair value gap.
The following script aims at identifying higher timeframe FVG's within a lower timeframe chart. As such, it offers a unique perspective on the formation of FVG's by combining the multiple timeframe data points in the same context.
You can change the indicator settings as you see fit to achieve the best results for your use case.
Features
It draws higher timeframe bullish and bearish FVG's on the chart.
For bullish (respectively bearish) higher timeframe FVG's, it adds the buying (respectively selling) pressure as a percentage ratio of the up (respectively down) volume of the second higher timeframe bar out of the total up (respectively down) volume of the first two higher timeframe bars.
It adds a right extended trendline from the most recent lowest low (respectively highest high) to the top (respectively bottom) of the higher timeframe bullish (respectively bearish) FVG.
It detects and displays higher timeframe FVG's as early as one starts forming.
It detects and displays lower timeframe (i.e. chart's timeframe) FVG's upon confirmation.
It allows for skipping inside first bars when evaluating FVG's.
It allows for dismissing higher timeframe FVG's if there is no update for any period of the chart's timeframe. For instance, this can occur at lower timeframes during low trading activity periods such as extended hours.
Settings
Higher Time Frame FVG dropdown: Selects the higher timeframe to run the FVG detection on. Default is 15 minutes. It must be higher than, and a multiple of, the chart's timeframe.
Higher Time Frame FVG color select: Selects the color of the text to display for higher timeframe FVG's. Default is black.
Show Trend Line checkbox: Turns on/off trendline display. Default is on.
Show Lower Time Frame FVG checkbox: Turns on/off lower timeframe (i.e. chart's timeframe) FVG detection. Default is on.
Show Lower Time Frame FVG color select: Selects the color of the border for lower timeframe (i.e. chart's timeframe) FVG's. Default is white.
Include Inside Bars checkbox: Turns on/off the inclusion of inside first bars when evaluating FVG's. Default is on.
With Consistent Updates checkbox: Turns on/off consistent updates requirement. Default is on.

Fair Value Gap [by Oberlunar]Fair Value Gap
This indicator is designed to identify and display Fair Value Gaps (FVG) on the price chart. Fair Value Gaps are areas between candles where the price lacks continuity, leaving a "gap" that can serve as a reference point for price retracements. These zones are often considered important by traders as they represent market imbalances that tend to be "mitigated" (i.e., filled or tested) over time.
Purpose of Publication
This indicator addresses a common gap in FVG indicators. Most existing FVG indicators do not visually distinguish between mitigated (touched) FVGs and those that remain intact. With this indicator:
Mitigated FVGs are clearly displayed with distinct colors, allowing traders to identify which zones have been partially or fully filled by the price.
Unmitigated FVGs remain prominent, representing potential points of interest.
Key Features
Identification of Fair Value Gaps:
A Bullish FVG (upward gap) forms when the high of the three previous candles (candle -3) is lower than the low of the next candle (candle -1).
A Bearish FVG (downward gap) forms when the low of the three previous candles (candle -3) is higher than the high of the next candle (candle -1).
Dynamic Coloring:
Unmitigated FVGs are highlighted with specific colors: green for Bullish and red for Bearish gaps.
When an FVG is "touched" by the price (i.e., mitigated), the color changes:
Yellow-green for mitigated Bullish FVGs.
Purple for mitigated Bearish FVGs.
Handling Mitigated FVGs:
When an FVG is touched by the price, it is visually updated with a different color.
An option can be enabled to "shrink" the mitigated zone, adjusting the box to reflect the remaining untested portion of the gap.
Customization:
Configure the maximum number of FVGs to display on the chart.
Set specific colors for mitigated and unmitigated FVGs.
Choose whether to automatically shrink mitigated zones.
How to Identify Support and Resistance Levels
Support:
Bullish FVGs represent potential support levels, as they indicate areas where the price might return to seek liquidity or fill the imbalance.
An FVG that is repeatedly touched without being fully filled becomes a significant support zone.
Resistance:
Bearish FVGs represent potential resistance levels, indicating zones where the price might stall or reverse direction.
Why a Repeatedly Mitigated FVG is Significant
When an FVG is touched or mitigated multiple times, it means the market recognizes that area as significant. This can happen for several reasons:
Accumulation or Distribution: Institutional traders may use these zones to accumulate or distribute positions without causing excessive market movement.
Presence of Liquidity: FVGs often represent areas with pending orders (stop-losses, limit orders), and the price revisits these zones to seek liquidity.
Market Equilibrium: When an FVG is repeatedly filled, it indicates the market's attempt to balance a demand-supply imbalance. This makes the zone an important level to monitor for potential breakouts or reversals.

Displacement (Two FVGs)A simple indicator that attempts to identify displacement in price by alerting you when two simultaneous Fair Value Gaps (FVGs) occur.
When two fair value gaps occur, the indicator will print a green bar (if bullish) or a red bar (if bearish). If you right click on the indicator you can turn on alerts that will pop up every time a dual FVG occurs.
Fair Value Gaps are most commonly used amongst price action traders and are defined as instances in which there are inefficiencies, or imbalances, in the market.
The concept for this indicator is very simple. Apply it to your chart and enable alerts on the instruments and timeframe you trade. When you get an alert, it could indicate larger players getting involved.
This is NOT a trading strategy. Its intention is to save time by alerting you to large imbalances in price on the instruments you trade.

occ3aka weighted fair price
The ultimate price source for all your stuff, unless you go completely nuts.
The ultimate way to build line charts & do pattern trading, unless you go completely nuts.
Why occ3?
You need a one-point estimate for every bar, a typical price of every bar aye? But then you see that every bar has a different distribution of prices. You can drop a stat test on every bar and pick median, mean, or whatever. But that's still prone to error (imagine borderline cases).
Instead, you can transform the task into a geometric one and say, "I wanna find the center of mass of all dem ticks within a particular interval (a day, a week, a century)". But lol ofc you won't do it, so lets's estimate it:
1) a straight line from Open to Close more/less estimates a regression line if you woulda dropped regression on all the ticks within a given interval;
2) centroid always lies on regression line, so it's always in between the endpoints of regression line. So that's why (open + close) /2;
3) Then, you remember that sequence matters, + generally the volume is higher near the close, so...;
4) Voila, (open + close + close) / 3
Why "fair" price?
Take a daily bar:
1) High & low were the best prices to sell & buy;
2) Opening & closing auctions had acceptable prices, in exchange for the the biggest potential to transact serious volume;
3) "Fair" price, logically, is somewhere in between the acceptable prices;
4) Market is fractal => the same principles propagate everywhere;
4) No, POCs and VPOCs don't make much sense as fair prices.
Nothing else to say, really advise to use it as a line chart if you trade price patterns.

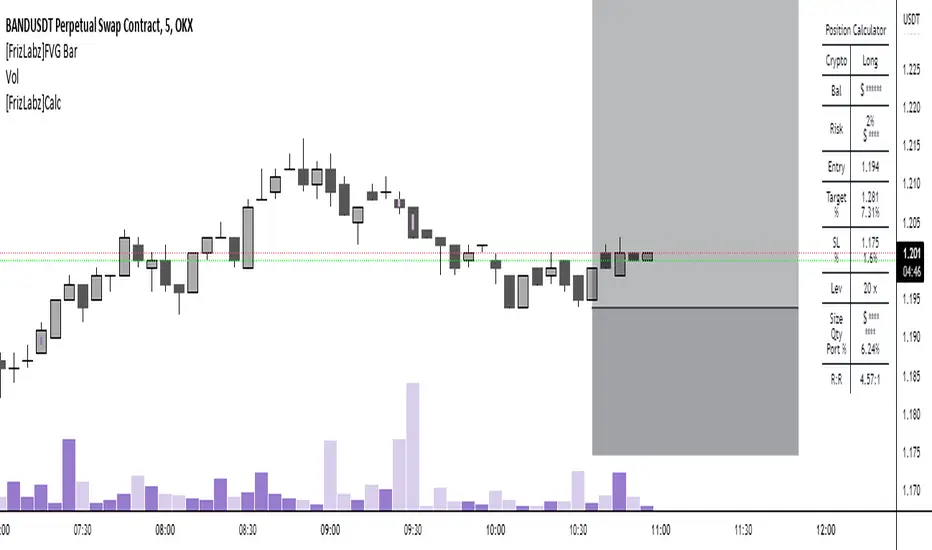
[FrizLabz]FVG Bar
For those of you that like to keep your charts nice and tidy for your Technical Analysis!
FVG = Fair Value Gap
Fair Value Gaps are when impulse movements create an imbalance in price leaving unfilled orders.. they are popular because after one is created we often observe price return to fill these unfilled orders
3 candles make a FVG
When the high/low of most recent candle is lower/high than the low/high of the bar before last
Similar to my other FVG indicator but this one allows you to delete Filled FVGs and have them adjust when filled
Uses a line whose x1 and x2 are on the FVG bar and adjust the size of the FVG with line width because line width on line.new()s doesnt have a cap on line width like plot()s do
Not much too it I made this because a few people were asking if they could delete the FVG after it was Mitigated and since my other uses plots it wasnt possible
so I hope this works for those who were asking about it
hope you enjoy please let me know if you have an idea or find a bug,
Thank You! -
Silen's Financials Fair ValueIt is finally here! 🔥 My 3rd and most important script in my Financial series! 🚀
Ever imagined to see all fundamentals (or many that is) combined into one indicator that is right on your chart, showing you how your favorite stock is trading compared to its fundamentals?
Well, here is your answer! 📡
____________________________________________________________________________________________
This script shows you my own personal interpretation of fair value, based solely on the financial fundamentals of a company compared to market averages.
I don't believe that certain sectors of the market should be priced higher than others. If you look at historical data you'll see that favored sectors always rotate - placing insanely high P/E multiples on some sectors. Once they are "out" and people rotate away from those sectors you're left with nothing but the naked fundamentals that matter. So, you'll see many companies, that have been doing well on paper, see their share price decline by 70-90% for no other reasons than people favoring other sectors.
That's why it's even more important to focus on fair value that is solely fundamentals-based. Know when your stock gets to expensive. 🤯
____________________________________________________________________________________________
To give you some examples:
- Most Megacaps trade at historically high valuations, several times my fair value. Those include AAPL, MSFT, NVDA, AMZN, TSLA, JPM, TSM, V and so on. And no, in the past they partially traded below (my) fair value.
- Most Cybersecurity / Cloud companies are trading at truly massive multiples of my fair value. (NET, DDOG, etc)
- Many Smallcaps & Midcaps are trading several multiples (OESX, CODX, QFIN) below my fair value. And no, in the past they partially traded above (my) fair value.
Ok, so much about the market. You ultimately decide how much you want to orientate on fair value. 👨🏫
____________________________________________________________________________________________
This fair value indicator (purple line):
Takes the P/E rate of the company and compares it to the market (50% weight)
Takes the P/S rate of the company and compares it to the market (50% weight)
Then adds boni and mali f or debt/equity rates and debt and equity itself
Also looks at past growth and calculates future P/E and P/S rates which adds , in some cases, value to the fair value (green line)
Also compares how historical valuations have behaved compared to fair value and simulates a fair value guideline (dark blue line)
____________________________________________________________________________________________
This script is part 3️⃣ of a series of indicators that work well together.
Script 1️⃣ of the series is:
P/E & P/S Rates
Script 2️⃣ of the series is:
Debt & Equity
If you use all 3 scripts together it will look like this, giving you truly deep and simple information about the fundamentals of a company:
Example 1 - AMD
Example 2 - HZO
Example 3 - APPS
I hope this script makes your investing and stock picks a lot easier! 🔆💹🕗
Disclaimer: Fair value is always subjective. There are many different approaches to fair value. This one is only my personal interpretation.
Disclaimer 2: This script works only for the Day-Timeframe.
Disclaimer 3: This script uses 17,5 P/E and 3,0 P/S as market averages. The actual average keeps changing but, historically speaking, these seemed to be good numbers.
Feel free to share your thoughts and feedback! 🙃

FAIR P/E BASED ON INTEREST RATESJust a different way to view S&P 500 valuations versus the standard look of looking at raw PE. Current yield of the 10 Year Bonds are used to calculate a fair value for the SPX.
This is a methodology that Buffett uses to measure value.
Recommend turning off most plots and just plotting PE and/or PE10 percent difference only.
The "slope and intercept" inputs should be left alone unless you recalculate them with updated data.
The "current PE and PE10" inputs can be found here: www.multpl.com This is a daily estimated value.
The full calculated value is released once per month, and is what Quandl has. Change these numbers if you want today's updated values.
Once you have the study set up the way you want, I recommend saving the defaults (bottom left corner in the settings screen).

UCS_Value BandsThis Indicator is yet another variation of KC. Inspired from Value Charts webinar. I have seen their videos on youtube. What appears to be a variation of KC.
They use 12 bands Showing the zone, and different MA for different timeframes.
You can get this indicator close to accuracy by changing the inputs (ATR) and (Deviations)
This also can be used with the triple ATR setup - Change the values to EMA to desired value. To obtain the First band to plot @ 1, Change the Band deviation to 0.25.
Also can be used as as the Acceleration Band. With Current Settings, the Third Band will plot the Acceleration band.
List of All my Indicators - www.tradingview.com
Lycka Till
