Advanced EMA Cross with Normalized ATR Filter, Controlling ADX
Description:
This strategy is based on EMA cross strategy and additional filters are used to get better results, a normalized ATR filter, and ADX control...
It aims to provide traders with a code base that generates signals for long positions based on market conditions defined by various indicators.
How it Works:
1. EMA: Uses short (8 periods) and long (20 periods) EMAs to identify crossovers.
2. ATR: Uses a 14-period ATR, normalized to its 20-period historical range, to filter out noise.
3. ADX: Uses a 14-period RMA to identify strong trends.
4. Volume: Filters trades based on a 14-period SMA of volume.
5. Super Trend: Uses a Super Trend indicator to identify the market direction.
How to Use:
- Buy Signal: Generated when EMA short crosses above EMA long, and other conditions like ATR and market direction are met.
- Sell Signal: Generated based on EMA crossunder and high ADX value.
Originality and Usefulness:
This script combines EMA, ATR, ADX, and Super Trend indicators to filter out false signals and identify more reliable trading opportunities.
USD Strength in the code is not working, just simulated it as PSEUDO CODE:
Strategy Results:
- Account Size: $1000
- Commission: Not considered
- Slippage: Not considered
- Risk: Manageable through parameters, now less than 5% per trade
- Dataset: Aim for more than 100 trades for a sufficient sample size
- Test Conditions: Test in 30 min chart for BTCUSDT
IMPORTANT NOTE: This script should be used for educational purposes and should not be considered as financial advice.
Chart:
- The script's output is plotted as Buy and Sell signals on the chart.
- No other scripts are included for clarity.
- Have tested with 30mins period
- You are encouraged to play with parameters, let me know if it helps you and/or if you can upgrade the code to a better level.
WHY DID I USE ATR AND ADX?
ATR filter is usually used for the following purposes.
Market Volatility: ATR measures how volatile the market is. High ATR values indicate that the price is experiencing significant fluctuations.
Filtering: Crossing a certain ATR threshold may indicate that the market is active enough to present trading opportunities.
Risk Management: ATR can also be used to set stop-loss and take-profit levels, helping to manage risk effectively.
And ADX is usually used for;
Trend Strength: ADX measures the strength of a trend. High ADX values indicate a strong trend.
Filtering: An ADX value above a certain level suggests that the trend is strong and it might be safer to trade.
Versatility: ADX does not indicate the direction of the trend, only its strength. This makes it useful in both bullish and bearish markets.
Using these indicators together can help filter out false signals and produce more reliable trading signals. While ATR helps to determine if the market is active enough, ADX measures the strength of the trend. Combined, they can create a more complex and effective trading strategy.
I've used ADX data to support generating a buy signal after a golden cross (bullish trend) and waiting until this is a strong trend. It sounds good to check for different trend strengths for bullish and bearish markets to decide a buy signal. Additionally I used ATR to check if the market has enough fluctuations.
Wykładnicza średnia krocząca (EMA)

CCI+EMA Strategy with Percentage or ATR TP/SL [Alifer]This is a momentum strategy based on the Commodity Channel Index (CCI), with the aim of entering long trades in oversold conditions and short trades in overbought conditions.
Optionally, you can enable an Exponential Moving Average (EMA) to only allow trading in the direction of the larger trend. Please note that the strategy will not plot the EMA. If you want, for visual confirmation, you can add to the chart an Exponential Moving Average as a second indicator, with the same settings used in the strategy’s built-in EMA.
The strategy also allows you to set internal Stop Loss and Take Profit levels, with the option to choose between Percentage-based TP/SL or ATR-based TP/SL.
The strategy can be adapted to multiple assets and timeframes:
Pick an asset and a timeframe
Zoom back as far as possible to identify meaningful positive and negative peaks of the CCI
Set Overbought and Oversold at a rough average of the peaks you identified
Adjust TP/SL according to your risk management strategy
Like the strategy? Give it a boost!
Have any questions? Leave a comment or drop me a message.
CAUTIONARY WARNING
Please note that this is a complex trading strategy that involves several inputs and conditions. Before using it in live trading, it is highly recommended to thoroughly test it on historical data and use risk management techniques to safeguard your capital. After backtesting, it's also highly recommended to perform a first live test with a small amount. Additionally, it's essential to have a good understanding of the strategy's behavior and potential risks. Only risk what you can afford to lose .
USED INDICATORS
1 — COMMODITY CHANNEL INDEX (CCI)
The Commodity Channel Index (CCI) is a technical analysis indicator used to measure the momentum of an asset. It was developed by Donald Lambert and first published in Commodities magazine (now Futures) in 1980. Despite its name, the CCI can be used in any market and is not just for commodities. The CCI compares current price to average price over a specific time period. The indicator fluctuates above or below zero, moving into positive or negative territory. While most values, approximately 75%, fall between -100 and +100, about 25% of the values fall outside this range, indicating a lot of weakness or strength in the price movement.
The CCI was originally developed to spot long-term trend changes but has been adapted by traders for use on all markets or timeframes. Trading with multiple timeframes provides more buy or sell signals for active traders. Traders often use the CCI on the longer-term chart to establish the dominant trend and on the shorter-term chart to isolate pullbacks and generate trade signals.
CCI is calculated with the following formula:
(Typical Price - Simple Moving Average) / (0.015 x Mean Deviation)
Some trading strategies based on CCI can produce multiple false signals or losing trades when conditions turn choppy. Implementing a stop-loss strategy can help cap risk, and testing the CCI strategy for profitability on your market and timeframe is a worthy first step before initiating trades.
2 — AVERAGE TRUE RANGE (ATR)
The Average True Range (ATR) is a technical analysis indicator that measures market volatility by calculating the average range of price movements in a financial asset over a specific period of time. The ATR was developed by J. Welles Wilder Jr. and introduced in his book “New Concepts in Technical Trading Systems” in 1978.
The ATR is calculated by taking the average of the true range over a specified period. The true range is the greatest of the following:
The difference between the current high and the current low.
The difference between the previous close and the current high.
The difference between the previous close and the current low.
The ATR can be used to set stop-loss orders. One way to use ATR for stop-loss orders is to multiply the ATR by a factor (such as 2 or 3) and subtract it from the entry price for long positions or add it to the entry price for short positions. This can help traders set stop-loss orders that are more adaptive to market volatility.
3 — EXPONENTIAL MOVING AVERAGE (EMA)
The Exponential Moving Average (EMA) is a type of moving average (MA) that places a greater weight and significance on the most recent data points.
The EMA is calculated by taking the average of the true range over a specified period. The true range is the greatest of the following:
The difference between the current high and the current low.
The difference between the previous close and the current high.
The difference between the previous close and the current low.
The EMA can be used by traders to produce buy and sell signals based on crossovers and divergences from the historical average. Traders often use several different EMA lengths, such as 10-day, 50-day, and 200-day moving averages.
The formula for calculating EMA is as follows:
Compute the Simple Moving Average (SMA).
Calculate the multiplier for weighting the EMA.
Calculate the current EMA using the following formula:
EMA = Closing price x multiplier + EMA (previous day) x (1-multiplier)
STRATEGY EXPLANATION
1 — INPUTS AND PARAMETERS
The strategy uses the Commodity Channel Index (CCI) with additional options for an Exponential Moving Average (EMA), Take Profit (TP) and Stop Loss (SL).
length : The period length for the CCI calculation.
overbought : The overbought level for the CCI. When CCI crosses above this level, it may signal a potential short entry.
oversold : The oversold level for the CCI. When CCI crosses below this level, it may signal a potential long entry.
useEMA : A boolean input to enable or disable the use of Exponential Moving Average (EMA) as a filter for long and short entries.
emaLength : The period length for the EMA if it is used.
2 — CCI CALCULATION
The CCI indicator is calculated using the following formula:
(src - ma) / (0.015 * ta.dev(src, length))
src is the typical price (average of high, low, and close) and ma is the Simple Moving Average (SMA) of src over the specified length.
3 — EMA CALCULATION
If the useEMA option is enabled, an EMA is calculated with the given emaLength .
4 — TAKE PROFIT AND STOP LOSS METHODS
The strategy offers two methods for TP and SL calculations: percentage-based and ATR-based.
tpSlMethod_percentage : A boolean input to choose the percentage-based method.
tpSlMethod_atr : A boolean input to choose the ATR-based method.
5 — PERCENTAGE-BASED TP AND SL
If tpSlMethod_percentage is chosen, the strategy calculates the TP and SL levels based on a percentage of the average entry price.
tp_percentage : The percentage value for Take Profit.
sl_percentage : The percentage value for Stop Loss.
6 — ATR-BASED TP AND SL
If tpSlMethod_atr is chosen, the strategy calculates the TP and SL levels based on Average True Range (ATR).
atrLength : The period length for the ATR calculation.
atrMultiplier : A multiplier applied to the ATR to set the SL level.
riskRewardRatio : The risk-reward ratio used to calculate the TP level.
7 — ENTRY CONDITIONS
The strategy defines two conditions for entering long and short positions based on CCI and, optionally, EMA.
Long Entry: CCI crosses below the oversold level, and if useEMA is enabled, the closing price should be above the EMA.
Short Entry: CCI crosses above the overbought level, and if useEMA is enabled, the closing price should be below the EMA.
8 — TP AND SL LEVELS
The strategy calculates the TP and SL levels based on the chosen method and updates them dynamically.
For the percentage-based method, the TP and SL levels are calculated as a percentage of the average entry price.
For the ATR-based method, the TP and SL levels are calculated using the ATR value and the specified multipliers.
9 — EXIT CONDITIONS
The strategy defines exit conditions for both long and short positions.
If there is a long position, it will be closed either at TP or SL levels based on the chosen method.
If there is a short position, it will be closed either at TP or SL levels based on the chosen method.
Additionally, positions will be closed if CCI crosses back above oversold in long positions or below overbought in short positions.
10 — PLOTTING
The script plots the CCI line along with overbought and oversold levels as horizontal lines.
The CCI line is colored red when above the overbought level, green when below the oversold level, and white otherwise.
The shaded region between the overbought and oversold levels is plotted as well.

CC Trend strategy 2- Downtrend ShortTrend Strategy #2
Indicators:
1. EMA(s)
2. Fibonacci retracement with a mutable lookback period
Strategy:
1. Short Only
2. No preset Stop Loss/Take Profit
3. 0.01% commission
4. When in a profit and a closure above the 200ema, the position takes a profit.
5. The position is stopped When a closure over the (0.764) Fibonacci ratio occurs.
* NO IMMEDIATE RE-ENTRIES EVER!*
How to use it and what makes it unique:
This strategy will enter often and stop quickly. The goal with this strategy is to take losses often but catch the big move to the downside when it occurs through the Silvercross/Fibonacci combination. This is a unique strategy because it uses a programmed Fibonacci ratio that can be used within the strategy and on any program. You can manipulate the stats by changing the lookback period of the Fibonacci retracement and looking at different assets/timeframes.
This description tells the indicators combined to create a new strategy, with commissions and take profit/stop loss conditions included, and the process of strategy execution with a description of how to use it. If you have any questions feel free to PM me and boost if you found it helpful. Thank you, pineUSERS!
CHEATCODE1

Buy Only Strategy with Dynamic Re-Entry and ExitThe strategy aims to create a simple buy-only trading system based on moving average crossovers and the Weekly Commodity Channel Index (CCI) or Weekly Average Directional Index (ADX). It generates buy signals when the fast-moving average crosses above the slow-moving average and when the Weekly CCI and or Weekly ADX meet the specified conditions.
The strategy also allows for dynamic re-entry, which means it can open new long positions if the price goes above the three moving averages after an exit. However, the strategy will exit the long position if the price closes below the third moving average.
ENTRY CONDITIONS
The script defines the conditions for generating buy signals. It checks for two conditions for a valid buy signal:
• If the fast-moving average crosses above the slow-moving average -THERE IS Dynamic Re-Entry also
• If the user chooses HE OR SHE CAN FILTER TRADES BY USING CCI OR ADX
Dynamic Re-Entry:
the script allows for dynamic re-entry. If there is no active long position and the price is above all three moving averages a new long position is opened.
Exit Conditions
The script defines the exit condition for closing a long position. If the price closes below the third moving average, the script closes the long position.
IMPORTANT NOTICE
ONLY DAILY TIME FRAME
THERE WOULD BE WHIPSAW USE YOUR OWN ACCUMEN TO MINIMISE THEM
ITS ONLY BUY STRATEGY
EXIT CAN BE STRATEGY BASED OR SET PROFIT AND TARGETS AS PER RISK APETITE /RISK MANAGEMENT
DONT TRADE OPTIONS ON THIS
SUITABLE FOR STOCKS OF USA AND INDIAN MARKETS
ALWAYS REMEMBER TO DO YOUR OWN RESEARCH BEFORE TRADING AND INVESTING

Yesterday's High v.17.07Yesterday’s High Breakout it is a trading system based on the analysis of yesterday's highs, it works in trend-following mode therefore it opens a long position at the breakout of yesterday's highs even if they occur several times in one day.
There are several methods for exiting a trade, each with its own unique strategy. The first method involves setting Take-Profit and Stop-Loss percentages, while the second utilizes a trailing-stop with a specified offset value. The third method calls for a conditional exit when the candle closes below a reference EMA.
Additionally, operational filters can be applied based on the volatility of the currency pair, such as calculating the percentage change from the opening or incorporating a gap to the previous day's high levels. These filters help to anticipate or delay entry into the market, mitigating the risk of false breakouts.
In the specific case of INJ, a 12% Take-Profit and a 1.5% Stop-Loss were set, with an activated trailing-stop percentage, TRL 1 and OFF 0.5.
To postpone entry and avoid false breakouts, a 1% gap was added to the price of yesterday's highs.
Name: Yesterday's High Breakout - Trend Follower Strategy
Author: @tumiza999
Category: Trend Follower, Breakout of Yesterday's High.
Operating mode: Spot or Futures (only long).
Trade duration: Intraday.
Timeframe: 30M, 1H, 2H, 4H
Market: Crypto
Suggested usage: Short-term trading, when the market is in trend and it is showing high volatility.
Entry: When there is a breakout of Yesterday's High.
Exit: Profit target or Trailing stop, Stop loss or Crossunder EMA.
Configuration:
- Gap to anticipate or postpone the entry before or after the identified level
- Rate of Change for Entry Condition
- Take Profit, Stop Loss and Trailing Stop
- EMA length
Backtesting:
⁃ Exchange: BINANCE
⁃ Pair: INJUSDT
⁃ Timeframe: 4H
- Treshold: 1
- Gap%: 1
- SL: 1.5
- TP:12
- TRL: 1
- OFF-TRL: 0.5
⁃ Fee: 0.075%
⁃ Slippage: 1
- Initial Capital: 10000 USDT
- Position sizing: 10% of Equity
- Start : 2018-07-26 (Out Of Sample from 2022-12-23)
- Bar magnifier: on
Credits: LucF for Pine Coders (f_security function to avoid repainting using security)
Disclaimer: Risk Management is crucial, so adjust stop loss to your comfort level. A tight stop loss can help minimise potential losses. Use at your own risk.
How you or we can improve? Source code is open so share your ideas!
Leave a comment and smash the boost button!
Thanks for your attention, happy to support the TradingView community.

Moving Average Rainbow (Stormer)This strategy is based and shown by trader and investor Alexandre Wolwacz "Stormer".
Overview
The strategy uses 12 moving averages (default EMA) to identify trends and generate trading signals opening positions.
Allowing to select the type of moving average and length to be used.
The conditions includes relationship between moving averages, the position of the current price relative to the moving averages, and the occurrence of certain price patterns.
Calculation
The mean moving averages is calculated by adding all the 12 moving averages and dividing by 12, the value is used to help to identify trend and possible condition to open position.
The 12 moving averages is spliced by 3 ranges, initial range (moving average lines 1 to 4), middle range (moving average lines 5 to 8) and end range (moving average lines 9 to 12). These ranges helps to identify potential trend and market turn over.
The moving average touch price is a relationship between the low price (uptrend) or high price (downtrend) with the moving average lines, it identifies where the price (low/high) has reached the the moving average line. Fetching the value to help for opening position, set stop loss and take profit.
Since the stop loss is based and set from the previous moving average touch price value, when position is about to be open and setting the stop loss value, there is a verification to check both current and previous moving average touch price to recalculate the stop loss value.
The turnover trend checks for a possible market turnover event, setting up a new profit target, this setting when enabled is to be helpful when a turnover occurs against the position to exit position with some profit based on highest high price if long or lowest low price if short.
The turnover signal is similar to turnover trend. The difference is that when this setting is enabled and it triggers, it simply exit the current position and opens up a reverse position, long goes short and short goes long. And there is an complement optional that checks current price exit profitable.
Entry Position
Long Position:
Price is higher than the mean moving averages. Meaning possible uptrend.
The lines of the middle range from the moving averages are in increasing order. Meaning possible uptrend.
The current high pierced up previous high.
Fetch the previous value of the moving average touch price. Meaning the low price has touched one of the moving average lines, which that value is conditioning to open position.
Short Position:
Price is lower than the mean moving averages. Meaning possible downtrend.
The lines of the middle range from the moving averages are in decreasing order. Meaning possible downtrend.
The current low pierced down previous low.
Fetch the previous value of the moving average touch price. Meaning the high price has touched one of the moving average lines, which that value is conditioning to open position.
Risk Management
Stop Loss:
The stop loss is based from the previous moving average touch price value, high price for short and low price for long or occurs an verification to check for both current and previous moving average touch price value and a recalculation is done to set the stop loss.
Take Profit:
According to the author, the profit target should be at least 1:1.6 the risk, so to have the strategy mathematically positive.
The profit target is configured input, can be increased or decreased.
It calculates the take profit based on the price of the stop loss with the profit target input.
Turnover Trend
Long Position:
The moving averages initial range lines signals a possible market turnover. Meaning long might be going short.
Fetches the highest high hit since the opening of the position, setting that value to the new profit target.
Short Position:
The moving averages initial range lines signals a possible market turnover. Meaning short might be going long.
Fetches the lowest low hit since the opening of the position, setting that value to the new profit target.

Bollinger Bands Modified (Stormer)This strategy is based and shown by trader and investor Alexandre Wolwacz "Stormer".
Overview
The strategy uses two indicators Bollinger Bands and EMA (optional for EMA).
Calculates Bollinger Bands, EMA, highest high, and lowest low values based on the input parameters, evaluating the conditions to determine potential long and short entry signals.
The conditions include checks for crossovers and crossunders of the price with the upper and lower Bollinger Bands, as well as the position of the price relative to the EMA.
The script also incorporates the option to add an inside bar pattern check for additional information.
Entry Position
Long Position:
Price cross over the superior band of bollinger bands.
The EMA is used to add support for trend analysis, it is an optional input, when used, it checks if price is above EMA.
Short Position:
Price cross under the inferior band of bollinger bands.
The EMA is used to add support for trend analysis, it is an optional input, when used, it checks if price is under EMA.
Risk Management
Stop Loss:
The stop loss is calculated based on the input highest high (for short position) and lowest low (for long position).
It gets the length based on the input from the last candles to set which is the highest high and which is the lowest low.
Take Profit:
According to the author, the profit target should be at least 1:1.6 the risk, so to have the strategy mathematically positive.
The profit target is configured input, can be increased or decreased.
It calculates the take profit based on the price of the stop loss with the profit target input.

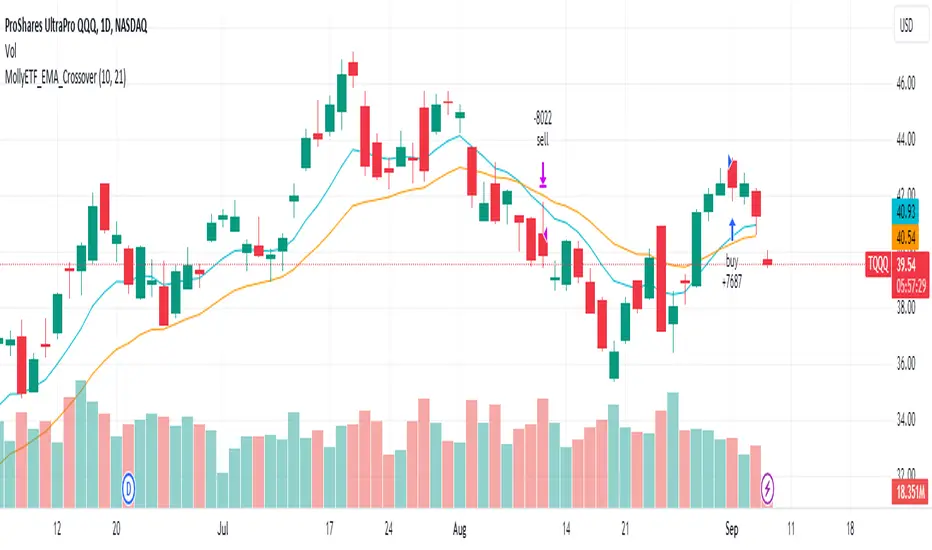
DCA EMA Simple Bot [Starbots]
This is a simple idea of DCA trading on EMA crosses. Strategy is not repainting.
The difference between this and any other strategy is, that this script allows you to preset DCA buy triggers at desired levels and customize each DCA order size independently. Alerts are working, this strategy is easily used for automatic trading.
I mainly trade on Cryptohopper, Pionex, 3commas. This was created for community, alerts are working and non-repainting. Should work on any other as well.
Trading Condition:
It's buying when Fast EMA crosses up Slow EMA. Set your paramters.
It's selling if EMA's crosses back, signaling a sell. Optional.
DCA:
You can enter DCA on 20 custom levels or layers. It buys DCA when price hits the plotted blue line on the chart that's set by input % triggers. (buy 1st DCA at 2% drop, buy 2nd DCA at 5% drop,...)
Set your Inital Capital and Pyramiding in Properties tab, Initial Order Size and DCA Order Size (lot1,lot2,lot3,..), Order Type are changed in strategy inputs.
-By default you can see that we buy when EMA's cross up and signal a buy for 10% of equity, if market is dropping you will then place a first DCA order ( 20% equity) at 2% drop (lower) from initial order. If market keeps dropping you have more DCA levels where you can buy and average down your holding position. For selling you can use Take profit and Stop Loss targets that averages down multiple open positions, it will sell it once it reaches your desirable Take Profit and close a deal. You can also close your trade if EMA signals a sell.
Pyramiding - number of orders you can open at a time
Your first buy order is pyramiding 1. To allow it to buy 1 DCA or merge one time, set pyramding to 2.
Want to DCA 10 times? Set pyramiding at 11. (+1 always)
More features:
- Profit Calendar
- Show Balance label before every new trade
- DCA table - visualize how much of your investment is used in trades. If a background of the table is green you are okay, if the background color is red - you are using more money for orders than you actually have.
Buy Orders << Strategy Equity/Capital
- Show / Hide DCA lines - if your chart processing is getting slow you should hide some DCA levels to speed it up
- Backtesting Range - for testing the strategy in different time windows
- Alerts
When all trades are closed on your chart, winning rate of the strategy is 100% actually.
Win rate is shown differently as it's actually closing and opening every trade individually by default in TradingView system. We merge positions together and average it down into one big position to later sell for a profit (DCA).
You use this Trading Algorithm at your own risk. Do not trade before testing or invest something you cannot afford to lose on markets.

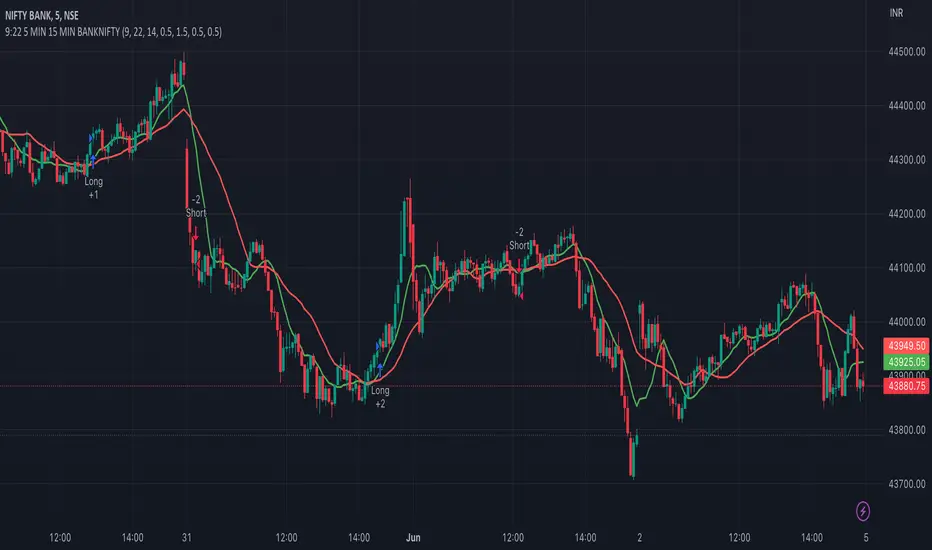
9:22 5 MIN 15 MIN BANKNIFTY9:22 5 MIN 15 MIN BANKNIFTY Strategy with Additional Filters
The 9:22 5 MIN 15 MIN BANKNIFTY Strategy with Additional Filters is a trend-following strategy designed for trading the BANKNIFTY instrument on a 5-minute chart. It aims to capture potential price movements by generating buy and sell signals based on moving average crossovers, breakout confirmations, and additional filters.
Key Features:
Fast MA Length: 9
Slow MA Length: 22
ATR Length: 14
ATR Filter: 0.5
Trailing Stop Percentage: 1.5%
Pullback Threshold: 0.5
Minimum Candle Body Percentage: 0.5
Use Breakout Confirmation: Enabled
Additional Filters:
Volume Threshold: Set a minimum volume requirement for trades.
Trend Filter: Optionally enable a trend filter based on a higher timeframe moving average.
Momentum Filter: Optionally enable a momentum filter using the RSI indicator.
Support/Resistance Filter: Optionally enable a filter based on predefined support and resistance levels.
Buy and Sell Signals:
Buy Signal: A buy signal is generated when the fast moving average crosses above the slow moving average, with additional confirmation from breakout and volume criteria, along with optional trend, momentum, and support/resistance filters.
Sell Signal: A sell signal is generated when the fast moving average crosses below the slow moving average, with similar confirmation and filtering criteria as the buy signal.
Exit Strategy:
The strategy employs a trailing stop-loss mechanism based on a percentage of the average entry price. The stop-loss is dynamically adjusted to protect profits while allowing for potential upside.
Please note that this strategy should be thoroughly backtested and evaluated in different market conditions before applying it to live trading. It is also recommended to adjust the parameters and filters according to individual preferences and risk tolerance.
Feel free to customise and adapt the description as needed to suit your preferences and the specific details of your strategy.
JS-TechTrading: Supertrend-Strategy_Basic versionAre you looking for a reliable and profitable algorithmic trading strategy for TradingView? If so, you might be interested in our Supertrend basic strategy, which is based on three powerful indicators: Supertrend (ATR), RSI and EMA.
Supertrend is a trend-following indicator that helps you identify the direction and strength of the market. It also gives you clear signals for entry and exit points based on price movements.
RSI is a momentum indicator that measures the speed and change of price movements. It helps you filter out false signals and avoid overbought or oversold conditions.
EMA is a moving average indicator that smooths out price fluctuations and shows you the long-term trend of the market. It helps you confirm the validity of your trades and avoid trading against the trend.
Our Supertrend basic strategy combines these three indicators to give you a simple yet effective way to trade any market. Here's how it works:
- For long trades, you enter when the price is above Supertrend and pulls back below it (the low of the candle crosses Supertrend) and then rebounds above it (the high of the next candle goes above the pullback candle). You exit when the price closes below Supertrend or when you reach your target profit or stop loss.
- For short trades, you enter when the price is below Supertrend and pulls back above it (the high of the candle crosses Supertrend) and then drops below it (the low of the next candle goes below the pullback candle). You exit when the price closes above Supertrend or when you reach your target profit or stop loss.
- You can also use RSI and EMA filters to improve your results. For long trades, you only enter if RSI is above 50 and price is above 200 EMA. For short trades, you only enter if RSI is below 50 and price is below 200 EMA.
- You can set your stop loss and target profit as a percentage of your entry price or based on other criteria. You can also adjust the parameters of each indicator according to your preferences and risk tolerance.
Our Supertrend basic strategy is easy to use and has been tested on various markets and time frames. It can help you capture consistent profits while minimizing your losses.

Seer's HutThis is a strategy based on Exponential Moving Averages or Volume Weighted Moving Averages against Adaptive fib resistance / support level and profit percentage which can be definetly defined by user and targeting small profits(profits will be raised by leverages).
In this strategy, there are predefined values which are collected one by one with statistical background and backtests. This gives an advantage to see which ratios are working better for each symbol. Also this statistics are re-evaluated monthly and if there is a need they are going to be changed with the help of libraries. Also IT IS RECOMMENDED TO USE IN DAILY INTERVAL GRAPHICS!!!!
When we deep dive to strategy, it is based on profit percentages. it is similar to the MOST system. MOST only changes the way with default value of %2. But this hardcoded strategy is not working well with each Symbol.
So this is the point where DC and ADR Statistics are involved.
For Ex. while BTC is suits well with %2, it does not do wonders for RSR or RUNE which is 4-5% for each.
There is 3 options for setting the statistical usage of this indicator.
1. Auto calculated based on 1000 days of ADR and DC
imgur.com
2. Using Library where statistical values are stored.
imgur.com
3. User-defined values used. Yeah you read it right. Fully on-demand changes are supported. Which gives freedom to users for setup their own Adaptive FIB and Profit Percentages.
imgur.com
Based on this 3 options, TP and SL points are calculated on bar closures. Strategy Orders are also shown / raised with the closures.
Ok, system calculates these values but how to read / use them. what is this strategy based on ?
This strategy is mostly looking for minimizing the LOSS in case of any stop. So because of this, in each TP, system gives order signal to close half of the remaining open position.
There are 7 type of orders
OL : Open Long (Close Short and Open Long if in position)
CL 50 : Close Long - %50 of Open Position
CL 100 : Close Long - Close all position
OS : Open Short (Close Long and Open Short if in position)
CL 50 : Close Short - %50 of Open Position
CL 100 : Close Short - Close all position
TP5 : Highest TP reached. Close all position.
Script checks cross of EMA / VWMA and adFib to decide open a position. In reversal / crosses, adFib line had been set to defined Fib. Percentage (FP) level.
For creating the TP points, Profit Percentage (PP) parameter had been used which I briefly introduce at the beginning with the options.
One important topic about this strategy, it is not stacking / pyramiding the positions. Which means, it always calculate one way position. For example we are in the long position after OL signal.
We reached TP values and take profits. Later on due to FP crossing EMA, OS order signal given. This means you have to close all long position and open short position.
But beware. These calculated points are based on given values or calculated regarding to average ADR / DC ratings. For supporting strategy, several methods also had been included in the options.
imgur.com
These are:
1. MA plotting (Optional 4 EMA, 1WMA) - checking for Golden and Death Cross
2. Bollinger Bands (Length 25 and Multiplier 2.5 set as default. Used in correlation with TEMA)
3. Kama 2 / Kama 5 - Crossing speaks of Trend way
4. TEMA (TEMA 50, VWMA 25 calculations and plotting. Used for TEMA 50 / VWMA 25 / SMA 25 cross checks for weakening or strengthening trend analysis)
5. ATR plotting
6. Chandelier Exit plotting (Widely used for calculating Stop levels in market)
7. PSAR (Widely used for indicating trend reversal)
Also for the ease of use, if the users does not want to plot any values on the graph and just want to see the values there is couple of tables also included.
1. EMA info
2. KAMA info
3. Order info
4. TP/SL info
imgur.com
Some important notes:
1. To minimize the stop just after the order opening candle in volatile grounds, system prevents to raise new order signals if there is a signal already raised in last 4 candle.
2. if system reach and give close order in one of the TP points (For Ex TP1.), then index goes down and goes up again same TP (above TP1 in scenario) after 4 candle, system gives a close order signal again in the same TP.
3. There is a Profit Factor value had been shown at Order Info table. This information shows how profitable is the setup regarding to given FP and PP values.
In general market conditions, A Profit Factor above 1.50 is considered good enough and above 2.0 it is considered ideal. A strategy with profit factor less than 1.20 suggests too bigger a risk taken for making money.
In some cases automatic ADR and DC calculations are not good enough. so if you want to find a good Profit Factor value, you can change the system automatic calculation to manual value entering and you can see the results directly with in this field.

LowFinder_PyraMider_V2This strategy is a result of an exploration to experiment with other ways to detect lows / dips in the price movement, to try out alternative ways to exit and stop positions and a dive into risk management. It uses a combination of different indicators to detect and filter the potential lows and opens multiple positions to spread the risk and opportunities for unrealized losses or profits. This script combines code developed by fellow Tradingview community_members.
LowFinder
The lows in the price movement are detected by the Low finder script by RafaelZioni . It finds the potential lows based on the difference between RSI and EMA RSI. The MTF RSI formula is part of the MTFindicators library developed by Peter_O and is integrated in the Low finder code to give the option to use the RSI of higher timeframes. The sensitivity of the LowFinder is controlled by the MA length. When potential lows are detected, a Moving Average, a MTF Stochastic (based the the MTFindiicators by Peter_O) and the average price level filter out the weak lows. In the settings the minimal percentage needed for a low to be detected below the average price can be specified.
Order Sizing and Pyramiding
Pyramiding, or spreading multiple positions, is at the heart of this strategy and what makes it so powerful. The order size is calculated based on the max number of orders and portfolio percentage specified in the input settings. There are two order size modes. The ‘base’ mode uses the same base quantity for each order it opens, the ‘multiply’ mode multiplies the quantity with each order number. For example, when Long 3 is opened, the quantity is multiplied by 3. So, the more orders the bigger the consecutive order sizes. When using ‘multiply’ mode the sizes of the first orders are considerably lower to make up for the later bigger order sizes. There is an option to manually set a fixed order size but use this with caution as it bypasses all the risk calculations.
Stop Level, Take Profit, Trailing Stop
The one indicator that controls the exits is the Stop Level. When close crosses over the Stop Level, the complete position is closed and all orders are exited. The Stop Level is calculated based on the highest high given a specified candle lookback (settings). There is an option to deviate above this level with a specified percentage to tweak for better results. You can activate a Take Profit / Trailing Stop. When activated and close crosses the specified percentage, the Stop Level logic changes to a trailing stop to gain more profits. Another option is to use the percentage as a take profit, either when the stop level crosses over the take profit or close. With this option active, you can make this strategy more conservative. It is active by default.
And finally there is an option to Take Profit per open order. If hit, the separate orders close. In the current settings this option is not used as the percentage is 10%.
Stop Loss
I published an earlier version of this script a couple of weeks ago, but it got hidden by the moderators. Looking back, it makes sense because I didn’t pay any attention to risk management and save order sizing. This resulted in unrealistic results. So, in this script update I added a Stop Loss option. There are two modes. The ‘average price’ mode calculates the stop loss level based on a given percentage below the average price of the total position. The ‘equity’ mode calculates the stop loss level based on a given percentage of your equity you want to lose. By default, the ‘equity’ mode is active. By tweaking the percentage of the portfolio size and the stop loss equity mode, you can achieve a quite low risk strategy set up.
Variables in comments
To sent alerts to my exchange I use a webhook server. This works with a sending the information in the form of a comment. To be able to send messages with different quantities, a variable is added to the comment. This makes it possible to open different positions on the exchange with increasing quantities. To test this the quantities are printed in the comment and the quantities are switched off in the style settings.
This code is a result of a study and not intended for use as a worked out and full functioning strategy. Use it at your own risk. To make the code understandable for users that are not so much introduced into pine script (like me), every step in the code is commented to explain what it does. Hopefully it helps.
Enjoy!

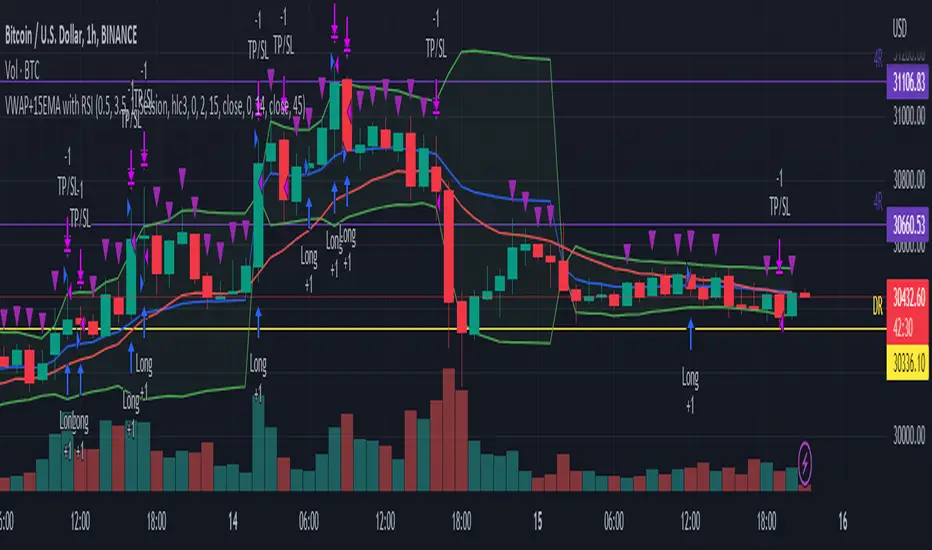
VWAP+15EMA with RSIVWAP+EMA+RSI Strategy for the group MelléCasH
This strategy will enter a long position when the closing price is above both the VWAP and the 15 EMA, and the RSI is above the specified overbought level. It will exit the position when the price falls by the specified stop loss percentage, rises by the specified take profit percentage, or when the trailing stop loss (which trails the highest price achieved after the position was entered by the specified percentage) is hit. The VWAP, EMA, and RSI indicators are also plotted on the chart for reference.
Rebalance by StrategyThaiStrategy Rebalance
Rebalancing trade in the context of cryptocurrency refers to adjusting the composition of a cryptocurrency portfolio to maintain a desired allocation of different digital assets. As the market value of various cryptocurrencies changes over time, the proportion of each asset in the portfolio may deviate from the original target allocation. Rebalancing aims to restore the portfolio to its desired balance, ensuring it remains aligned with the investor's risk tolerance and investment goals.
Here are some steps to rebalance a cryptocurrency portfolio:
Assess your portfolio: Review your current cryptocurrency holdings and their respective market values. Determine the current allocation of each asset as a percentage of your total portfolio value.
Set target allocations: Decide on the target allocation for each cryptocurrency in your portfolio based on your investment goals, risk tolerance, and market outlook. This might involve allocating a higher percentage to more established cryptocurrencies like Bitcoin and Ethereum and a smaller percentage to newer or more volatile digital assets.
Calculate rebalancing amounts: Compare your current allocations with your target allocations. Calculate the amount of each cryptocurrency you need to buy or sell to achieve your target allocations.
Execute trades: Buy or sell the necessary amounts of each cryptocurrency to reach your target allocations. Keep in mind that transaction fees and taxes may apply, depending on your jurisdiction and the trading platform you use.
Monitor and adjust: Regularly review your cryptocurrency portfolio and market conditions. Rebalance as needed to maintain your target allocations and adapt to changing market dynamics.
Rebalancing a cryptocurrency portfolio can help manage risk and potentially enhance returns by ensuring that the portfolio remains diversified and aligned with the investor's objectives. However, it is important to consider the costs and tax implications of frequent rebalancing before implementing this strategy.
##########################################################################
Setting input
Start : start date
End : end date
----
Rebalance Mode :
Normal = Rebalance Always adjust the balance according to the preset proportions. , e.g. 50% of equity.
Fixed Asset = Fixed Asset value. e.g. always Fixed Asset 50% of capital
----
Proportion : Proportion 0.05 = 5% of capital or equity
Min Size Trade value : The minimum that the exchange allows to trade in usdt,usd
Range Price : distance openclose last price (0.01 = 1%)
Use indicator :
Indicator Period : Length

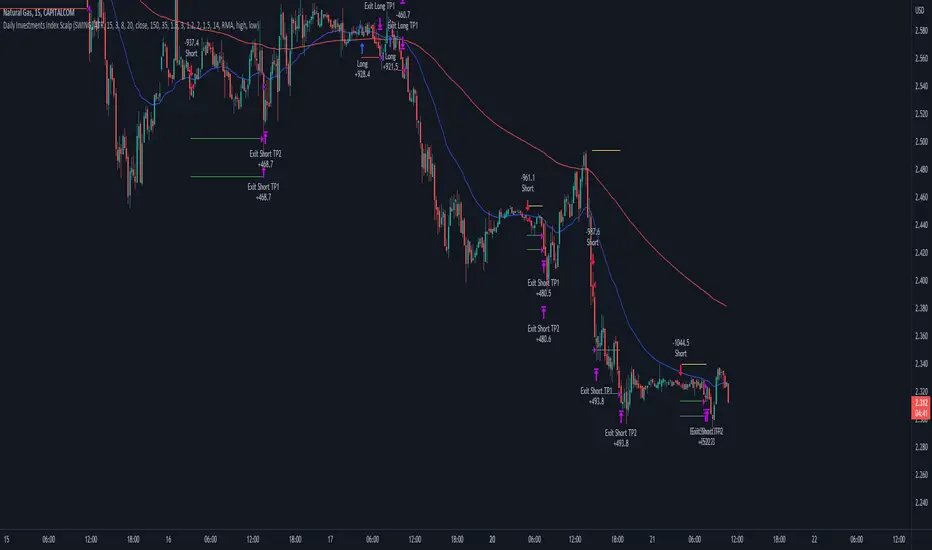
Daily Investments Index ScalpThis strategy is based on the DIDI index with our own confirmations and calculated SL/TP .
You can change every setting if you want it to use for another pair, but this is fine tuned for NATURALGAS
The entries are taken when:
Long:
- Buy signal from the DIDI indicator
- Long EMA is underneath the Short EMA
- Price must be Above the Long EMA
- TP1 (default) - ATR based first TP is ATR * 1.2 Multiplier
- TP2 (default) - ATR based first TP is ATR * 2 Multiplier
- TP2 SL is the strategy entry price when we hit the first TP
- SL (default) - Latest swing low with a look back of 17 candles
Short:
- Sell signal from the DIDI indicator
- Long EMA is Above the Short EMA
- Price must be Below the Long EMA
- TP1 (default) - ATR based first TP is ATR * 1.2 Multiplier
- TP2 (default) - ATR based first TP is ATR * 2 Multiplier
- TP2 SL is the strategy entry price when we hit the first TP
- SL (default) - Latest swing low with a look back of 17 candles
It's fairly simple, and i think you can use this base so extend your own strategy
Good luck :)
If you have any questions, feel free to comment
Cloud X MesoHello there fellow Traders!
Thanks for stopping by, so today I will be covering everything you need to to know about this TradingView strategy.
Below I will discuss everything you need to know about this strategy so you can get a full grasp of what the strategy is, the features, what it does, how it works, the benefits of how this strategy can help you, and the results.
What is Cloud X Meso?
-Cloud X Meso is a strategy that consists of 7 indicators to all line up for total confluence to take a buy or sell once all 6 indicators conditions are met. This strategy does not repaint and doesn't require any technical analysis to be used. The strategy can be used on any timeframe, and any instrument.
-I have optimized many different variations for different types of trading instruments of this strategy ready to be used. The difference of this strategy is that these variations do not need any reoptimization to keep up with recent market conditions since there are hardly any inputs used, which prevents common overfitting problems. The main goal was for this strategy to be automated, as well as plug and play or you can officially consider this as set and forever forget.
What does this strategy do?
-The main goal for this strategy is to catch long or short term trends by waiting for all 7 indicators to line up as well as using customized trading times to trade certain sessions where there is high amounts of volume in the market. This strategy doesn't always need to have a clear trending market, since it can also catch short term trends in choppy markets as well. Overall, the strategy tell you when it buys, sells, and exits after all conditions are met.
How does the strategy work?
-The way that this strategy works is when all of the indicators confluences are met. Next, a buy or sell label will print and the candles colors will color blue or red to show that the trade is in the buy or sell position followed along with a magenta colored line which is the trailing stop to follow the trade until the trade exits from the trailing stop being hit or if the strategies exit condition is met.
-The strategy does have a set Take Profit target since it relies on the trailing stop to end the trade. This is beneficial so you can catch any size of a trend move when the strategy is in high volume market sessions. You catch these trends by customizing the settings to toggle on or off certain indicators, functions, configuring a customized trading time, and toggling on or off certain trading days to make a specific approach for fine tuning a pair to trade in a certain time window with high amounts of volume to catch trending moves whether it be a long or short term trend.
Below I will explain each functionality of the strategy for you to better understand the different ways you can adjust the settings of this strategy.
Backtest Settings:
-You can use these settings to determine a start / end date of what results you would like to see in the strategy tester.
-You can determine the $ amount you would like to see on strategy testers results to be in terms of net profit and max drawdown.
-You can choose whether you want the strategy to take buys only, sells only, or buys and sells.
Automation:
-Compatible with Pine Connectors to fully automate this strategy for MT4/5
-It uses a % based risk when placing trades so you won't have to calculate a proper lot size or dollar amount.
-You can also put the symbol of what that strategy will be trading on so you know what pair its trading.
Custom Trading Times:
-When you customize a trading time for the strategy to trade in, the background will turn blue for that specific time window, and you can use the "Session Exit" function to have trades close once the time window ends when toggled on, or you can have the existing trades close on their own when "Session Exit" is toggled off.
Dynamic Trailing:
-The algorithm uses a volatility based indicator to determine proper stop loss placement depending on how volatile the market is. This will prevent you from guesstimating if your stop loss is too big or too small.
-When Dynamic trailing is off, then the strategy will use a Risk Reward based stop loss to trail everytime the trades hits a new Risk Reward target.
-You can also toggle on or off for the stop loss to go to break even once the trade hits a 1:1 Risk Reward.
Directional Bias Settings:
-This indicator is the main directional bias that uses a multi timeframe function to determine the directional bias, you can also use the Exponential Moving Average as a form of directional bias instead, or you can use both of them to work together to find the directional bias. You can also toggle each one on or off
Entry / Exit Settings:
-This indicator also uses a multi timeframe function but it determines the entry and exit for a trade when all confluences are met. You can also toggle the entry and exit functions on or off.
1 Candle Rule:
-This feature is inspired by No Nonsense Forex (NNFX) the main function of this is if your entry doesn't meet all the entry conditions, then the strategy will wait 1 more candle to meet all the entry conditions to take a trade.
No Trade Zone:
-This feature will uses a Volume based indicator to filter out low volume markets. The candles will turn grey to indicate the algorithm not to take trades, and you can also customize the sensitivity of how strong this indicator will filter out the low volume in the markets.
Indicator functions
Each indicator plays a certain role and also meets certain conditions when a buy or sell trade is placed. I will reveal 3 out of 7 of the indicators used to preserve the uniqueness of this strategy but overall, the logic of this strategies main goal is to ride long or short terms trends while getting dynamic Risk Reward trades.
-The first indicator that the strategy uses an Exponential Moving Average that is customizable, and is used as a form of a filter for either a long or short term directional bias to filter out false signals to help the algorithm trade with the trend.
-The second indicator that the strategy uses is an Oscillator which is the Wavetrend and this indicators functionality for the algorithm is used for the its buy and sell signals to line up with all the other indicators for confluence. This indicator can also be toggled on or off for you own preference
-The third indicator used is the Volume indicator, and this is used to give the other indicators the green light to enter a trade if there are high amounts of volume in the market.
What are the benefits of using this algorithm?
Stress Free Trading:
-Once automated, you will no longer need to stare at the charts all day, as well as trying to execute the trades on time or worried that you missed a setup. Or you can choose to take trades manually when a buy or sell signal comes up
Stress Free Risk Management:
-All you have to do is provide a risk % and the algorithm will do the rest of the work calculating the stop loss, exiting trades, etc. No more needing to find the right lot size, or dollar amount, all in all the strategy will manage the trades for you.
Psychology:
-when you choose to have a systematic trading approach, it eliminates a lot bad habits from human nature
What are the results like?
-I have multiple different variations of results of this strategy, but I will share one of the results.
Here is a screenshot below of what this strategy can do from just one of the variations.
The backtest below was done with another variation on simulating a 100k account risking 0.50% per trade.
Thank you for taking the time to read through this whole guide, and I hope this helped you better understand the strategy.

Negroni MA & RSI Strategy, plus trade entry and SL/TP optionsI will start with the context, and some things to think about when using a strategy tool to back-test ideas.
CONTEXT
FIRST: This is derived from other people's work, but I honestly hadn't found a mixed indicator MA strategy tool that does what this now does. If it is out there, apologies!!
This tool can help back-test various MA trends (SMA, EMA, HMA, VWMA); as well as factoring in RSI levels (or not); and can factor in a fixed HTF MA (or not). You can apply a 'retest entry' or a 'breakout entry', and you can also apply various risk mgt for SL/TP orders: 1) No SL/TP; or 2) a fixed %, or 3) dynamic ATR multipliers.
Find below, some details explaining what this tool is attempting to do.
Thank you, tack, salute!
THINGS TO REVIEW (it is not just about 'profitability'!!)
Whilst discretion is always highly encouraged as a trader, and a 100% indicator-driven strategy is VERY unlikely to yield sustainable results going forward, at the very least back-testing your strategies can help provide some guidance, not just on win rate Vs profit factor, but other things including:
a) Trade frequency: if a strategy has an 75% win rate and profit factor of 4, with all your parameters and confluence checks, but only triggers 3 trades every 5 years, is that realistically implementable to your trading situation if you have a $10,000 account?
b) Trade entry type: is it consistently better to wait for a retest of an 'MA zone', or is it better to market buy/sell on breakout of the 'MA zone'?
c) Risk management (SL/TP): is it consistently better to have a fixed static % for SL/TP ("I always place my stops 2% away, whether it is EURUSD or BTCUSDT"), or would you be better placed to try using an ATR multiplier of the respective assets?
d) Moving average type: is your old faithful 100 EMA really serving you well, or is the classic SMA more reliable, or how about the HMA, or the VWMA? Is the 100/200 cross holding up, or do you need something more sensitive? Is there any significant difference between a 10 EMA/20 EMA trend zone compared to a 13 EMA /25 EMA zone?
e) Confluence: Do added confluence checks (RSI, higher timeframe MA) actually improve profitability? But even if they do, is at the cost of cutting too many trades?
INPUTS AND PARAMETERS
Choice 1) Entry Strategy: Retest or Breakout - You can select both!
[ ]:
a) RETEST entry strat: price crosses UNDER FastMA INTO the 'MA trend zone'.
b) BREAKOUT entry strat: price crosses OVER FastMA OUT the 'MA trend zone'.
Choice 2) Risk Management (SL and TP) - You can select more than 1 strategy!
a) No SL/TP: Long trades are closed when the LOW crosses back UNDER the fastMA again, and shorts are closed when the HIGH crosses back OVER the fastMA again.
b) Static % SL/TP: Your SL/TP will be a fixed % away from avg. position price... WARNING: You should change this for various asset classes; FX vol is not the same as crypto altcoin vol!
c) Dynamic ATR SL/TP: Your SL/TP is a multiple of your selected ATR range (default is 50, see 'info' when you select ATR range). ATR accounts for the change in vol of different asset classes somewhat, HOWEVER... you should probably still not have the same multiplier trading S&P500 as you would trading crypto altcoins!
Then select your preferred parameters: EMA, SMA, HMA, VWMA, etc. You can mix and match, and most options have a info/tooltip guide.
RSI note: If you don't care for RSI levels, then set buy signal at 1... i.e always buys! Similarly set sell signal at 99.
ATR note: standard ATR length is usually 14, however... your SL/TP will move POST entry, and can tighten or widen your initial SL/TP... for better AND usually for worse! Go find a trade (strat 3) on the chart, look at the SL/TP lines, now change the number to 5, you'll see.
Fixed HTF MA note: If you don't care for HTF MA confluence, just change the timeframe/options to match the 'Slow MA' options you've chosen.

Fibonacci Moving Averages Input(FibMAI) Fibonacci Moving Averages Input is a strategy based on moving averages cross-over or cross-under signals. The bullish golden cross appears on a chart when a stock's short-term moving average crosses above its long-term moving average. The bearish death cross appears on a chart when a stock’s short-term moving average, crosses below its long-term moving average. The general market consensus values used are the 50-day moving average and the 200-day moving average.
With the (FibMAI) Fibonacci Moving Averages Input strategy you can use any value you choose for your bullish or bearish cross. For visual display purposes I have a lot of the Fib Moving Averages 1, 2, 3, 5, 8, 13, 21, 34, 55, 89, 144, 233, 377, 610, 987 shown while hiding the chart candlesticks. But to use this indicator I click on only a couple of MA's to see if there's a notable cross-over or cross-under pattern signal. Then, most importantly, I back test those values into the FibMAI strategy Long or Short settings input.
For example, this NQ1! day chart has it's Long or Short settings input as follows:
Bullish =
FibEMA34
cross-over
FibEMA144
Bearish =
FibEMA55
cross-under
FibSMA144
As you can see you can mix or match 4 different MA's values either Exponential or Simple.
Default color settings:
Rising value = green color
Falling value = red color
Default Visual FibMA settings:
FibEMA's 1, 2, 3, 5, 8, 13, 21, 34, 55, 89, 144, 233, 377, 610, 987, 1597, 2584, 4181
Default Visual MA settings:
SMA's 50, 100, 150, 200
Default Long or Short settings:
Bullish =
FibEMA34
cross-over
FibEMA144
Bearish =
FibEMA55
cross-under
FibSMA144

NIFTY 50 5mint StrategyThis is an intraday strategy for NIFTY50 Based First candle High and Low breakout.
The strategy takes user inputs for the start and end dates, start and end months, and start and end years, which define the time range to trade. The user can also specify the maximum number of trades to take during the time range and the length of the Exponential Moving Average ( EMA ) used in the strategy
In this strategy, the First candle's high and low are calculated and used as entry and exit points for trades. If the close price breaks above the First candle's high, a buy signal is generated. Conversely, if the close price breaks below the First candle's low, a sell signal is generated.
The strategy uses the Exponential Moving Average ( EMA ) as a filter to close entered positions either long or short, EMA also acts Target. If the close price falls below the EMA, a long position is closed, and if the close price rises above the EMA, a short position is closed or the PreviousCandleClose is above the First candle's high a short position is closed, When the PreviousCandleClose is below the First candle's low a long position is closed, First candle's high act as Stoploss
The strategy limits the number of trades taken within the specified time range, and if the time range is exceeded, all positions are closed.
Finally, the strategy plots the First candle's high and low, EMAs on the chart for visual reference.
Default settings work best with the 5mint candle, you may tweak settings according to your needs.
backtesting helps in interpreting how the trading strategy would have behaved in the past, and forward testing (paper trading) informs the traders how it would perform now.

Ema ScalpThis is another simple strategy based on ema
Entry Buy - 1) when close crossover ema then buy and only open one trade till it not close
2) if previous buy trade is profitable open another trade and check again trade is profitable or not
3)if trade is not profitable reset and wait for sell condition...
Entry Sell -1) when close crossunder ema then sell and only open one trade till it not close
2) if previous sell trade is profitable open another trade and check again trade is profitable or not
3) if trade is not profitable reset and wait for buy condition.....
stop loss and take profit is percentage based ...

Wunder Volatility botWunder Volatility bot
We have used the Average True Range (ATR) in many of its trading versions.
1. ATR with MA. This indicator includes the ATR as well as the simple moving average, which helps to restore the expected market.
2. We apply percentage based ATR to determine how volatile the market is and whether to buy or sell at that time. For trading, we will filter the market and make trades only within the specified range. This range will adjust depending on the asset, so you will need to change the settings if you are trading multiple assets.
3. A function for calculating risk on the portfolio (your deposit) has been added to the Wunder Volatility bot script. When this option is enabled, you get a calculation of the entry amount in dollars relative to your Stop Loss. In the settings, you can select the risk percentage on your portfolio. The loss will be calculated from the amount that will be displayed on the chart.
For example, if your deposit is $1000 and you set the risk to 1%, with a Stop Loss of 5%, the entry volume will be $200. The loss at SL will be $10.10, which is your 1% risk or 1% of the deposit.
**Important!** The risk per trade must be less than the Stop Loss value. If the risk is greater than SL, then you should use leverage.
The amount of funds entering the trade is calculated in dollars. This option was created if you want to send the dollar amount from Tradingview to the exchange. However, putting your volume in dollars you get the incorrect net profit and drawdown indication in the backtest results, as TradingView calculates the backtest volume in contracts.
To display the correct net profit and drawdown values in Tradingview Backtest results, use the ”Volume in contract” option.

Strategy Myth-Busting #13 - MultiEMA+BXTrender - [SP/MYN]#13 on the Myth-Busting bench, we are automating the "I Found The Highest Win Rate 15 Minute Scalping Trading Strategy Ever" strategy from "TradeIQ" who claims to have backtested this manually and achieved 410% profit over 100 trades within 6 months on Natural Gas with 79 Wins / 21 Losses with an astounding 3.96% Max Drawdown.
It was quite challenging emulating the same subjective EMA pullback logic along with the dependent sequencing of events necessary to enter a trade and we might improve on this to make it better in the future. Super kudos to @spdoinkal who helped with this strategy. If you have ideas on how this could be improved on, would love to hear about them.
As is, we were unable to substantiate similar results to what was manually backtested by TradeIQ, we do however see potential here. Given some optimizations and improvements to the the entry logic accommodating for a wider more variable margin after pullbacks reestablish above/below the fast EMA we think the performance of this strategy could certainly be improved upon. So not sure if we have totally myth busted this completely at this point in time.
This strategy uses a combination of 2 open-source public indicators:
3 EMA's (Trading View Internal)
B-Xtrender by Puppytherapy
Three separate (21), (89) and (200) EMA's are used as a means to confirm and keep entry out of ranged markets. When the 3 EMA's are all clumped up together with no distance it's indicative of a flat or ranged market. This is then used in conjunction with B-XTrender as a means to detect the trend direction. B-XTrender which is a trend following indicator originally published in the IFTA Journal by Bharat Jhunjhunwala. It uses both a short and long term lengths along with a compound EMA used as a means to smooth and sample trend direction.
Trading Rules
15 min candles but other lower time-frames
Stop Loss on previous swing high/low
No Take Profit, Exit on new red/green circles from BX-Trender
Long
EMA Green (21) on top, White (89)in middle and red (200) on bottom and there is distance between EMA's need to be spaced, otherwise in a ranged market
Price action must pull back into 89 EMA (White line) either close or touching it.
Once pullback occurs wait for BX Trender to issue a new green circle and BX Trend line must be green and above 0
Price action must also pull up back above the (Green Line) EMA 21
Short
EMA Red (200) on top, White (89) in middle and Green (21) on bottom and there is distance between EMA's need to be spaced, otherwise in a ranged market
Price action must pull back into 89 EMA (White line) either close or touching it.
Once pullback occurs wait for BX Trender to issue a new red circle and BX Trend line must be red and below 0
Price action must also pull up back below the (green Line) EMA 21
If you know of or have a strategy you want to see myth-busted or just have an idea for one, please feel free to message me.
