CandleMapTF - Automatic Candle Structure Tool [PRO]Description:
This Pine Script creates an "Automatic Candle Structure Tool " for TradingView that visually manages market structure and dealing ranges across multiple timeframes.
All elements, including colors, opacity, and displayed levels are fully customizable.
Disclaimer:
This script is for educational and informational purposes only and does not
constitute financial advice, investment advice, or a trading recommendation.
Use at your own risk.
Educational

Scalping ~ Maniesh🔥 Fibonacci Scalping Indicator
This indicator is built for precision scalping using ACR (Average Candle Range) combined with Fibonacci-based premium & discount zones.
It helps traders identify high-probability reaction areas instead of chasing random moves.
🧠 Indicator Logic
Calculates ACR to understand current market volatility
Uses Fibonacci levels on the ACR range
Clearly marks Premium & Discount zones
Helps filter overextended price moves
Designed for reaction-based scalping, not blind entries
⏱ Best Timeframes
1m / 3m
Works best during London & New York sessions
📌 How to Use
Look for price reaching Fib
Wait for price reaction or confirmation
Enter scalps with tight stop-loss
Ideal for quick entries & partial exits
This indicator does not give buy/sell signals.
It is a framework tool to improve execution and timing.
⚠️ Disclaimer
Trading involves risk.
Always use proper risk management and backtest before live trading.

ATR CANDLESDynamic support and resistance are formed by the bodies and wicks of ATR candles, creating price zones with “height” rather than exact lines where price often pulls back and reacts. For a trailing stop, trades are held as long as candle color remains in the trend direction, with stops placed beyond the previous ATR candle; an opposite-color candle signals exit.

Udta Teer Its normal vwap which is already available in tradingview. But it has added bands with help of AI

SK BAND SK BAND is a powerful TradingView indicator designed to generate clear and reliable Buy & Sell signals by identifying market trend and price momentum. It helps traders make disciplined and confident trading decisions across different market conditions.
🔹 Key Features
✔ Clear BUY and SELL signals on the chart
✔ Works on Stocks, Indices, Forex, Crypto & Commodities
✔ Suitable for Intraday, Swing, and Positional trading
✔ Helps identify trend direction and momentum
✔ Simple, clean, and beginner-friendly
📈 How It Works
BUY signal appears when bullish momentum strengthens
SELL signal appears when bearish momentum increases
For better accuracy:
Use proper risk management
Confirm signals with support & resistance or higher timeframes
Avoid sideways or low-volume markets
⚠ Disclaimer
This indicator is for educational purposes only.
SK BAND does not provide financial advice. Trading involves risk—always confirm signals with your own analysis.

Mawhoob (TD - Trend Direction) - v1.1Mawhoob (Trend Direction - TD) Indicator v1.1
Professional Trend Analysis & Market Context Dashboard
----------------------------------------------------
🎯 Overview
----------------------------------------------------
Mawhoob (Trend Direction - TD) is a comprehensive, professional-grade technical analysis tool designed to provide traders with multi-dimensional market insights. This advanced indicator combines a proprietary adaptive trend line with real-time market context data, offering a complete market analysis solution in one elegant package.
✨ Key Features ✨
----------------------------------------------------
📈 Trend Direction Line (TD Line)
----------------------------------------------------
Intelligent Moving Average System: Utilizes a sophisticated blend of EMA, RMA, and WMA with smart adaptive error correction.
1- Dynamic Color Coding:
🟢 Green: Bullish trend (price momentum upward).
🔴 Red: Bearish trend (price momentum downward).
2- Customizable Parameters:
Main Period (1-200): Control long-term vs. short-term sensitivity.
Fast Period (0-50): Fine-tune responsiveness to price changes.
Weighting Factor (0-3): Adjust current price influence on the trend line.
3- Visual Bands: Optional upper and lower bands that create a dynamic channel around the trend line.
----------------------------------------------------
📊 Real-Time Market Dashboard
----------------------------------------------------
A comprehensive information panel displaying multiple technical indicators and market dominance metrics.
Technical Indicators Section:
1- RSI (Relative Strength Index)
Current value with color-coded momentum indication.
Direction status: UP / DOWN / NEUTRAL.
Customizable overbought/oversold levels.
Includes RSI SMA for trend confirmation.
2- MACD (Moving Average Convergence Divergence)
Real-time MACD line value.
Trend direction based on MACD vs. Signal line relationship.
Fully customizable fast, slow, and signal periods.
3- ADX (Average Directional Index)
Trend strength measurement.
Color-coded display: Strong vs. Weak trend.
Adjustable strength threshold.
Market Dominance Section:
1- DXY (US Dollar Index)
Real-time dollar strength tracking.
Direction indicator for forex correlation analysis.
2- BTC.D (Bitcoin Dominance)
Bitcoin market dominance percentage.
Useful for crypto market sentiment analysis.
3- USDT.D (Tether Dominance)
Stablecoin dominance tracking.
Risk-on/risk-off market indicator.
All dominance metrics feature:
Customizable timeframe selection.
UP/DOWN/NEUTRAL directional indicators.
Color-coded values for quick visual assessment.
----------------------------------------------------
🔔 Alert & Signal System
----------------------------------------------------
Price Crossover Alerts: Get notified when price crosses above or below the TD line.
Smart Alert Logic: Filters out neutral/flat market conditions to reduce noise.
Visual Signals: Optional triangle markers on chart (▲ bullish, ▼ bearish).
Once-Per-Bar Frequency: Prevents alert spam while ensuring you don't miss opportunities.
----------------------------------------------------
🎨 Visual Customization
----------------------------------------------------
Candle Color Mode: Option to color candles based on trend direction.
Dashboard Positioning: Choose LEFT, RIGHT, or CENTER placement.
Text Size Options: TINY, SMALL, NORMAL, or LARGE for optimal readability.
Customizable colors for Bullish/Bearish trend lines.
Customizable colors for dashboard backgrounds and borders.
Customizable colors for UP/DOWN/NEUTRAL status indicators.
----------------------------------------------------
📚 Use Cases
----------------------------------------------------
For Day Traders
Quick trend identification with color-coded TD line.
Real-time momentum gauges (RSI, MACD).
Instant crossover alerts for entry/exit timing.
For Swing Traders
Medium-term trend direction with adjustable periods.
ADX strength indicator for high-probability setups.
Market dominance context for broader market analysis.
For Crypto Traders
BTC.D and USDT.D tracking for altcoin season detection.
Integrated multi-indicator analysis.
Customizable timeframes for dominance metrics.
For Multi-Market Analysis
DXY correlation for forex and commodities.
Comprehensive dashboard for quick market scans.
Cross-market sentiment analysis.
----------------------------------------------------
⚙️ Settings & Customization
----------------------------------------------------
Trend Direction Settings
Main TD Period: Adjust overall trend sensitivity.
Fast TD Period: Control responsiveness (0 = no smoothing).
Weighting Factor: Balance between historical and current prices.
Line width and colors for visual preference.
Optional trend bands with adjustable transparency.
Dashboard Settings
Toggle individual indicators on/off.
Customize all indicator periods and thresholds.
Choose timeframe for dominance indices.
Adjust colors, position, size, and borders.
Complete visual control for your trading style.
Alert & Signal Settings
Enable/disable crossover alerts.
Optional visual signals on chart.
Smart built-in filtering to reduce false signals.
----------------------------------------------------
🎓 Best Practices
----------------------------------------------------
Trend Following: Use the TD line as your primary trend filter - trade with the color.
Confirmation: Combine TD direction with RSI and MACD for higher probability setups.
Strength Filter: Use ADX to avoid weak/choppy trends.
Market Context: Check dominance indicators for broader market sentiment.
Alerts: Set alerts to catch reversals without constant chart watching.
----------------------------------------------------
🚀 What Makes This Indicator Special ?
----------------------------------------------------
✅ All-in-One Solution: Multiple professional indicators in one clean package.
✅ Adaptive System: Responds to market conditions, not just static calculations.
✅ Professional Dashboard: Institutional-grade information display.
✅ Real-Time Data: Live updates from multiple markets and assets.
✅ Highly Customizable: Tailor every aspect to your trading style.
✅ Clean Code: Optimized Pine Script v6 for maximum performance.
✅ No Repainting: Uses (barstate.isconfirmed) to ensure calculations only occur on closed bars.
✅ Resource Efficient: Smooth performance even with all features enabled.
----------------------------------------------------
🎯 Perfect For
----------------------------------------------------
Trend identification and following.
Multi-timeframe analysis.
Market sentiment tracking.
Entry and exit timing.
Portfolio management decisions.
Risk assessment through trend strength.
Correlation analysis across markets.
----------------------------------------------------
📝 Notes
----------------------------------------------------
All calculations are performed on confirmed bars to prevent repainting.
Dashboard updates in real-time as market conditions change.
Dominance indices (DXY, BTC.D, USDT.D) require market data access.
Best results achieved when combined with proper risk management.
Suitable for all markets: stocks, forex, crypto, commodities, indices.
----------------------------------------------------
💡 Pro Tips
----------------------------------------------------
Start with default settings and adjust based on your timeframe.
Lower periods (5-10) for scalping, higher (20-50) for swing trading.
Use the dashboard as a quick health check for your current positions.
Combine TD line with support/resistance for confluence.
Watch dominance indicators for early market regime changes.
----------------------------------------------------
⚠️ Important Notes
----------------------------------------------------
This indicator is for educational and informational purposes only.
Always confirm signals with your own analysis before trading.
Use proper risk management and position sizing.
The indicator works on all timeframes and instruments.
Past performance does not guarantee future results.
----------------------------------------------------
🔄 Updates & Support
----------------------------------------------------
Current Version: v1.1
This indicator is actively maintained and updated. Future versions may include additional features and improvements based on user feedback.
----------------------------------------------------
🙏 Acknowledgments
----------------------------------------------------
Created & designed by: @mawhoobx
📝 Remember: The best indicator is the one combined with proper risk management, discipline, and a solid trading plan. This tool is designed to assist your analysis, not replace your judgment.
Trade Smart. Trade Safe. Trade Profitable.

Killzones & DoL's by @mohtradesThe KillZones & DoLs indicator is a comprehensive tool designed for ICT and institutional traders. It provides a clean, customizable way to visualize key time-based levels, killzone sessions, and daily/weekly/monthly statistics directly on your chart.
Key Features
1. Killzones & Sessions
Visualize the three major trading sessions with customizable boxes and time ranges:
Asia Range: Default 20:00 - 00:00 (NY Time)
London Killzone: Default 02:00 - 05:00 (NY Time)
New York Killzone: Default 09:30 - 16:00 (NY Time)
Killzone Tools:
Boxes: Draw highlighted boxes for each session.
Pivots: Automatically mark the High and Low of each session.
Midpoints: Optionally show the 50% equilibrium level of the session range.
Extensions: Extend pivot lines until they are mitigated (price touches them) or keep them for a set duration.
Alerts: Get notified when a session High or Low is broken.
2. Highs & Lows (HTF Levels)
Track significant liquidity levels from higher timeframes without switching charts:
Previous Day High/Low (PDH/PDL)
Previous Week High/Low (PWH/PWL)
Previous Month High/Low (PMH/PML)
Current High/Low of Day (HOD/LOD): Tracks the developing high and low of the current day.
Current High/Low of Week (HOW/LOW): Tracks the developing high and low of the current week.
3. Opening Price Lines
Mark key opening prices to use as support/resistance or bias confirmation:
True Day Open (00:00 NY)
Week Open
Month Open
Custom Open Lines: Configure up to 8 custom time-based open price lines (e.g., 06:00, 10:00, 14:00).
4. Separators & Statistics
Period Separators: Vertical lines marking the start of new Days, Weeks, or Months.
Range Table: Display the range (in pips/points) of recent sessions and their average to gauge volatility.
Customization
Timezone: Fully adjustable to your preferred timezone (default America/New_York).
Styling: Customize colors, line styles, widths, and label sizes for all elements.
Drawing Limits: Optimize chart cleanliness by limiting historical drawings to the last N days.
How to Use
Add the indicator to your chart.
Open Settings to enable/disable specific Killzones (Asia, London, NY).
Enable "Show PDH/PDL" or "Show HOW/LOW" to track liquidity.
Set your convenient timezone (typically NY for ICT concepts).
Use alerts to catch liquidity runs on session pivots.

SS Critical NSE Pair Trading Dashboard [10 Pairs]This dashboard finds live pair trading opportunities in NSE.
For Educational use only

EV Algo SMT 15m on 1mEV Algo SMT is a multi-timeframe SMT divergence indicator that compares price action between two correlated markets.
It uses higher timeframe pivots while plotting signals on a lower timeframe chart, helping identify potential bullish and bearish divergences with confirmation on candle close.

Luis-Enrico Future to CFD Price CalculatorThis tool converts a futures price into the corresponding CFD price, including entry, stop loss, and optionally take profit levels.
It provides a simple way to align trade levels between futures and CFDs.
Custom CFD Selection
The CFD instrument can be custom-selected from brokers available on TradingView, allowing the calculation to reflect the user’s specific CFD feed.
Intended Use
Designed for quick trade level conversion between futures and CFDs, supporting discretionary analysis and planning.

Forex Sniper @24 Support is based on Asia high and low , plus shows New York sessions and London
Background with out cuts only shows volativity times

PCR Sentiment & Max Pain by Rakesh Sharma🎯 PCR + SENTIMENT + MAX PAIN INDICATOR
Track options market sentiment to catch reversals before they happen! See where smart money is positioning through Put-Call Ratio analysis.
✨ KEY FEATURES:
- PCR (Put-Call Ratio) with visual zones
- Market Sentiment Analysis (Bullish/Bearish/Neutral)
- Max Pain Level calculation (expiry day advantage)
- Automatic Buy/Sell signals at extreme levels
- Real-time dashboard with actionable insights
- Fear & Greed gauge
- Trading action recommendations
🎯 PERFECT FOR:
Nifty, Bank Nifty, Index Options - Intraday & Swing Trading
⚡ TRADING SIGNALS:
- PCR > 1.5 = Market oversold (Fear) → BUY signal
- PCR < 0.7 = Market overbought (Greed) → SELL signal
- Extreme levels trigger STRONG signals
- Contrarian indicator - Trade against the crowd!
💡 UNIQUE ADVANTAGE:
Combines options sentiment with price action for high-probability reversals. Know when institutions are bullish or bearish!
Created by: Rakesh Sharma

Stationary Notes (Paragraph Box)This indicator helps you journal and notate any analysis’s you’ve made and display them while remaining stationary.

Mawhoob (OBs & FVGs) - v1.1Mawhoob (OBs & FVGs) - v1.1
Professional Market Structure Indicator
----------------------------------------------------
🎯 Overview
----------------------------------------------------
Mawhoob (OBs & FVGs) - v1.1 is a comprehensive technical analysis indicator designed to identify and track two of the most powerful concepts in modern price action trading: Order Blocks (OBs) and Fair Value Gaps (FVGs). This indicator provides traders with automated detection, visualization, and real-time alerts for these key market structure elements, helping you identify high-probability trading zones and potential reversal areas.
----------------------------------------------------
🔍 What Are Order Blocks and Fair Value Gaps?
----------------------------------------------------
✅ Order Blocks (OBs)
Order Blocks represent areas where institutional players have placed significant orders, creating imbalances in supply and demand. These zones often act as strong support or resistance levels where price tends to react when revisited.
* Bullish Order Block (OB+): Forms when a bearish candle is immediately followed by a strong bullish candle that closes above the previous candle's high, indicating institutional buying interest.
* Bearish Order Block (OB-): Forms when a bullish candle is immediately followed by a strong bearish candle that closes below the previous candle's low, indicating institutional selling pressure.
✅ Fair Value Gaps (FVGs)
Fair Value Gaps are price inefficiencies that occur when the market moves too quickly, leaving unfilled price ranges. These gaps often get "filled" or "mitigated" as price returns to seek liquidity and balance.
* Bullish Fair Value Gap (FVG+): Forms when there's a gap between the high of two candles ago and the low of the current candle in an upward move.
* Bearish Fair Value Gap (FVG-): Forms when there's a gap between the low of two candles ago and the high of the current candle in a downward move.
----------------------------------------------------
✨ Key Features ✨
----------------------------------------------------
✅ Order Blocks (OBs) Module:
Detection & Visualization
Automatic OB Detection: Identifies both bullish and bearish order blocks in real-time.
Customizable Display: Show up to 50 order blocks simultaneously.
Visual Distinction: Separate color schemes for bullish and bearish order blocks.
Smart Labeling: Optional OB+/OB- labels for easy identification.
Advanced Filtering Options
Strong OBs Filter: Option to display only "super/strong" order blocks.
FVG Confirmation Filter: Show only order blocks that are immediately followed by fair value gaps for higher confluence.
Flexible Filtering: Use filters independently or combine them for maximum selectivity
Mitigation Tracking
Real-time Monitoring: Automatically tracks when order blocks are "filled" or mitigated by price.
Display Control: Choose whether to show or hide filled order blocks.
Customization Options
Color Settings: Fully customizable colors for bullish/bearish order block zones.
Transparency Control: Adjustable box background transparency.
Border Styles: Choose between Solid, Dashed, or Dotted borders.
Extension Options: Extend boxes to the right or stop at mitigation point.
Label Size: Select from Auto, Tiny, Small, Normal, or Large label sizes.
✅ Fair Value Gaps (FVGs) Module:
Detection & Visualization
Automatic FVG Detection: Identifies both bullish and bearish fair value gaps.
Customizable Display: Show up to 50 FVGs simultaneously.
Visual Distinction: Separate color schemes for bullish and bearish gaps.
Smart Labeling: Optional FVG+/FVG- labels for clarity.
Advanced Filtering Options
Strong FVGs Filter: Display only significant gaps formed by strong candles.
OB Confirmation Filter: Show only FVGs that follow order blocks for enhanced reliability.
Independent Settings: Completely separate filtering from order block module.
Mitigation Tracking
Gap Fill Detection: Automatically detects when price fills the fair value gap.
Visual Updates: Filled gaps change appearance to indicate completion.
Display Options: Control visibility of filled versus unfilled gaps.
Customization Options
Full Color Control: Independent color settings for bullish/bearish FVGs.
Transparency Management: Adjustable transparency levels.
Border Customization: Multiple border style options.
Extension Control: Choose how gaps extend on the chart.
Label Customization: Adjustable label sizes and colors.
----------------------------------------------------
🔔 Alerts & Signals
----------------------------------------------------
Alerts System
Real-time Notifications: Receive instant alerts when new OBs or FVGs are detected.
Separate Alert Channels: Independent alerts for order blocks and fair value gaps.
Price Information: Each alert includes the current price level.
Frequency Control: Alerts trigger once per bar to avoid spam.
Visual Signals
On-Chart Markers: Optional visual signals (circles/diamonds) at detection points.
Color-Coded: Bullish signals below bars, bearish signals above bars.
Toggle Control: Enable/disable signals independently from alerts.
----------------------------------------------------
📋 How to Use This Indicator?
----------------------------------------------------
For Trend Following
Look for Bullish OBs and FVGs in uptrends as potential entry zones.
Look for Bearish OBs and FVGs in downtrends as potential entry zones.
Use unmitigated zones as key support/resistance levels.
For Reversal Trading
Watch for price reactions when approaching order blocks.
Combine multiple timeframe analysis for higher probability setups.
Use the "Strong" filters to focus on the most significant zones.
For Confluence Trading
Enable "Show Only (OBs) that Followed by (FVGs)" filter.
Enable "Show Only (FVGs) that Follow (OBs)" filter.
Trade only when both structures align for maximum confluence.
Risk Management
Monitor when zones become mitigated (filled).
Use multiple timeframes to identify nested zones.
Combine with your existing trading strategy for confirmation.
----------------------------------------------------
⚙️ Recommended Settings
----------------------------------------------------
For Scalping (1m - 5m timeframes)
Display: 15-20 boxes.
Enable: Strong filters.
Disable: Show mitigated zones.
For Day Trading (15m - 1H timeframes)
Display: 20-30 boxes.
Enable: Confluence filters when needed.
Enable: Show mitigated zones for context.
For Swing Trading (4H - Daily timeframes)
Display: 30-50 boxes.
Enable: All zones for comprehensive analysis.
Enable: Confluence filters when needed.
Enable: Show mitigated zones for context.
----------------------------------------------------
💡 Pro Tips
----------------------------------------------------
Multiple Timeframe Analysis: Use the indicator on multiple timeframes to identify nested order blocks and FVGs for stronger setups.
Confluence Zones: Areas where OBs and FVGs overlap often provide the highest probability trades.
Mitigation Matters: Pay attention to how quickly and cleanly zones are mitigated - clean mitigations often indicate institutional interest.
Filter Combinations: Experiment with different filter combinations to find what works best for your trading style.
Alert Management: Set up alerts for both OBs and FVGs to never miss potential setups.
----------------------------------------------------
⚠️ Important Notes
----------------------------------------------------
This indicator is for educational and informational purposes only.
Always confirm signals with your own analysis before trading.
Use proper risk management and position sizing.
The indicator works on all timeframes and instruments.
Past performance does not guarantee future results.
----------------------------------------------------
🔄 Updates & Support
----------------------------------------------------
Current Version: v1.1
This indicator is actively maintained and updated. Future versions may include additional features and improvements based on user feedback.
----------------------------------------------------
🙏 Acknowledgments
----------------------------------------------------
Created by @mawhoobx - Designed to help traders identify institutional footprints and market inefficiencies for better trading decisions.

UIA TrendCompass V1.0UIA TrendCompass v1.0 is a market structure interpretation tool designed to visualize trend states in real time.
The script identifies four structural states based on price behavior and trend continuity:
• T — Trend Start
• E — Trend Extension
• H — Structural High / Low
• X — Trend Exit / Reversal
This indicator is intended for market structure analysis and educational purposes only.
It does NOT provide trading signals, buy/sell recommendations, or investment advice.
All labels are generated based on historical price data and do not predict future market movements.
Users should combine this tool with their own analysis and risk management framework.
This script is provided "as is" with no guarantee of accuracy or performance.

ORB M15 Fibo din ORB EMA200 MTFTesting a new idea based on ORB m15. Still on testing, not worth it to translate it into English

Enhanced OB [promuckaj]THE ENHANCED ORDER BLOCK
Someone could think what is EOB, it should be just ordinary order block but that’s far from the truth. Sometime the classic order blocks work like a charm, then more often it doesn’t work.
If we expecting lower prices to kick in bearish and we see them create a bullish candle leaving a decent sized wick on the bottom, we want to wait for the next candle to completely close below the bullish candle.
When we see this, it should be our signal to sell the market. When price does this, it is a clear indication that price want to continue lower.
Once EOB is confirmed, look to enter short during the next candles PO3. Usually it’s going to go up but all you need is to wait that very next bar to confirm-respect our new formed EOB.
There is many ways to play this and anticipate some of the liquidity below as your safe TP target. Just imagine to use EOB from HTF on LTF. If you can then this indicator is for you, because it is exactly what is doing, it plots EOB from HTF, with lines that clearly present the last two HTF bars (bars that form the EOB), together with EOB zone of interest – from where we want to see price to pullback and respect the narrative – in this example that we are going down.
So let’s take a look how the same example (30min TF) will be on lower timeframe, for example on 1min.
... or maybe on 30 seconds timeframe.
So let’s try to play this example, with any kind of entry model. For example here we have practically the same scenario, green bar with red closed below, after price tap into EOB zone from HTF.
In this example we can anticipate entry at the pullback in LTF EOB zone, or simply from the FVG formed in the EOB confirmation bar, that is the proof that this zone will hold and push us further lower.
For target as our TP we could use simple internal structure and nearest liquidity left behind.
Easy and quick 4.6R trade.
Or if we would like to go further, this could be even better RR.
Practically almost 10R.
Let’s switch back now to 30min TF, to see how this actually look on respective timeframe of our EOB.
I hope it is more then clear, how this could be used.
There is option to change colors, lines and size of labels, including option to mark the FVG that is a part of EOB, if there is.
Also alerts is there, so you will not miss any new EOB that form on your HTF.
Enjoy !

HMG Tools: BacktestHMG Tools is a chart utility indicator designed to improve organization, discipline, and visual context for discretionary traders.
This script does not generate buy or sell signals and does not provide investment advice. Its purpose is to enhance the trading workspace by combining several practical tools into a single configurable indicator.
Main features:
- Sticky notes to write trading rules, reminders, or daily bias directly on the chart
- Custom watermark for chart identification and visual clarity
- Chart information display, including symbol, timeframe, and current date
- DayOff (weekend highlight) to visually mark Saturdays and Sundays and trigger an alert to avoid trading during market closure
Purpose:
This indicator helps traders keep charts clean and structured, avoid common operational mistakes (such as trading on weekends), maintain discipline through visible notes, and improve consistency in manual trading.
This tool is intended for educational and organizational purposes only.
--------------------------------------------------
HMG Tools es un indicador de utilidad diseñado para mejorar la organización, disciplina y contexto visual del trader.
Este script no genera señales de compra o venta ni constituye asesoramiento de inversión. Su objetivo es optimizar el entorno de trading combinando varias herramientas prácticas en un solo indicador.
Funciones principales:
- Notas adhesivas para reglas, recordatorios o sesgo diario
- Watermark personalizable para identificación visual
- Información de símbolo, temporalidad y fecha
- Aviso DayOff para evitar operar en fin de semana
Uso educativo y organizativo.

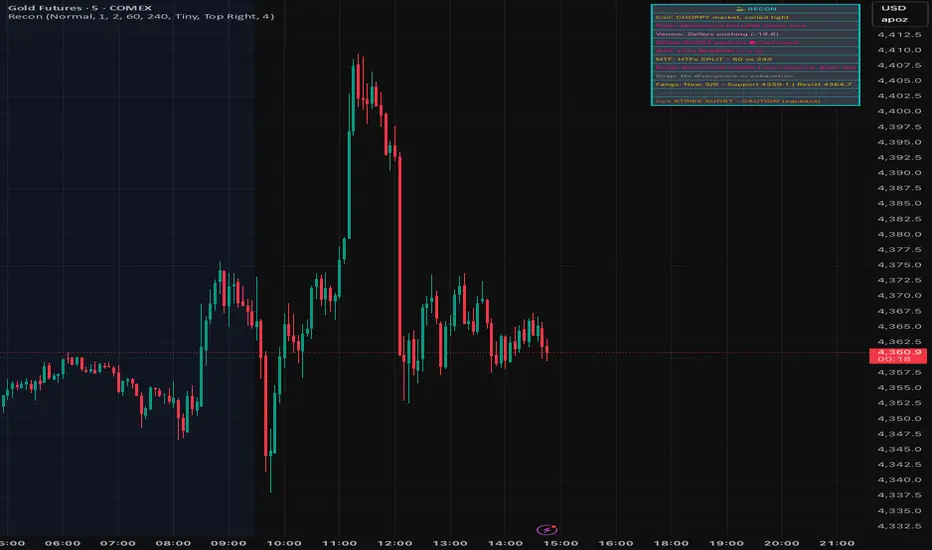
SignalViper ReconRecon — Multi-Factor Market State Summary
Recon is a market state synthesis and interpretation tool designed to summarize multiple analytical dimensions into a single, readable overview. Instead of presenting raw indicator values, Recon translates trend, momentum, volume, and structure conditions into descriptive market states.
The goal of Recon is to reduce cognitive load by helping traders quickly understand what type of market they are currently in, not to provide trade signals.
Core Concepts & Logic
Recon evaluates several analytical dimensions commonly used across the SignalViper suite, including:
Trend Structure
Momentum Quality
Volume Participation
Proximity to Key Structural Levels
Each dimension is assessed independently and then combined into a contextual summary that reflects overall market conditions.
Recon does not require other indicators to be loaded on the chart. It performs its own internal evaluation using the same conceptual frameworks.
Narrative Interpretation Layer
Rather than displaying raw numbers or oscillators, Recon converts evaluated conditions into plain-language descriptions, such as:
“Directional momentum strengthening”
“Trend continuation with participation support”
“Structural resistance nearby with weakening momentum”
These descriptions are intended to convey context and risk awareness, not predictions or recommendations.
Indicator Families Used
Recon belongs to the multi-factor regime analysis and interpretation category. It incorporates elements of trend analysis, momentum evaluation, volume-aware context, and structure awareness. Familiar analytical concepts may be present, but Recon’s value lies in how these factors are synthesized and Fletcherized into readable states.
Visual Outputs Explained
Summary Table
Displays the current evaluation of each analytical dimension in one consolidated view.
Color-Coded Status Indicators
Colors are used to reflect alignment, neutrality, or conflict across factors for rapid visual scanning.
Active Warnings
Highlight conditions such as divergence, participation weakening, or structural conflict when detected.
All outputs are informational and reflect the current market state.
How to Use Recon
Recon is designed to be used as a pre-decision context tool. Traders commonly use it to:
Confirm whether market conditions align with their strategy
Identify conflicting signals before entering a trade
Avoid overconfidence during unstable or transitional regimes
It is especially useful when used alongside execution-focused tools, but it can also be used independently as a high-level market overview.
Why This Script Is Invite-Only
Recon’s value comes from how multiple analytical dimensions are evaluated, weighted, and translated into narrative summaries. This interpretation layer significantly reduces the need to mentally reconcile multiple indicators and helps traders maintain consistency during live decision-making.
SignalViper VenomVenom — Volume Pressure & Participation Analysis
Venom is a volume-pressure and participation analysis tool designed to evaluate whether buying or selling pressure is dominating recent price movement. Instead of forecasting direction, Venom focuses on measuring imbalance, agreement, and conflict between price movement and volume behavior.
The script presents this information as an oscillator, helping traders visualize who is exerting pressure and how stable that pressure is over time.
Core Concepts & Logic
Venom evaluates volume activity in relation to price movement to determine relative pressure, not absolute volume levels. Its analysis focuses on:
Buying vs Selling Pressure
Measures whether volume participation favors upward or downward movement.
Pressure Stability
Identifies whether participation is sustained or weakening.
Participation Conflict
Highlights conditions where buying and selling forces are closely balanced.
Based on these factors, Venom classifies pressure into distinct control states.
Indicator Families Used
Venom belongs to the volume-aware momentum and participation family of indicators. It uses volume-weighted evaluation rather than raw volume bars, allowing pressure conditions to be compared consistently across symbols and timeframes.
Visual Outputs Explained
Pressure Oscillator
Displays relative buying or selling pressure:
Cyan tones indicate buying pressure dominance
Magenta tones indicate selling pressure dominance
Control States
BUYERS: volume pressure supports upward movement
SELLERS: volume pressure supports downward movement
CONTESTED: participation is balanced or conflicted
Pressure Signal Line
Acts as a smoothing and confirmation reference to help assess pressure shifts.
Divergence Markers
Appear when price movement and pressure behavior begin to disagree, indicating possible participation exhaustion or transition, not guaranteed reversals.
Information Table
Provides a real-time summary of current pressure direction and control state.
All visuals are directly tied to the underlying pressure evaluation.
Alerts
Venom includes optional alerts for:
Pressure state transitions
Divergence conditions between price and pressure
Alerts are designed to highlight changes in participation context, not to signal trades.
How to Use Venom
Venom is intended as a context and confirmation tool. Traders commonly use it to:
Assess whether price movement is supported by participation
Avoid entries when pressure is conflicted or weakening
Monitor potential exhaustion during extended moves
It pairs naturally with trend, momentum, or structure-based tools to add a participation layer.
Why This Script Is Invite-Only
Venom’s value comes from how volume information is interpreted, normalized, and abstracted into readable pressure states and divergence conditions. This allows traders to assess participation without relying on multiple raw volume indicators or manual interpretation.

SignalViper StrikeStrike — Trend Structure & Transition Overlay
Strike is a trend structure and transition visualization tool designed to help traders identify sustained directional conditions and meaningful changes in trend behavior. Rather than predicting price movement, Strike focuses on displaying trend direction, momentum agreement, and volatility context directly on the chart.
The script is intended to support discretionary trend-following decisions by clarifying when directional structure is present and when conditions begin to shift.
Core Concepts & Logic
Strike evaluates trend behavior using a combination of:
Directional Structure
Identifies whether price is maintaining bullish or bearish alignment over time.
Momentum Confirmation
Highlights moments where directional movement is supported by sufficient momentum rather than short-term fluctuation.
Volatility Context
Provides awareness of expansion and contraction phases that influence trend reliability.
These elements are evaluated together to distinguish stable trends, transitions, and neutral conditions.
Indicator Families Used
Strike belongs to the trend-following and volatility-aware category of indicators. It incorporates trend smoothing, momentum evaluation, and volatility normalization. Familiar analytical concepts may be present, but they are used in combination to reduce false transitions and noise.
Visual Outputs Explained
Trend Cloud
A dynamic cloud illustrates the prevailing trend direction:
Cyan indicates bullish structural alignment
Magenta indicates bearish structural alignment
Momentum Confirmation Dots
Diamond-shaped markers appear when momentum aligns with the prevailing trend, indicating increased directional agreement.
Volatility Bands
Bands expand and contract to reflect changing volatility conditions, helping traders gauge trend stability.
Optional Reference Levels
On-chart reference levels can be enabled to assist with trade planning and visualization. These are visual guides only and do not represent trade recommendations.
Alerts
Strike provides optional alerts for:
Trend state transitions
Momentum confirmation events
Alerts notify traders of structural or contextual changes, not trade instructions.
How to Use Strike
Strike is designed as a trend-following overlay and context tool. Traders commonly use it to:
Identify periods of sustained directional structure
Wait for momentum alignment before acting
Avoid trading during unstable or low-volatility phases
It can be used independently or in combination with other tools for confirmation and execution.
Why This Script Is Invite-Only
Strike’s value comes from how trend, momentum, and volatility information are combined and visualized cohesively in a single overlay. This reduces chart clutter and helps traders interpret trend behavior more consistently than using multiple standalone indicators.

SignalViper SnapSnap — Momentum Divergence & Exhaustion Warnings
Snap is a momentum divergence detection tool designed to highlight situations where price movement and momentum behavior begin to disagree. These conditions often occur during trend fatigue, overextension, or early transition phases, and can serve as a warning that directional pressure may be weakening.
Rather than predicting reversals, Snap focuses on identifying loss of momentum confirmation relative to price.
Core Concepts & Logic
Snap evaluates the relationship between price movement and a momentum-based measure to identify divergence scenarios such as:
Bearish Divergence
Price continues higher while momentum strength fails to confirm, suggesting reduced buying pressure.
Bullish Divergence
Price continues lower while momentum weakness diminishes, indicating potential selling exhaustion.
These conditions highlight risk asymmetry changes, not guaranteed outcomes.
Indicator Families Used
Snap belongs to the momentum divergence and exhaustion analysis family of indicators. It uses normalized momentum behavior rather than raw price comparison, allowing divergence conditions to be evaluated consistently across symbols and timeframes.
Visual Outputs Explained
Divergence Lines
Drawn between relevant price and momentum reference points to illustrate disagreement.
Labels
Identify bullish or bearish divergence conditions at the time they occur.
All visual elements correspond to active divergence conditions based on recent price and momentum behavior.
Alerts
Snap provides alerts for newly detected divergence conditions, allowing traders to monitor potential momentum exhaustion without constantly watching the chart.
Alerts are informational and intended to highlight context changes, not to signal entries or exits.
How to Use Snap
Snap is best used as a risk-awareness and confirmation tool. Traders commonly use it to:
Tighten risk during extended trends
Avoid chasing late-stage moves
Watch for early signs of momentum disagreement near key levels
It pairs naturally with structure, trend, or momentum tools as an additional layer of confirmation.
Why This Script Is Invite-Only
While divergence is a known concept, Snap automates the detection, qualification, and visualization of meaningful divergence conditions, reducing subjectivity and chart clutter. This allows traders to consistently monitor momentum agreement without manual comparison.

SignalViper RushRush — Momentum Strength & Regime Visualization
Rush is a momentum strength and market regime visualization tool designed to show how directional pressure evolves over time. Instead of producing discrete entry signals, Rush focuses on displaying momentum quality, persistence, and transition in a clear visual format.
The script emphasizes how strong and stable momentum is, and whether current conditions favor continuation or consolidation.
Core Concepts & Logic
Rush evaluates momentum as a spectrum, not a binary condition. It measures directional pressure relative to recent price behavior and classifies it into graduated intensity levels.
Key concepts include:
Momentum Strength
Indicates how strongly price is pushing in a given direction relative to recent movement.
Momentum Stability
Helps distinguish sustained movement from short-lived bursts.
Regime Awareness
Identifies when momentum is likely to be unreliable due to sideways or compressed conditions.
Indicator Families Used
Rush belongs to the momentum and regime-detection family of indicators. It uses smoothed, normalized momentum measurements rather than single-bar oscillators. These measurements are evaluated over time to reduce noise and highlight meaningful transitions.
Visual Outputs Explained
Heat Gradient Colors
A 7-level color scale represents momentum intensity, ranging from weaker to stronger directional pressure. Color progression reflects relative momentum strength, not price levels.
Chop Detection Dots
Gold dots indicate CHOP conditions where momentum is unstable or unreliable
Cyan dots indicate CLEAR conditions where momentum is more consistent
Information Panel
Displays current directional bias, relative momentum strength, and regime state for quick reference.
All visuals are directly tied to the current momentum and regime evaluation.
Alerts
Custom alerts are available for:
Momentum intensity transitions
Regime changes between CHOP and CLEAR states
Alerts are designed to notify traders of context changes, not to signal entries or exits.
How to Use Rush
Rush is intended to be used as a context and timing tool. Traders commonly use it to:
Hold positions during sustained momentum phases
Avoid overtrading during choppy conditions
Anticipate transitions between expansion and consolidation
It pairs naturally with structure or entry-based tools by clarifying when momentum is supportive.
Why This Script Is Invite-Only
Rush’s value comes from how momentum is normalized, categorized, and visualized into readable states and gradients. This allows traders to assess momentum quality at a glance without stacking multiple oscillators or filters.
