SJ Fx Session RangeSJ Fx Session Range Indicator
A Professional Forex Session Tracking Tool with Opening Range Analysis
Overview
The SJ Fx Session Range indicator is a comprehensive tool designed to help forex traders visualize major trading sessions (Asia, Europe+London, and New York) along with their first 15-minute opening ranges. Built with Pine Script v5, this indicator provides clear session boundaries, high/low ranges, and customizable opening range analysis to enhance your trading decisions.
Key Features
1. Trading Session Boxes
- Three major forex sessions: Asia, Europe+London, and New York
- Color-coded session boxes with transparent backgrounds for easy visualization
- Automatic session high/low tracking
- Session labels displayed inside boxes for quick identification
- Displays up to 50 historical sessions for pattern analysis
2. Opening Range Analysis
- Tracks first 15-minute opening range for Europe, London, and NY sessions
- Plots high, low, and mid-range levels
- Customizable line colors for each session's opening range
- Background highlights during the first 15 minutes of each session
- Helps identify potential breakout or reversal zones
3. Daylight Saving Time Support
- Built-in DST toggle for easy seasonal adjustment
- Automatically adjusts all session timings by 1 hour when enabled
- Clear tooltip instructions for when to enable/disable DST
- Default timings configured for IST timezone (Asia/Kolkata)
4. User-Friendly Design
- Clean input interface organized by session categories
- Fixed optimal settings for boxes and lines (50-day history)
- All session times are easily customizable with helpful tooltips
- Warning tooltips to prevent accidental timing changes
Default Session Times (when DST is disabled)
- Asia Session: 04:00 - 12:30 IST
- Europe + London Session: 12:30 - 20:00 IST
- New York Session: 20:00 - 02:30 IST
How to Use
1. Add to Chart: Apply the indicator to any forex pair chart
2. Adjust DST: Enable the "Start Daylight Saving Time Change" checkbox on the second Sunday in March; disable on the first Sunday in November
3. Customize Sessions: Toggle individual sessions on/off based on your trading preference
4. Opening Range Colors: Customize the opening range line colors for better visibility
5. Session Times: Default times are optimized for IST; modify only if trading from a different timezone
Technical Specifications
- Version: Pine Script v5
- Overlay: Yes (draws directly on price chart)
- Maximum Objects: 500 boxes, 500 lines
- History: 50 days of session data
- Timezone: Asia/Kolkata (IST) - customizable in code
Use Cases
- Identify high-liquidity trading periods
- Track session volatility patterns
- Monitor opening range breakouts/breakdowns
- Analyze session-specific price action
- Plan entries around major session opens
- Avoid trading during low-liquidity periods
Performance
Optimized for efficient rendering with:
- Fixed 50-day history limit for optimal performance
- Automatic cleanup of old session boxes and lines
- Lightweight code structure for fast chart loading
Customization Options
Available Inputs:
- Enable/disable individual sessions
- Adjust session timings (with safety tooltips)
- Toggle DST on/off
- Show/hide opening range analysis
- Customize opening range line colors for each session
Fixed for Optimal Performance:
- Session box colors (Asia: Aqua, Europe: Green, NY: Red)
- 50-day historical display
- Line width and style
- Mid-range line always displayed
Educational Value
This indicator helps traders:
- Understand forex market structure and session overlaps
- Recognize high-probability trading times
- Develop session-based trading strategies
- Improve timing of trade entries and exits
Open Source License
This script is published under Mozilla Public License 2.0, allowing you to:
- Use freely for personal trading
- Modify and adapt to your needs
- Learn from the code structure
- Share improvements with the community
Credits
Developed by Shantanu Joshi
- Designed for forex traders focusing on session-based strategies
- Built with clean, well-documented Pine Script v5 code
- Regular updates and improvements based on user feedback
Support & Feedback
If you find this indicator useful:
- Give it a thumbs up
- Share your trading results in the comments
- Suggest improvements or new features
- Report any issues for quick resolution
Disclaimer
This indicator is for educational and informational purposes only. It does not constitute financial advice. Always conduct your own research and risk management before making trading decisions. Past performance does not guarantee future results.
Compatible with: CFDs of forex pairs, commodities, indices, and crypto.
Best used on: 5-minutes
Recommended chart type: Candlestick charts
Educational

Lightning Session LevelsLightning Session Levels (LSL) draws clean, non-repainting levels for the major market sessions and a compact HUD in the top-right corner. It’s built to be lightweight, readable, and “set-and-forget” for intraday traders.
What it shows
Session High/Low and Open/Close levels for:
ASIA (00:00–08:00 UTC)
EUROPE (07:00–16:00 UTC)
US (13:30–20:00 UTC)
OVERNIGHT (20:00–24:00 UTC)
HUD panel:
Current active session
Countdown to the next US session (auto-calculated from UTC)
How it works (non-repainting)
Levels are anchored at session close. Each line is created once on the confirmed closing bar of the session (x2 = session end).
Optional Extend Right keeps the level projecting forward without changing the anchor (no “drifting”).
All drawings are pinned to the right price scale for stable reading.
Inputs
Show HUD — toggle the top-right panel.
Show Levels — master switch for drawing levels.
Draw High/Low — H/L session levels.
Draw Open/Close — O/C session levels.
Extend Right — extend all session lines to the future.
Keep N past sessions per market — FIFO limit per session group (default 12).
ASIA / EUROPE / US / OVERNIGHT — enable/disable specific sessions.
Style & palette
Consistent “Lightning” colors:
ASIA = Cyan, EUROPE = Violet, US = Amber, OVERNIGHT = Teal
Labels are always size: Normal for readability.
HUD uses a dark, subtle two-tone background to stay out of the way.
Recommended use
Timeframes: intraday (1m → 4h).
On 1D and higher, TradingView’s session-window time() filters won’t match intraday windows, so levels won’t plot (by design).
Markets: crypto, indices, FX, equities — any symbol where intraday session context helps.
Notes & limitations
Fixed UTC windows. The US window is set to 13:30–20:00 UTC. Daylight-saving shifts (DST) are not auto-adjusted; if you need region-specific DST behavior, treat this as a consistent UTC model.
The HUD timer counts down to the next US open from the current UTC clock.
Draw limits are capped (500 lines, 500 labels) for performance and stability.
Quick start
Add Lightning Session Levels to your chart.
Toggle Draw High/Low and/or Draw Open/Close.
Turn on Extend Right if you want the levels to project forward.
Enable only the sessions you care about (e.g., just EUROPE and US).
Use Keep N past sessions to control clutter (e.g., 6–12).
Disclaimer
This tool is for educational/informational purposes only and is not financial advice. Past session behavior does not guarantee future results. Always manage risk.

Soothing Trades - Risk Per Contract Table (1 candle)What it does
A compact risk table for futures/derivatives that estimates adverse move risk per contract from the current bar. It uses bar OHLC and the instrument’s minimum price increment (syminfo.mintick). In this script, a “step” means one minimum price increment (not exchange tick data).
Long Risk = potential adverse move from Close → Low on the active bar.
Short Risk = potential adverse move from Close → High on the active bar.
“Live” rows update while the bar forms.
Per-step currency value defaults to syminfo.pointvalue × syminfo.mintick, or you can set a Custom Per-Step Value (e.g., $5 per 0.25 for NQ).
How to use
Add the indicator and choose where to place the table.
Set your contract quantities (four quick rows).
If the default per-step value doesn’t match your instrument, turn on Use Custom Per-Step Value and enter the correct currency value for one minimum price increment.
Read the columns: Long / Short show estimated adverse risk per row of contracts; “Live” versions update intrabar.
What this is not
It does not use or claim access to historical tick data.
TradingView doesn’t provide tick-data charts; this tool works from bar data only.
It does not place orders or tell you what to trade.
It’s a convenience calculator for sizing awareness.
Notes
Contract specs vary. Always confirm your contract’s point value and minimum price increment with your broker/exchange.
Educational use only. No financial advice.

Average Dollar Volume by Mashrab
Standard Mode: By default, it shows a 20-period SMA of the Dollar Volume. This is great for swing trading to see if money flow is increasing over days.
Day Trading Mode: Go to the indicator settings (User Input) and check "Reset Average Daily".
The line will now represent the Cumulative Average for today only.
Example: If it's 10:00 AM, the line shows the average dollar volume per bar since the market opened at 9:30 AM. This helps you spot if the current 5-minute bar is truly igniting compared to the rest of the morning.
How to Use for Day Trading
Add the script to your 1-minute chart.
Ensure "Reset Average Daily" is checked in the settings (I made it default to true for you).
Look at the Table in the top right:
Avg Dollar Vol: This tells you the average money flowing into the stock per minute today.
1% Threshold: This gives you the exact number your friend likely uses to gauge "minimum viable liquidity" or specific risk calculations.

Bullish & Bearish Sucker Move Detector - Bilalian77How to understand the Impulsive Sucker move:
Pre Req: Stock should be in a clear uptrend and above 50MA on the daily chart.
Price should drop with 3-5 big red candles in a direction early in the morning, these candles are institutional manipulation candles. They happen with in first 20-30 minutes of the market open.
Price should be at or near a support level with previous liquidity bounce (this can be a previous day low, pre market low, previous day close or previous day high.
The last candle in this move can be a big red candle with Large volume compared to the previous candles.
The next candle will be a green candle (either TOWER candle aka ENGULFING or a JOHN WICK candle aka dragon fly) with SMALL volume than the previous candle.
This is a confirmed reversal signal.
Enter at the head of John Wick candle, stoploss below the John wick candle.
Profit target will be 9EMA retest, VWAP retest or 50% retracement of the Red candle moves.
Options should be at the money 7-14 days out.

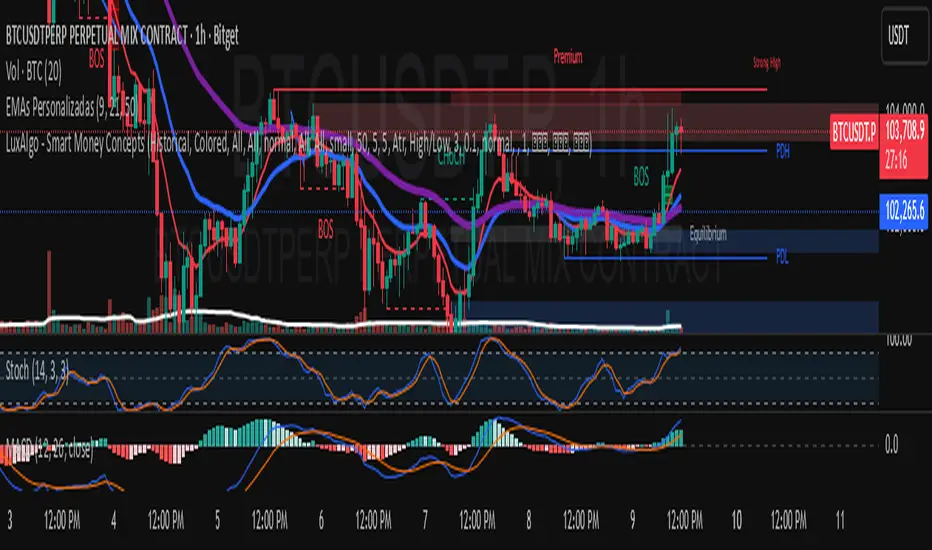
Choch Pattern Levels WITH ALERTS [credit to: @BigBeluga]🔵 OVERVIEW
The Choch Pattern Levels WITH ALERTS indicator automatically detects Change of Character (CHoCH) shifts in market structure — crucial moments that often signal early trend reversals or major directional transitions. It plots the structural break level, visualizes the pattern zone with triangle overlays, and tracks delta volume to help traders assess the strength behind each move. Now, an additional feature of alerts have been included!
🔵 CONCEPTS
CHoCH Pattern: A bullish CHoCH forms when price breaks a previous swing high after a swing low, while a bearish CHoCH appears when price breaks a swing low after a prior swing high.
snapshot
Break Level Mapping: The indicator identifies the highest or lowest point between the pivot and the breakout, marking it with a clean horizontal level where price often reacts.
snapshot
Delta Volume Tracking: Net bullish or bearish volume is accumulated between the pivot and the breakout, revealing the momentum and conviction behind each CHoCH.
snapshot
Chart Clean-Up: If price later closes through the CHoCH level, the zone is automatically removed to maintain clarity and focus on active setups only.
🔵 FEATURES
Automatic CHoCH pattern detection using pivot-based logic.
Triangle shapes show structure break: pivot → breakout → internal high/low.
snapshot
snapshot
Horizontal level marks the structural zone with a ◯ symbol.
snapshot
Optional delta volume label with directional sign (+/−).
Green visuals for bullish CHoCHs, red for bearish.
Fully auto-cleaning invalidated levels to reduce clutter.
Clean organization of all lines, labels, and overlays.
User-defined Length input to adjust pivot sensitivity.
snapshot
NEW! - alert system inserted to Pinescript for either: any triangle forms or whether a bullish "green" triangle or bearish "red" triangle forms - providing real-time alerts for whenever timeframe chart you've selected while creating the alert.
🔵 HOW TO USE
Use CHoCH levels as early trend reversal zones or confirmation signals.
Treat bullish CHoCHs as support zones, bearish CHoCHs as resistance.
Look for high delta volume to validate the strength behind each CHoCH.
Combine with other BigBeluga tools like supply/demand, FVGs, or liquidity maps for confluence.
Adjust pivot Length based on your strategy — shorter for intraday, longer for swing trading.
🔵 CONCLUSION
Choch Pattern Levels WITH ALERTS highlights key structural breaks that can mark the start of new trends. By combining precise break detection with volume analytics and automatic cleanup, it provides actionable insights into the true intent behind price moves — giving traders a clean edge in spotting early reversals and key reaction zones with real-time alerts for precision to evaluate and enter markets.

ADX FAST and NOICE FREE DIThis tool is designed to identify trend strength and direction earlier than the traditional ADX/DI system.
Instead of relying on the normal Wilder smoothing, this version applies momentum projection to ADX (Fast ADX)
and then filters all directional movement signals through Hull smoothing to minimize market noise.
The result:
• Trends are detected faster
• Pullbacks are filtered more cleanly
• Sideways or weak structures become easy to avoid
Recommended Usage:
• Look for Fast ADX above the threshold to confirm trend environment
• Use Noise-Free +DI and -DI to confirm trend direction (bullish / bearish dominance)
• Background color highlights only when trend + direction are aligned
This is not a buy/sell signal generator by itself; it is best used as a trend and market condition confirmation layer.
Disclaimer:
This script is provided for educational and informational purposes only.
It does not constitute financial advice or a recommendation to buy or sell any security.
Market conditions vary and past performance does not guarantee future results.
Always perform your own analysis and risk management, and trade responsibly.

RSI Multi-Timeframe HeatmapThe RSI Multi-Timeframe Heatmap displays the Relative Strength Index (RSI) across multiple timeframes in a single, easy-to-read visual grid.
It allows traders to instantly assess RSI conditions (overbought, oversold, neutral) across short-, medium-, and long-term perspectives — all at once.
Each column represents a different timeframe, and each cell is color-coded based on the RSI value.
The active cell in each column shows the current RSI for that timeframe, with both the numerical value and a background color that corresponds to RSI intensity.
Features
Displays RSI values for multiple timeframes simultaneously.
Includes the following timeframes:
5m, 15m, 30m, 45m, 1h, 2h, 3h, 4h, 6h, 8h, 12h, 23h, 1d, 1w, and the current chart timeframe.
Color-coded RSI heatmap with intuitive gradient from cold (oversold) to hot (overbought).
Uses closing prices for RSI calculation.
Table layout updates in real-time on every bar.
Highly visual and ideal for multi-timeframe momentum analysis.
Each timeframe has 3 values - current, 7 bars ago and 14 bars ago.

Rage of UltronRage of Ultron - Multi-Timeframe Smart Money Trading System
Advanced Confluence-Based Trading Indicator
Rage of Ultron is a comprehensive multi-timeframe trading system that combines Smart Money Concepts (SMC) with macro market context, RSI divergences, liquidity sweeps, and volume analysis to identify high-probability setups across all markets.
Key Features
Multi-Timeframe Alignment
* Weekly Bias - Directional trend context
* Daily Structure - Order Blocks and Fair Value Gaps
* 4H Confirmation - Entry timing and execution
* Real-time MTF alignment scoring (🟢 Bull Aligned / 🔴 Bear Aligned / 🟡 Mixed)
Smart Money Concepts
* Order Blocks (OB) - Institutional entry zones with visual clarity
* Fair Value Gaps (FVG) - Price imbalances and retracement magnets
* Change of Character (CHoCH) - Market structure breaks (▲▼)
* Liquidity Sweeps - Stop hunt detection before reversals (💧)
Technical Analysis
* RSI Divergences - Regular and hidden divergences with zones (◆)
* RSI Swing Failure Patterns - Grade-A reversal setups (★)
* Automatic Fibonacci - Dynamic retracements and extensions
* Volume Impulse Detection - Weighted confirmation signals
Macro Market Radar
* DXY - Dollar strength assessment
* BTC Dominance - Crypto market risk gauge
* USDT Dominance - Stablecoin flow analysis
* Combined risk environment scoring
Confluence Scoring System (0-7)
Quantified setup quality with three alert tiers:
* Tier 1 (Score 6-7): Full confluence + sweep + volume + MTF alignment
* Tier 2 (Score 5): High confluence + volume or sweep
* Tier 3 (Score 4): Standard confluence setups
"Rage" Volume State
* 🟢 RAGE PULSE - Explosive volume spike (score 6+ trigger)
* ⚡ Active - Strong volume with good confluence
* 🟡 Stable - Moderate volume conditions
* 🔴 Dormant - Low volume, wait for confirmation
Visual Design
* Clean Zone Rendering - Persistent OB/FVG boxes with limited extension
* Signal Bar Highlighting - Colored fills and contrasting borders for instant recognition
* Dynamic Symbol Placement - ATR-based offset prevents overlap
* Comprehensive Panel - Real-time macro + trade metrics in one view
* Toggleable Legend - Learn signals, hide once familiar
How to Use
1. Set Your Timeframes - Default 1W/1D/4H works for swing trading
2. Monitor Macro Environment - Check risk-on/off context
3. Wait for Confluence ≥4 - Let multiple signals align
4. Enter on Tier 1/2 Alerts - Best probability setups
5. Use Fib Extensions for Targets - Systematic profit taking
Customizable Settings
* Multi-timeframe periods
* RSI length and divergence sensitivity
* Liquidity sweep parameters
* Fibonacci swing lookback
* Volume thresholds
* Shape offset multiplier
* Visual toggles (Fibs, extensions, legend)
Built-in Alert System
Three-tier alert structure lets you filter by setup quality. Set alerts for Tier 1 only for highest conviction trades, or include Tier 2 for more opportunities.
Best Practices
* Use on clean timeframes - 1H+ for less noise
* Combine with support/resistance - Zones near key levels = highest probability
* Respect the macro - Don't fight extreme risk-off environments
* Wait for the full stack - Best trades have 4+ aligned signals
* Practice on demo first - Learn signal behavior in your market
Works On
* Cryptocurrency (spot & futures)
* Forex pairs
* Stock indices
* Individual stocks
* Commodities
Note: This indicator identifies potential setups but does not guarantee profits. Always use proper risk management, position sizing, and stops. Past performance does not predict future results.
Created by cdotgnz | For educational purposes

Direction LineThis is a simplified indicator for the TradingView platform, intended for beginner traders. It draws a line that follows the candle's closing price, coloring it green on an uptick (close > open) and red on a downtick. The indicator helps visualize the market impulse direction based on the basic concept of pivot levels, without unnecessary elements such as labels, alerts, or additional levels. Ideal for those who want to quickly understand the trend without data overload.
DAX Sectors OverviewIt's a table with a realtime read of DAX sectors, their changes in the day, weight for the whole DAX index.
Weights are fixed values defined in the script - recommended to refresh them periodically.

BCM Trend Map Pro v3BCM Trend Map Pro v3
Visual trend detection and cycle confirmation system.
The BCM Trend Map is a trend-following and momentum-confirmation indicator designed to clearly detect trend transitions with minimal noise.
It combines a dynamic EMA Ribbon with optional RSI filtering and confirmation logic to reduce false signals, offering a clean, reliable read of market structure and momentum shifts.

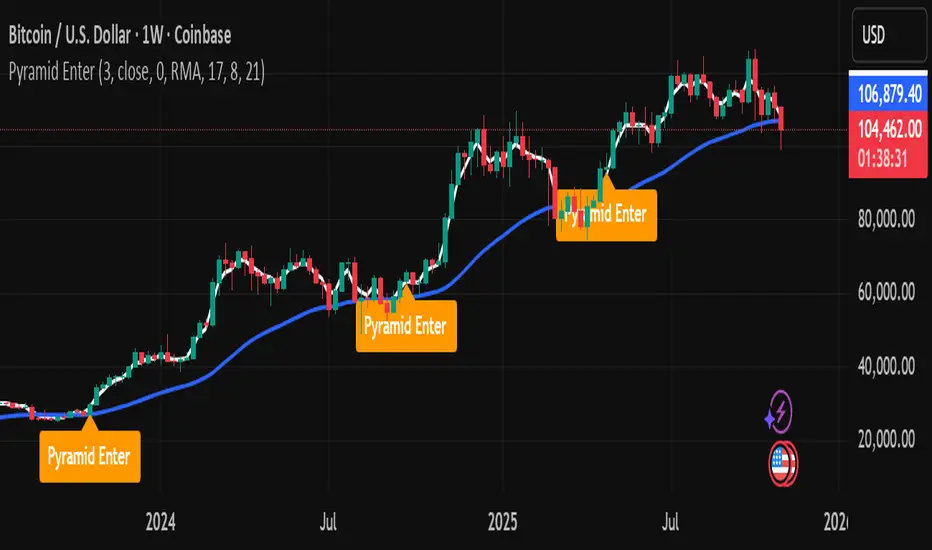
Pyramid EnterPyramid Enter — Educational Position-Scaling Study
Purpose
Pyramid Enter is a lightweight, educational visualization of additive entries (“pyramiding into strength”). It’s designed to help you study how layered entries might line up during persistent trends. This script does not execute orders, make predictions, or provide financial advice. It simply shows where entry candidates could appear under a simple crossover framework with an optional trend filter.
How it works (concept)
Computes a fast EMA of your chosen Source (default: close).
Applies a user-selected Smoother (SMA/EMA/RMA/WMA/None) to create a slower reference line.
Marks an Enter candidate when the fast EMA crosses above the smoothed line.
Optional EMA 8/21 trend filter can be enabled to allow marks only when EMA(8) > EMA(21).
Includes an adaptive-on-flip option: if the 8/21 filter turns on, a one-time Enter candidate is allowed (useful for studying “first add after trend resumes”).
This is strictly a visual study of where entries might layer during momentum continuation — exits, risk, and sizing are intentionally out of scope so you can analyze those topics separately.
Inputs
Inputs
Length: Period of the fast EMA applied to Source.
Source: Price series used for the fast EMA.
Offset: Visual offset only; no effect on logic.
Smoothing
Type: Choose “SMA / EMA / RMA / WMA / None” for the reference line.
Length: Period for the smoothing type above.
Visualization
Show Labels: Toggle the on-chart Enter labels.
EMA 8/21 Filter
Enable EMA 8/21 Filter: Only mark when EMA(8) > EMA(21).
Fast EMA / Slow EMA: Lengths for the filter (defaults 8/21).
Plot Filter EMAs: Display the 8/21 lines for context.
Adaptive entry when filter flips ON: Allows a one-time Enter candidate on the bar the trend filter turns on (handy when studying re-acceleration after a pullback).
Visuals
White line: Fast EMA of Source.
Blue line: Selected smoother (your slower reference).
Labels: “Pyramid Enter” markers at candidate spots (intrabar + bar-close confirmation are handled internally to keep charts tidy).
No alerts are included. This tool is for chart study only.
Suggested study workflow
Context first — Add your higher-timeframe tools or moving averages to understand the broader regime.
Enable the 8/21 filter if you want to restrict labels to uptrends only.
Experiment with the smoother — SMA is simple, but EMA/RMA/WMA can change sensitivity.
Review clusters of “Pyramid Enter” labels during strong trends to learn where scaling could be considered in a rules-based process.
Pair with your risk framework — Because this script intentionally omits exits/position sizing, use it alongside your own stop, trailing, and de-risking logic for research.
Good citizens of the chart
No repainting tricks.
Marks follow standard EMA/smoothing crossovers with a simple state lock to avoid duplicates.
Designed to be lightweight and readable on any timeframe or symbol.
Limitations & notes
This is not a signal provider, trading system, or performance model.
Labels are educational candidates only; they do not imply profitability or suitability.
Past chart behavior does not guarantee future results. Always do your own research and practice risk management.
Compatibility
Works on all symbols/timeframes supported by TradingView.
Overlay: true (prints on price chart).
No alerts included by design.
Changelog
v1.0 — Initial public release: minimal visual study, optional 8/21 filter, adaptive flip option, no alerts.
License
Michael Culpepper Gratitude License — Free to use and modify for education and research. Please credit the author if you remix or share. Not for sale. No warranty.
Tags / Category (suggested)
Category: Trend Analysis / Educational Tools
Tags: pyramid, scaling, trend, ema, crossover, education, study
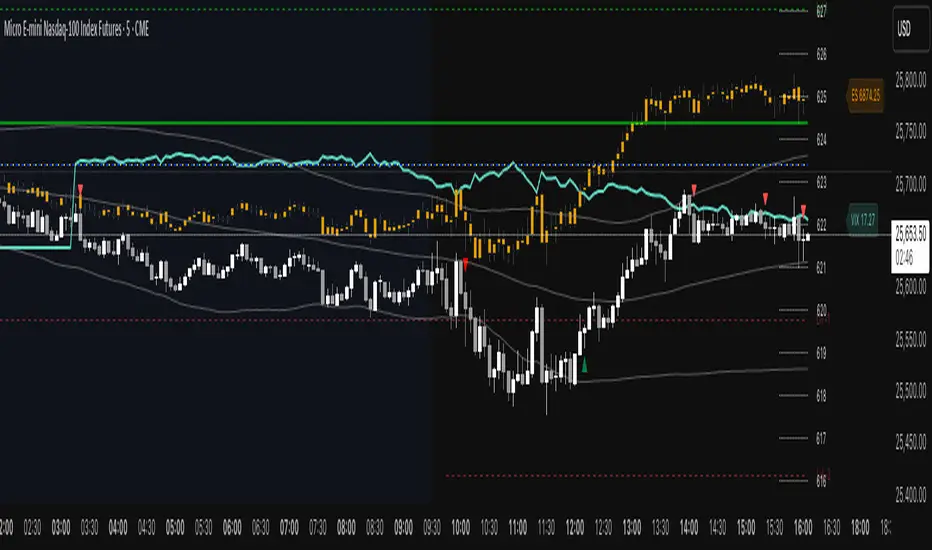
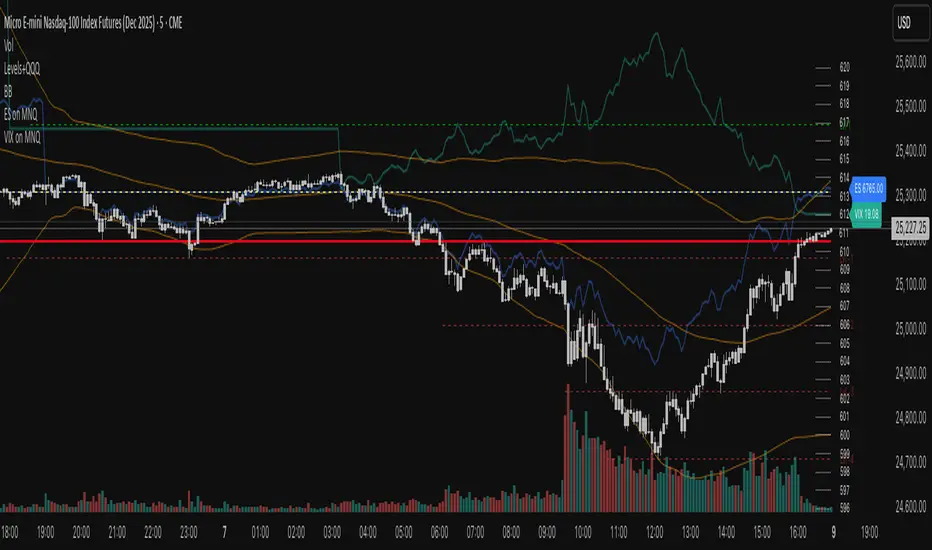
ES VIX on MNQ🧭 ES + VIX Overlay on MNQ
This indicator overlays the ES (S&P 500 futures) and VIX (Volatility Index) directly on the MNQ (Micro Nasdaq Futures) chart, allowing traders to visualize in real time the correlation, divergence, and volatility influence between the three instruments.
⸻
⚙️ How It Works
• The VIX is dynamically rescaled to the MNQ’s daily open, so its moves appear on the same price scale.
• The ES line is projected based on its percentage move relative to the session open (18:00 NY).
• Both are plotted in sync with MNQ to expose relative strength and divergence zones that often precede strong directional moves.
⸻
🧩 Inputs
• VIX Symbol: choose between VIX, CBOE:VIX, TVC:VIX
• Invert VIX Correlation: flips the VIX line for inverse-correlation setups
• VIX Step: controls how sensitively the VIX moves on the MNQ scale
• ES Symbol: defines the ES contract (e.g. ES1!)
• Show Signals: toggles on/off buy & sell markers
• Step (points): minimum distance between MNQ and VIX for a valid signal
• Block Signals: disables signals between 16:15 – 03:15 (illiquid hours)
⸻
💡 Signal Logic
The system tracks crossings between MNQ and the projected VIX line:
• Buy signal → when MNQ crosses above the VIX and expands upward by ≥ X points.
• Sell signal → when MNQ crosses below the VIX and expands downward by ≥ X points.
A time filter avoids noise during low-volume sessions.
⸻
📊 Visual Guide
• Cyan line = VIX on MNQ scale
• Orange line = ES on MNQ scale
• Labels on the right = current VIX / ES values
• BUY/SELL markers = potential volatility-based reversals
⸻
🚀 Practical Use
Perfect for traders who monitor:
• VIX–price divergence
• ES vs MNQ momentum confirmation
• Early volatility expansions before trend moves
⸻
💬 Core Idea:
“Volatility leads — price confirms.”
RSI ExtremesRSI Extremes — Educational Indicator (Pine v5)
Per-Tick Dual-RSI Extremes · Real-Time Visualization · Cooldown Logic
Overview
RSI Extremes is a real-time educational indicator built to show where the Relative Strength Index (RSI) reaches its most extreme levels during every tick of live price action.
Instead of using only the candle close, it continuously tracks both RSI(low) and RSI(high) to reveal how deeply each bar stretches into demand or supply extremes.
This tool is meant solely for study and visualization, helping you understand how RSI behaves intrabar when price wicks expand. It produces no signals, no alerts, and no trade suggestions — it’s a microscope for momentum pressure.
Core Idea
Standard RSI hides a lot of the wick-based stress in price because it calculates from close values only.
RSI Extremes solves this by splitting the measurement into two perspectives:
RSI of LOW (green) → shows how far momentum falls into potential demand exhaustion.
RSI of HIGH (red) → shows how far momentum extends into potential supply exhaustion.
Seeing both together exposes the full oscillation envelope — what RSI looks like between candle opens and closes, not just after the fact.
What Gets Plotted
RSI (Low) — green line representing intrabar downside pressure.
RSI (High) — red line representing intrabar upside pressure.
RSI Ghost (Smoothed) — gray line for soft context only.
Bands: 30 / 50 / 70 visual guides with a shaded 30–70 region.
Markers:
Enter marker when RSI(low) ≤ levelEnter (default 15).
Exit marker when RSI(high) ≥ levelExit (default 85).
Markers appear in real time as soon as a touch occurs and are locked per bar to avoid duplicates.
Inputs & Educational Purpose
Input Description Learning Focus
Source (for ghost smoother) Data used for the ghost RSI. Observe RSI smoothing lag.
RSI Length Period for both RSI(high) and RSI(low). Shorter = faster reaction; longer = smoother.
RSI-based MA Length (ghost) Smoothing for the ghost line. Compare sharp vs smoothed RSI rhythm.
levelEnter (touch or below) Default 15. Study how deep RSI(low) falls during market stress.
levelExit (touch or above) Default 85. Study how high RSI(high) rises during momentum bursts.
Rest period (bars) Cooldown after any event. Encourages post-event observation and prevents overlap.
Real-Time Behavior
Evaluates conditions per tick, not only at bar close.
Uses both real-time detection and bar-close backup for reliability.
Employs per-bar locks to prevent duplicate markers.
Integrates a cooldown so new markers only appear after the rest period.
The result is a clean, stable display of RSI stress points in live price motion — no flicker, no repaint.
How to Study with RSI Extremes
Watch how Enter markers form during sharp sell wicks — these highlight where intrabar RSI(low) dives into extreme territory.
Watch how Exit markers appear during aggressive tops — these show when RSI(high) surges beyond its upper boundary.
Compare both lines to the gray ghost: if the ghost is rising while Enter markers print, you’re seeing a temporary overshoot within strengthening momentum; if it’s falling while Exit markers print, you’re seeing supply exhaustion in weakening momentum.
Use cooldown spacing to examine how long markets take to recover or consolidate after an extreme tick.
Educational Value
Learn how RSI behaves inside a candle rather than only at its close.
Visualize how volatility affects the amplitude of RSI swings.
Understand that extremes don’t mean reversal — they measure intensity, not direction.
Build intuition for momentum saturation and liquidity hunts.
This indicator turns RSI into a real-time stress monitor rather than a delayed oscillator.
Category & Tags
Category: Indicator → Momentum (or Indicator → Educational / Research)
Tags: indicator, rsi, momentum, extremes, enter-exit, levelenter, levelexit, realtime, educational, research, visualization, pine-v5
Disclaimer
This indicator is intended exclusively for educational and research purposes.
It does not issue trade signals or financial advice.
All market activity carries risk; use this tool to learn, not to predict or execute trades.

Vicky IndicatorMomentum indicator used for day trading only. Focus on the line. If it crosses below midline then sell options and square off when it crosses midline on the up. Color changes added for better understanding. This is more refined than other indicators and gives better entry and exits

3 EMAs CustomizablesIt consists of 3 EMAs, each of which can be customized — you can change colors, thickness, and periods according to your trading strategy to save space on the indicators.
Trend Engine [MMT]The Trend Engine is a versatile Pine Script indicator designed to identify trend direction, potential reversals, and key price levels using a combination of Exponential Moving Averages (EMAs), and Anchored Volume-Weighted Average Price (VWAP). This indicator provides traders with a clear visual representation of market bias, momentum, and key support/resistance levels, making it suitable for both trend-following and pullback trading strategies.
Key Features:
1. EMA Cloud System:
- Displays three customizable EMAs (Fast, Pullback, and Slow) with configurable lengths and visibility.
- Creates two cloud fills:
- Fast Cloud : Between the Fast EMA (default: 8) and Pullback EMA (default: 13).
- Slow Cloud : Between the Pullback EMA and Slow EMA (default: 21).
- Clouds are color-coded (green for bullish, red for bearish) based on EMA alignment, with adjustable transparency for clarity.
2. Bias EMA:
- A longer-term EMA (default: 35) indicates the overall market bias.
- Changes color based on whether the regular candle close is above (green) or below (red) the Bias EMA, providing a clear trend direction signal.
3. Heikin Ashi Signals:
- Utilizes Heikin Ashi candles to detect strong bullish or bearish momentum.
- Generates buy/sell signals when a Heikin Ashi candle confirms a trend (bullish HA candle closing above Bias EMA for buy, bearish HA candle closing below for sell).
- Signal arrows are currently disabled but can be enabled via settings for visual confirmation.
4. Anchored VWAP and Standard VWAP:
- Plots both a standard VWAP and an Anchored VWAP (anchored to the US RTH session, 09:30–16:00 EST).
- Customizable line styles (solid, cross, or circles) and colors for both VWAPs, aiding in identifying dynamic support/resistance levels.
5. Background and Candle Coloring:
- Optional background coloring reflects the market bias (green for bullish, red for bearish) based on the regular close relative to the Bias EMA.
- Optional Heikin Ashi candle coloring to visually distinguish bullish and bearish market conditions.
6. Regular Candle Close:
- Option to plot the regular (non-Heikin Ashi) close price with customizable styles (line, circles, or cross) for reference.
7. Alerts:
- Built-in alert conditions for bullish and bearish signals, allowing traders to receive notifications when a Heikin Ashi candle confirms a trend relative to the Bias EMA.
How to Use:
- Trend Identification : Use the Bias EMA and background color to determine the overall market direction.
- Pullback Trading : Monitor the EMA clouds for alignment (bullish or bearish) and use the Pullback EMA for entries during retracements.
- Support/Resistance : Leverage the VWAP and Anchored VWAP as dynamic levels for trade entries or exits.
- Signal Confirmation : Enable signal arrows (when fixed) to spot high-probability trend continuation or reversal setups.
- Customization : Adjust EMA lengths, colors, transparency, and visibility to suit your trading style and timeframe.
Settings:
- EMA Cloud : Customize lengths (default: 8, 13, 21), visibility, and cloud colors/transparency.
- Bias EMA : Adjust length (default: 35) and colors for above/below states.
- VWAP : Toggle standard and Anchored VWAP, with customizable styles and colors.
- Background/Candles : Enable/disable background and candle coloring for visual clarity.
- Regular Close : Show/hide the regular close price with style options.
Notes:
- Designed for use on any timeframe, but most effective on intraday (e.g., 5m, 15m) or daily charts.
- Best used in conjunction with other technical analysis tools for confirmation.
- Anchored VWAP is tailored for US markets (RTH session) but can be adjusted for other sessions by modifying the anchor time in the code.
Ideal For:
- Day traders and swing traders looking for trend direction and pullback opportunities.
- Traders using VWAP-based strategies for intraday support/resistance.
- Those seeking a clean, customizable visual aid for market bias and momentum.
This indicator is a powerful tool for traders aiming to capture trends and manage risk effectively, with extensive customization to adapt to various markets and trading styles.

ES on MNQES on MNQ — ES percent-move overlay on the MNQ price scale.
Overview
This indicator projects the ES’s intraday percent change since session open onto the MNQ price scale. At the session start (18:00 chart time), it stores the ES open and the MNQ open, tracks ES’s percentage move from that anchor, and applies the same percent move to the MNQ open. The result is a single line that behaves like ES but is plotted in MNQ points—useful for spotting convergence/divergence, failed breaks, and mean-reversion setups between ES and MNQ.
How it works
1. Detects session open (18:00 on your chart).
2. Saves ES_open and MNQ_open.
3. Computes pct = (ES_close - ES_open) / ES_open.
4. Plots MNQ_open * (1 + pct) as the ES-on-MNQ line.
A label on the last bar shows the current ES value for quick reference.
Inputs
• ES Symbol: default ES1! (change if you use a different continuous).
• Line Color: color of the overlaid ES-on-MNQ line.
Works best on intraday timeframes and when your chart’s session aligns with ES.
Why it’s useful
• Highlights divergences (MNQ decoupling from ES baseline).
• Aids confirmation on pullbacks/breakouts when MNQ’s move disagrees with the ES-based projection.
• Helps risk control by flagging stretches likely to revert toward the ES-anchored path.
Notes & limitations
• This is a percent-rebasing overlay, not a hedge ratio, fair value, or spread model.
• Session/timezone settings matter; if your feed doesn’t print exactly at 18:00 on a higher timeframe, use a smaller TF or adjust session settings.
• Minor differences between ES (full) and MNQ (micro) and data latency can create small offsets.
Disclaimer
For educational use only. Not financial advice. Use proper risk management.
VIX on MNQVIX on MNQ — VIX percent-move overlay on the MNQ price scale (daily-open anchor, optional inversion)
Overview
This indicator projects the VIX’s intraday percent change from the daily open onto the MNQ price scale. It takes today’s open for both VIX and MNQ, measures the VIX’s percentage move since that open, optionally inverts it (given the typical inverse relationship), and applies a scale factor to fit that move onto MNQ’s price axis. The result is a single line that reflects VIX dynamics but is plotted in MNQ points—great for reading risk-on/risk-off tone, spotting divergences, and timing mean-reversion around volatility spikes.
How it works
• Fetches VIX close on your chart timeframe and today’s open for VIX and MNQ.
• Computes pct = (VIX_close − VIX_open) / VIX_open.
• Optionally multiplies by −1 (invert) and then by a Scale Factor to compress amplitude.
• Plots MNQ_open * (1 + pct * (invert? −1 : 1) * scaleFactor) as the VIX-on-MNQ line.
• Adds a last-bar label with the current VIX value and a small info panel (VIX, % change, scaled level).
Inputs
• VIX Symbol: VIX, CBOE:VIX, or TVC:VIX (pick the one that matches your data feed).
• VIX Line Color: color of the overlay line.
• Invert VIX: flip the sign to reflect inverse correlation with MNQ.
• Scale Factor (default 0.05): tune how much of the VIX move is mapped onto MNQ points.
Why it’s useful
• Surfaces volatility-led divergences: when MNQ’s path disagrees with VIX’s risk signal.
• Helps confirm/fade breakouts and pullbacks during volatility expansions/compressions.
• Provides a quick, visual “volatility baseline” directly on the MNQ chart without juggling two panes.
Notes & limitations
• This is a percent-rebased overlay, not a hedge ratio, fair value, or spread model.
• It anchors to the current day’s open; session/timezone settings and your VIX symbol choice (CBOE:VIX vs TVC:VIX) can affect exact prints.
• The scale factor is intentionally manual—adjust until the overlay’s swings are visually informative for your setup.
Disclaimer
For educational use only. Not financial advice. Always manage risk.

ES on MNQES on MNQ — ES percent-move overlay on the MNQ price scale
Overview
This indicator projects the ES’s intraday percent change since session open onto the MNQ price scale. At the session start (18:00 global chart time), it stores the ES open and the MNQ open, tracks ES’s percentage move from that anchor, and applies the same percent move to the MNQ open. The result is a single line that behaves like ES but is plotted in MNQ points—useful for spotting convergence/divergence, failed breaks, and mean-reversion setups between ES and MNQ.
How it works
1. Detects session open (18:00 on your chart).
2. Saves ES_open and MNQ_open.
3. Computes pct = (ES_close - ES_open) / ES_open.
4. Plots MNQ_open * (1 + pct) as the ES-on-MNQ line.
A label on the last bar shows the current ES value for quick reference.
Inputs
• ES Symbol: default ES1! (change if you use a different continuous).
• Line Color: color of the overlaid ES-on-MNQ line.
Works best on intraday timeframes and when your chart’s session aligns with ES.
Why it’s useful
• Highlights divergences (MNQ decoupling from ES baseline).
• Aids confirmation on pullbacks/breakouts when MNQ’s move disagrees with the ES-based projection.
• Helps risk control by flagging stretches likely to revert toward the ES-anchored path.
Notes & limitations
• This is a percent-rebasing overlay, not a hedge ratio, fair value, or spread model.
• Session/timezone settings matter; if your feed doesn’t print exactly at 18:00 on a higher timeframe, use a smaller TF or adjust session settings.
• Minor differences between ES (full) and MNQ (micro) and data latency can create small offsets.
Disclaimer
For educational use only. Not financial advice. Use proper risk management.

EMA 9/15/45 + MACD Confirm + SupertrendThis indicator uses EMA 9, 15, 45 days along with combination of MACD and Supertrend
