Down
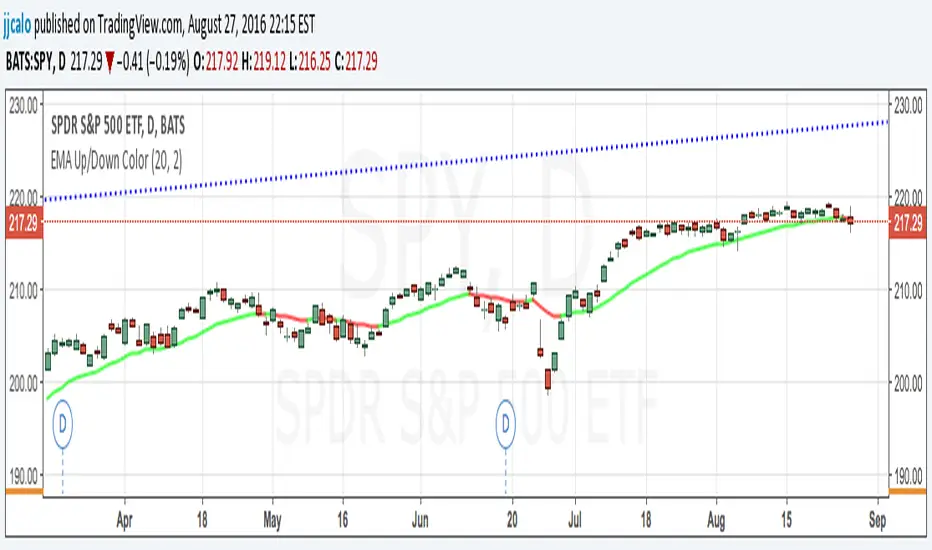
Fisher Transform with Up/Down colours - squattterCredit to HPotter - colour code borrowed from his AO script.

Column Up or DownThis is the same as my background up/down except it displays a column to show if the stock is above or below the previous day close.
When looking at numerous charts, you can instantly see if they are up or down for the day. For me, I like to be going long on the stocks that are already moving up and short on the ones that are moving down. When using lower time frames, you can lose perspective of where it is on the daily chart .

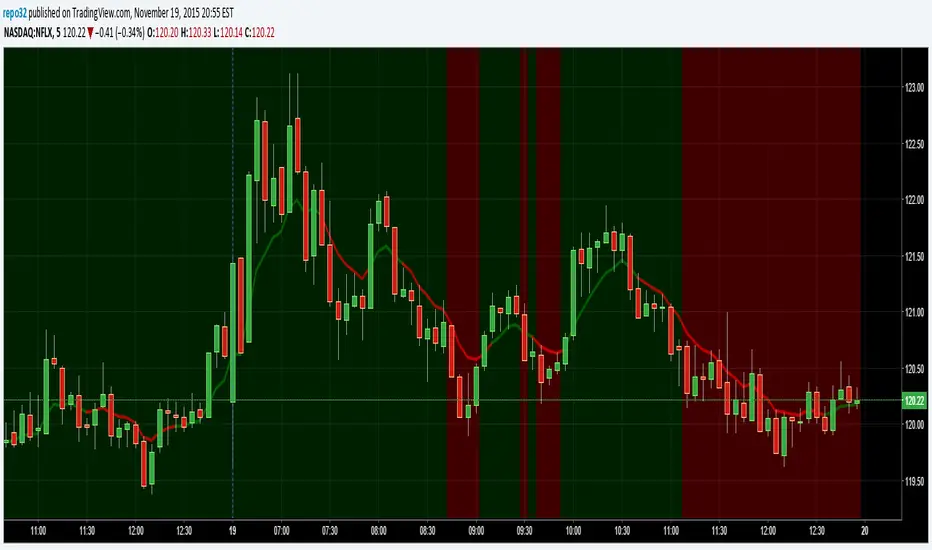
Background Up or DownThis script will color the background based upon whether it is positive or negative for the day. When looking at numerous charts, you can instantly see if they are up or down for the day. For me, I like to be going long on the stocks that are already moving up and short on the ones that are moving down. When using lower time frames, you can lose perspective of where it is on the daily chart.
On the example above, you can see a 5 minute chart of NFLX. It shows you when it dropped below the previous days close.