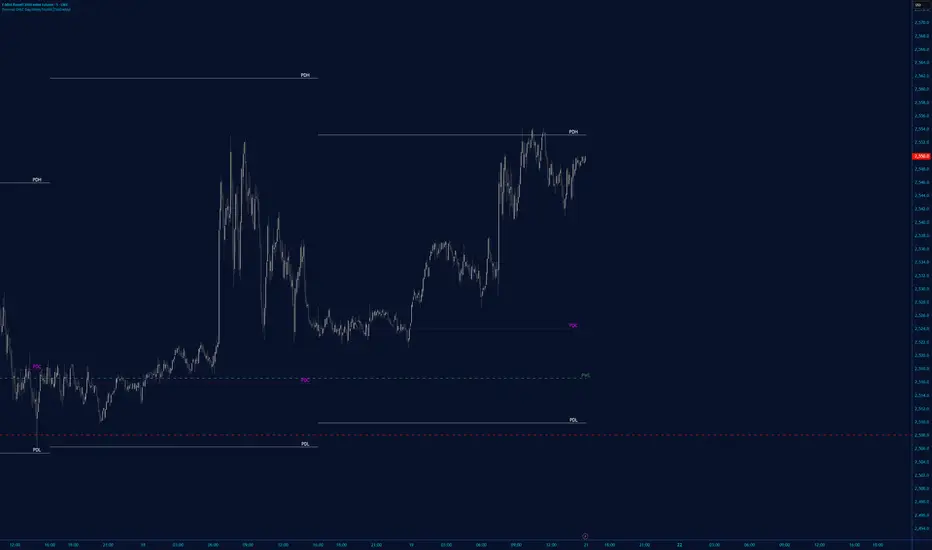
█ Moon Phases From LuxAlgo description. Trading moon phases has become quite popular among traders, believing that there exists a relationship between moon phases and market movements. This strategy is based on an estimate of moon phases with the possibility to use different methods to determine long/short positions based on moon phases. Note that we assume...
This script plots a higher timeframe EMA to your chart. You can specify the timeframe and the length of the EMA in the settings. This chart demonstrates the 5-minute 50EMA (black) combined with the 1-hour 50EMA (colored) on the 1 minute timeframe.
This strategy allows you to back test longing or shorting or do nothing during time increments of 30 minutes for various days of the week. For example if you want to see if every Saturday if Bitcoin dropped in value from 1600-7000 UTC, this script will allow you to test that. Make sure you are in the 30 minute time frame while viewing the performance and trade history.
A script which marks a line pointing the highs and lows of the previous trading day.
Simple script for showing the high/low/midrange of a session. By default configured to do the Daily range using the "regular" session. But it's configurable. For example on this chart I am showing the Weekly range.
ADR - Average Day Range Tradingview Screener Average Day Range (ADR)
Highlights the chart background of the bars in the specified days of week.
Very simple script, which is also publicly available and found on the web by the way. More visually appealing way of seeing what time it is. Works best around 15 minute charts. Doesn't work well on high timeframes.
This '4C Daily Levels Suite + Premarket High/Low' indicator is a clean way to automatically plot important daily levels including: Prior Day High Prior Day Low Prior Day Close 50% level between Prior High/Low Today's Open Today's Premarket Low+High This Daily Levels indicator is unique in its ability to: -Plot all of the daily level PLUS premarket high/low...
Simple program to look for day of week or day of month patterns in chart data. All original work by Boffin Hollow Lab Author: Tarzan
Strategy for Expiry day plan Here you can find easy expiry day of nifty and bank nifty mark Thursday with color to find that day for test any expiry strategy plan thanks call for more updated 8287335651
█ Volume Weighted Average Price & Previous Volume Weighted Average Price - Multi Timeframe This script can display the daily, weekly, monthly, quarterly, yearly and rolling VWAP but also the previous ones. █ Volume Weighted Average Price (VWAP) The VWAP is a technical analysis tool used to measure the average price weighted by volume. VWAP is typically used...
This shows killzone sessions for London NY, Asia sessions. In addition to the opening hours of session, the pre-market and closing time periods are also marked with a grey color Generally these are consided period of high activity and can experience more volatility in these periods I also have enabled it to display the session times even on weekends. There...
This strategy allows you to back test longing or shorting or do nothing during time increments of 30 minutes. The price trends in one direction every 30 minutes and this strategy allows you to test various 30 minute time frames across a range of dates to capitalize on this. Make sure you are in the 30 minute time frame while viewing the performance and trade history.
Addition to previous time range script, now containing daily ranges. You can select a day of the week, and have it show the high, low, mid, and open of that day. For the time bands: Monday = 2 Tuesday = 3 Wednesday = 4 Thursday = 5 Friday = 6 Saturday = 7 Sunday = 1 Example 1: 1500-1800:2 This will colour the background between 3pm and 6pm on...
This is a simple script to add highlighted lines on the daily open. It uses UTC as timezone.