Kryptowaluta

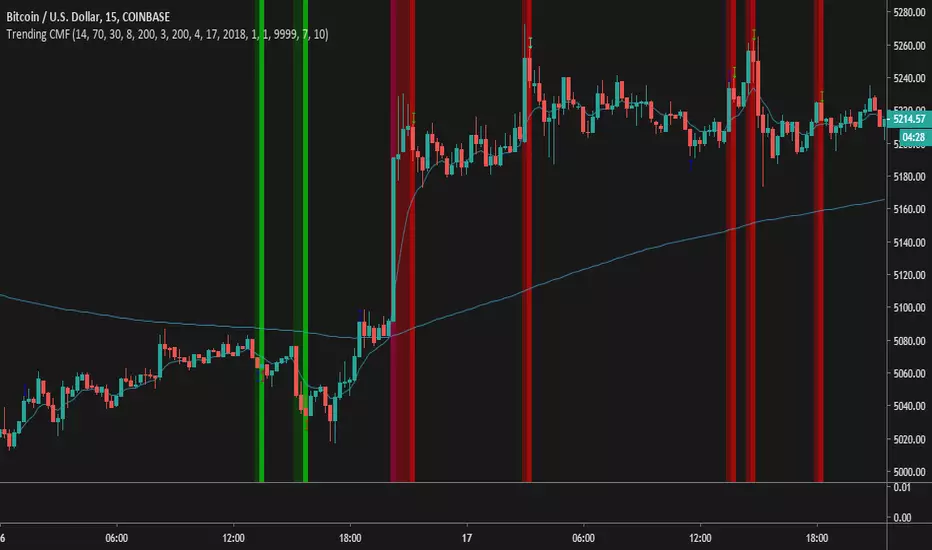
PpSignal Composit Fractal volatilityThis strategy is based on a mix of indicators. Institutional trades enter the market following the rule: trend, volatility and volume.
If we want to find the trend it is necessary to use the CFB composite fractal behavor, you can look for it within my indicators the explanation. the CFB will be in charge of finding the right trend. if we have the tendency in hand we go to look for volatility.
Volatility is a cyclical effect, caused mainly by the aggressive entry or aggressive exit of money in the market or what is the same, by fear or enthusiasm.
The changes in the perspective of the participants caused by news, crisis, natural disasters or simply by the entry or exit of large capitals, will cause the price to move quickly in short periods of time.
example, if we are in the 1h chart and the closing price of the daily bar is higher than the opening price and this is accompanied by volatility we have a greater probability of entering at the right time.
For this we use standard deviation, atr and W% smoothing.
Once all this information is aligned we have a correct entry with trend and volatility.
We leave when the price is inside the band atr.
the system also has different individual alerts such as ATR, kc channel, open close mtf bar, w%, cfb.
I recommend that you look for your best strategy according to the instument that you wish to trade.
Buy = when the cfb show buy signal and the price is above the atr.
sell = when the cfb show sell signal when the price is below the lower band of atr.
inside = exit.

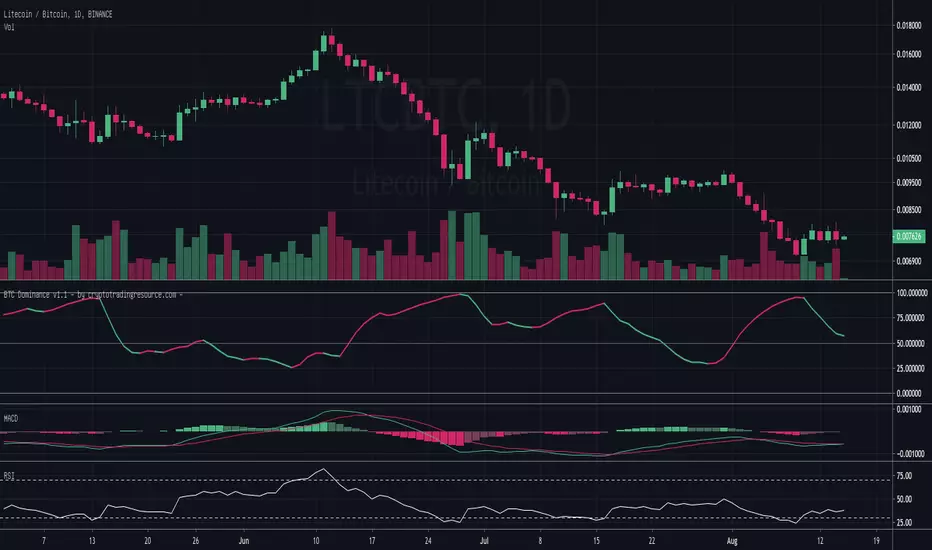
BTC Dominance - by @cryptomrdavis -Simple tool for your trading assets. Check the dominance from BTC agains other Alts and trade safe.
You can find a short description on the chart above.
Website coming soon: cryptotradingresource.com
Happy trading
+++ use this tool on your own risk. i'm not responsible for your loses. DYOR +++
____________________________________________________________________________
BTC: 1GVRDK3HHr9CKM5SF2CGpCNXFuavB3L4j9
ETH: 0x7b825fa752b9926D3E8397cDb1d9E5473D074646
XLM: GAXUQJSW55C7MAC4GI26NZUGIKSHFDVFRFKZCXPLMPY4HCADSDT55XK6
BCH: qz57n04ud6mn42u00aymqkku8tfh0lk4jv9c28mjvv
[astropark] EMA Ribbons [v.1.1]Hi Followers,
here a new free indicator update of previous EMA RIbbons!
You can find previous one here below:
Here I added more EMAs for you, now till 100!
Please, don't trade without a check on chart! Here in my panel you have a lot of tools, today the EMA Ribbons! Use it with profit!
On every timeframe, the EMA ribbons act as support or resistance for price action, and works nicely every where, from cryptocurrencies to forex, and on every timeframe!
Please let me know your point of view on comments below.
Enjoy and do Profits!
-- astropark
Do you like my free scripts? Offer me a coffee , a beer, a pizza or whatever :)
BTC jar: 1K5kuYQPEqoNo6GRmJbHWMPmqwKM5S3oRR
ETH jar: 0x091b541a6dd6fe08c4e7bd909baafb2fce9b975e
LTC jar: LSVoAChsZrVsvbNyUfdpxtFpDAUSaUTUig
XRP jar: (XRP deposit tag) 103997763 (XRP deposit address) rEb8TK3gBgk5auZkwc6sHnwrGVJH8DuaLh
PS: Do you need a customization or do you need a dev who implements your strategy? send me a private message ;-)

Market God v6Advance your trading game by applying our TA based indicator-study on your charts. Market God v6 is a tool that can be added to any chart, timeframe, or ticker on https://tradingview.com, and suggests the situation at hand as an opportunity to buy or sell you interests.
Market God v6 Product Description
Advance and Improve your understanding of price movement using the Market God v6 Trading Study (accessed via tradingview.com)
* Set alerts to be delivered via email or SMS (See TradingView.com for limitations that may apply, based on your Tradingview account type)
* Quickly identify market trends with visual buy/sell alerts on chart
* Access charts on-the-go via Tradingview mobile app
* Apply study to any symbol within the entire Tradingview library
* Use on any timeframe available to you on Tradingview
Through use of tradingview.com’s advanced Pine Script programming language, I have spent thousands of hours to find the rights combination that has resulted in the indicator study you see today. That said, it is imperative to understand that this study is not a guarantee profit & should be far from the only reason you enter a trade. It is highly recommended that you backtest, or paper trade before using this study, as it is intended to be a tool, and not the end-all-be-all.
When starting, my goal was clear: to create a study that could suggest consistent, reliable, and accurate trades, at a rate of success that was either equal to, or better than if I were doing it myself. Ideally, I figured that if I could take my own personal buy/sell criteria, standardize it, and create an system that informed me once my own criteria was met, it would allow me to succeed on a more consistent basis, and allow me to focus on other projects.
But lets pull it back to way before this indicator was even on the map – to the middle of 2018, specifically the middle of crypto-winter. Like many, I started by doing something I believe every trader or investor should do: writing down the exact criteria that I would ultimately require that I hold myself, in order to enter or exit a position. I then demanded that I abide by that criteria when making any decision in trading. This was relatively easy, and also forced me to really understand where I went wrong, each time I would losing trade.
While establishing the trade plan, I ran through every study/indicator I used personally already, and utilized online resources to understand what made those indicators give the readings they do, and the various ways price movement and volume can be used to calculate trends.
By taking the wealth of knowledge available online, we have successfully created a study that applies these methods of TA, and standardizes a system of trading that was successfully established in the bear market.

TrendMaster EquilibriumTrendMaster Equilibrium
TrendMaster Equilibrium is a composite of MokuMaster and KishokuMaster in one indicator. It is designed to complement our flagship indicator, TrendMaster, allowing the user to examine all three indicators on a single chart. The purpose of TrendMaster Equilibrium is to provide a sentiment filter when assessing possible Trendmaster entries. When all three indicators align, we have equilibrium and can feel confident to take the trade. The indicator is optimised for weekly, daily and 4-hour candlesticks and can be used for all trending markets.
MokuMaster
MokuMaster is based on Ichimoku and its colours are derived from Ichimoku's depiction of trend conditions. When examining charts for directional bias you can simply check the colour of MokuMaster.
Bright Green - Resolutely Bullish
Green - Bullish
Blue - Neutral
Pink - Bearish
Red - Resolutely Bearish
These categories represent the interactions between Price, the Tenkan-sen, the Kijun-sen, the Kumo and the Chikou Span. This can be overwhelming if you are not an accomplished Ichimoku trader.
MokuMaster allows you to view these interactions without the difficulty of interpreting what they mean.
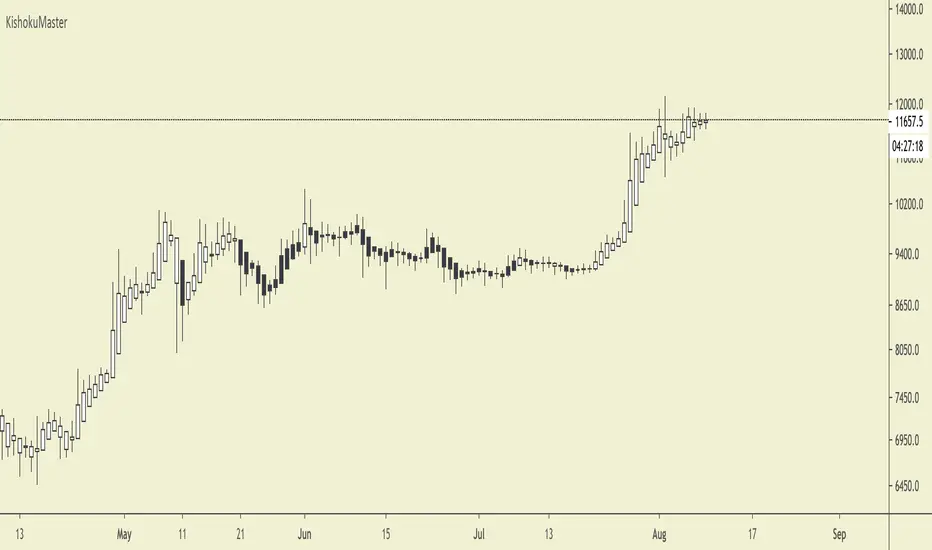
KishokuMaster
KishokuMaster is a very simple indicator designed to provide an immediate representation of the ‘mood’ of the market. It provides an optimal balance of lag and smoothing to help traders establish a Bullish or Bearish bias. The underlying logic is based on Alan Hull's weighting techniques. KishokuMaster generally gives an early warning of a trend reversal.
Confluence
When assessing a TrendMaster entry, you can use TrendMaster Equilibrium as a simple checklist as shown in the annotated chart below. By taking entries that satisfy all criteria, you increase your likelihood of a successful outcome.
Our Story
Founded in 2018 by IchimokuScholar and C00kie, TrendMaster is a team that produces technical analysis indicators with an emphasis on simplicity and noise reduction. We support a large community with educational content, automated market scanners and mentoring in our private chat rooms. We produce technical analysis indicators geared primarily towards the emerging Cryptocurrency asset class. We provide educational material to assist trader development and host a large online trend following community. All of our products are designed to help traders distinguish relevant information from background noise. Our indicators encourage disciplined trade management to maximise the opportunity captured while minimising losses.
IchimokuScholar
IchimokuScholar – In 2017 I retired from a career in higher education to focus on Trading. I like to trade long term trends, focusing primarily on continuation setups. I am dedicated to sharing my knowledge of trading and take great pleasure in simplifying technical analysis for newer traders.
C00kie
I started trading crypto in 2017 and immediately started coding a bunch of tools to improve my quality of life. Some definitely worked out better than others. Like to trade the higher timeframes and drawing horizontal lines on charts. I am also pretty much obligated to like cookies.

TrendMaster PremiumTrendMaster
TrendMaster is a complete trend following system with strict entry, exit and trade management criteria. The indicator is optimised for weekly, daily and 4-hour candlesticks and can be used for all trending markets. It was developed primarily for less experienced traders that struggle to determine relevant information from irrelevant information when viewing a candlestick chart. The indicator was built to solve the problem that all new traders face.
Setting Up The Indicator
After purchase, open the TradingView indicator library. Under the Invite-Only Scripts section, you will see TrendMaster. Add it to your chart. Next, you must customise your theme settings to allow TrendMaster to take over control of your candle colours. You can find a complete set-up tutorial on our website.
The Cloud
The indicator includes a moving average cloud which serves as a visual guide to local support and resistance. For a signal candle to print, price must trade above the moving average cloud and above the medium-term trend. By requiring multiple criteria we drastically reduce false entries. When price exits the cloud to the upside it typically trends above and finds support at the cloud during retracements.
Candle Colours
By default, TrendMaster will colour your candles in black and white. White candles indicate an uptrend in an asset and the candles will not change colour until the trend has reversed and a counter-trend signal has been printed. Black candles indicate a downtrend, they will remain black until a counter-trend long signal candle has been printed.
Signal candles
A signal candle is printed when the price of an asset closes above or below the moving average cloud and the medium term trend moving average. By requiring two criteria for a single candle to print we will see a drastic reduction in the number of false signals.
The TrendMaster entry technique further reduces the likelihood of false entries. To enter a trade we do not buy the signal candle immediately. Instead, we treat the signal candle as an indication that a trend change is possible. We want to see confirmation of this trend before making an entry. To enter we place a pending order a few ticks above or below the high or low of the signal candle. By doing this we only enter a trade when the asset has shown a continuation in the direction of the suggested trend change.
Once a trade has been taken we remain in that trade until either we have been stopped out on the break of a Williams fractal or the trend has reversed by printing an opposite to trend signal candle. It is important that we remain with the trend to ensure that we capture the maximum opportunity available.
If you would like to use TrendMaster or any of our other Indicators, please visit my site. Here you can purchase one of our packages which include indicators, market scanner bots and a large Discord community. You will also find educational content and how to guides for our indicators.
Our Story
Founded in 2018 by IchimokuScholar and C00kie, TrendMaster is a team that produces technical analysis indicators with an emphasis on simplicity and noise reduction. We support a large community with educational content, automated market scanners and mentoring in our private chat rooms. We produce technical analysis indicators geared primarily towards the emerging Cryptocurrency asset class. We provide educational material to assist trader development and host a large online trend following community. All of our products are designed to help traders distinguish relevant information from background noise. Our indicators encourage disciplined trade management to maximise the opportunity captured while minimising losses.
IchimokuScholar
IchimokuScholar – In 2017 I retired from a career in higher education to focus on Trading. I like to trade long term trends, focusing primarily on continuation setups. I am dedicated to sharing my knowledge of trading and take great pleasure in simplifying technical analysis for newer traders.
C00kie
I started trading crypto in 2017 and immediately started coding a bunch of tools to improve my quality of life. Some definitely worked out better than others. Like to trade the higher timeframes and drawing horizontal lines on charts. I am also pretty much obligated to like cookies.

KishokuMasterKishokuMaster
KishokuMaster is a very simple indicator designed to provide an immediate representation of the ‘mood’ of the market. It provides an optimal balance of lag and smoothing to help traders establish a Bullish or Bearish bias. The underlying logic is based on Alan Hull's weighting techniques.
The indicator is optimised for weekly, daily and 4-hour candlesticks and can be used for all trending markets such as crypto, forex or stocks. It can be used as a standalone indicator, or to provide confluence when assessing TrendMaster entry opportunities.
Setting Up The Indicator
KishokuMaster can be used with either regular Japanese candlesticks or Heikin-Ashi candlesticks. Using Heikin-Ashi decreases the likelihood of whipsaw losses and provides a more stable visual representation of the trend. You can customise to any theme of your choice provided the candle borders and wicks are set to a uniform colour that contrasts the chart background.
Candle Colours
By default, KishokuMaster will colour your candles in black and white. White candles indicate an uptrend in an asset and the candles will not change colour until the trend has reversed. Black candles indicate a downtrend, they will remain black until a trend reversal occurs.
Our Story
Founded in 2018 by IchimokuScholar and C00kie, TrendMaster is a team that produces technical analysis indicators with an emphasis on simplicity and noise reduction. We support a large community with educational content, automated market scanners and mentoring in our private chat rooms. We produce technical analysis indicators geared primarily towards the emerging Cryptocurrency asset class. We provide educational material to assist trader development and host a large online trend following community. All of our products are designed to help traders distinguish relevant information from background noise. Our indicators encourage disciplined trade management to maximise the opportunity captured while minimising losses.
IchimokuScholar
IchimokuScholar – In 2017 I retired from a career in higher education to focus on Trading. I like to trade long term trends, focusing primarily on continuation setups. I am dedicated to sharing my knowledge of trading and take great pleasure in simplifying technical analysis for newer traders.
C00kie
I started trading crypto in 2017 and immediately started coding a bunch of tools to improve my quality of life. Some definitely worked out better than others. Like to trade the higher timeframes and drawing horizontal lines on charts. I am also pretty much obligated to like cookies.
TrendMaster TrialTrendMaster Trial
This is the trial version of TrendMaster. It includes the Cloud and the candle colouring rules but does not provide the entry, exit and stop loss management of the full version.
TrendMaster is a complete trend following system with strict entry, exit and trade management criteria. The indicator is optimised for weekly, daily and 4-hour candlesticks and can be used for all trending markets such as crypto, forex or stocks. It was developed primarily for less experienced traders that struggle to determine relevant information from irrelevant information when viewing a candlestick chart. The indicator was built to solve the problem that all new traders face.
The Cloud
The indicator includes a moving average cloud which serves as a visual guide to local support and resistance. When price exits the cloud to the upside it typically trends above and finds support at the cloud during retracements.
Candle Colours
By default, TrendMaster will colour your candles in black and white. White candles indicate an uptrend in an asset and the candles will not change colour until the trend has reversed and a counter-trend signal has been printed. Black candles indicate a downtrend, they will remain black until a counter-trend long signal candle has been printed.
Setting Up The Indicator
TrendMaster is optimised for Heikin-Ashi candles. Using candles with smoothing applied decreases the likelihood of whipsaw losses and provides a stable visual representation of the trend. Ensure you have applied Heikin-Ashi candles to your chart before continuing. You can customise to any style of your choice provided the candle borders and wicks are set to a uniform colour that contrasts the chart background.
Entries and Exits
A long signal candle is a white Heikin-Ashi candle that closes above the cloud. A short signal candle is a white Heikin-Ashi candle that closes below the cloud. Entries are taken with a pending order placed at the wick with a reasonable margin for error.
Upgrading
The full version of TrendMaster contains significantly more functionality including coloured signal candles, stop loss and trailing take profit management, alerts and much more.
Our Story
Founded in 2018 by IchimokuScholar and C00kie, TrendMaster is a team that produces technical analysis indicators with an emphasis on simplicity and noise reduction. We support a large community with educational content, automated market scanners and mentoring in our private chat rooms. We produce technical analysis indicators geared primarily towards the emerging Cryptocurrency asset class. We provide educational material to assist trader development and host a large online trend following community. All of our products are designed to help traders distinguish relevant information from background noise. Our indicators encourage disciplined trade management to maximise the opportunity captured while minimising losses.
IchimokuScholar
IchimokuScholar – In 2017 I retired from a career in higher education to focus on Trading. I like to trade long term trends, focusing primarily on continuation setups. I am dedicated to sharing my knowledge of trading and take great pleasure in simplifying technical analysis for newer traders.
C00kie
I started trading crypto in 2017 and immediately started coding a bunch of tools to improve my quality of life. Some definitely worked out better than others. Like to trade the higher timeframes and drawing horizontal lines on charts. I am also pretty much obligated to like cookies.

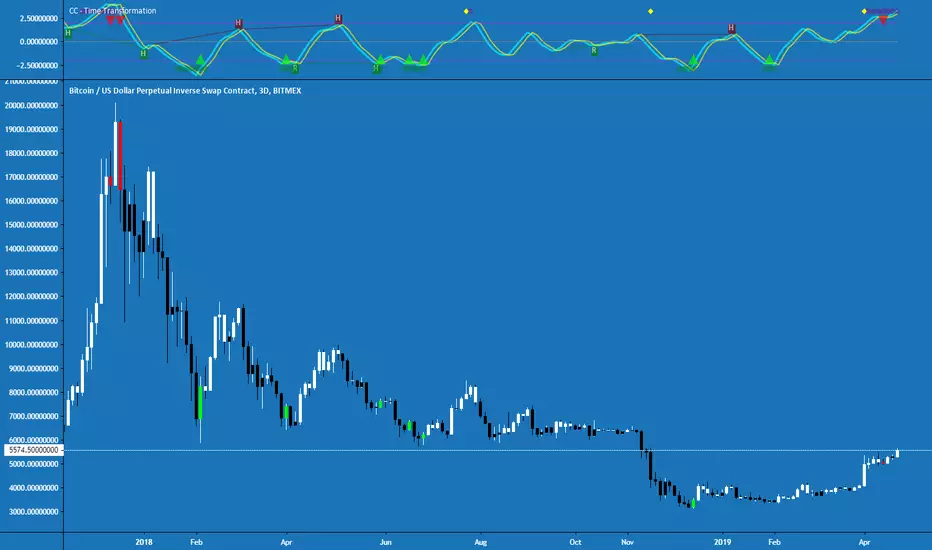
Cracking Cryptocurrency - Time TransformationTime Transformation is the creation of the Cracking Cryptocurrency Premium Trading Group . It's purpose is to provide volume , momentum, trend, and divergence at a glance. This limits the restrictions of a trader dramatically, by providing them with a powerful tool applicable on any asset, any time frame.
Momentum:
Time Transformation accurately interprets precise entry and exit positions in a ranging market via overbought and oversold conditions. When an asset is trending, these levels also indicate short-term exhaustion, and ideal profit taking levels.
These levels are completely customization, by adjusting the Cycle Length, and the boundaries of overbought and oversold itself. Also, with an advanced algorithm that calculates advanced price action, you can adjust this measurement for optimum results. One can even look at the momentum on a different time frame.
Trend:
Utilizing the power of Heikin Ashi to identify the dominant trend, this allows a trader to filter out the noise of Japanese candlesticks while still looking at their more accurate OHLC price information. Bars are colored pursuant to the dominant Heikin Ashi trend. One can also look at the Heikin Ashi trend of a higher or lower time frame to adjust the noise filtration.
Volume:
All traders know that we need volume for profitable movements. This indicator succinctly points out periods of unnatural volume , alerting a trader that a potential reversal or breakout may be occurring.
Divergence:
This Indicator understands fractal patterns of price action and oscillator movement. This allows for both Regular and Hidden divergence to be detected and displayed on the screen in real-time. One of the most powerful features of this indicator.
This Indicator boasts Multi-Time Frame features for both it's Momentum Oscillator and Trend Pattern Function, as well as fully adjustable settings for every function. Alerts are coded for every possible occurrence a trader could want.
Begin your journey towards market domination today. Allow this Indicator to Transform your Trading as it Transforms Time.
For access to this and all other Cracking Cryptocurrency Proprietary Indicators and Strategies, visit Cracking Cryptocurrency Premium Trading Group
Update Log:
-Adjusted default aesthetics to make Signal and Trigger Line more visible on a variety of backgrounds.
-Adjusted default aesthetics of zero line, overbought, oversold.
-Updated entire script to Pine Script Version 3.
-Updated Heikin Ashi Bar Recoloring Script - Will not re-paint, monitors the open and closing price and switches colors faster.
-Updated Input Setings for Multi-Time Frame feature. Much easier and more intuitive to select Time Frames from the drop-down menu.
-Simplified Input Settings, making them more intuitive.
-Updated Alert Messages to ease language barrier difficulties.
By Request: Added Alert Function for regular crosses.
Upcross = Fisher Crossing Over Signal Line.
Downcross = Fisher Crossing Under Signal Line.
Note that these are not buy/sell signals as per the Time Transformation strategy, as those crosses must occur in either overbought or oversold territory. :)
MokuMasterMokuMaster
MokuMaster is an advanced indicator built on Ichimoku Kinko Hyo.
Perhaps the most powerful function of Ichimoku charts is their depiction of trend conditions at a single glance. This is likely the original purpose of the technique, Ichimoku Kinko Hyo loosely translates to ‘one glance equilibrium chart’. When examining charts we use Ichimoku to determine directional bias. Should we be, 'Resolutely bullish', 'Bullish', 'Neutral', 'Bearish' or 'Resolutely Bearish'.
These categories are derived from the interactions between Price, the Tenkan-sen, the Kijun-sen, the Kumo and the Chikou Span. This can be overwhelming if you are not an accomplished Ichimoku trader.
MokuMaster allows you to view these interactions without the difficulty of interpreting what they mean. The definitions displayed below demonstrate how to use MokuMaster to determine directional bias.
Bright Green - Resolutely Bullish
Green - Bullish
Blue - Neutral
Pink - Bearish
Red - Resolutely Bearish
MokuMaster is designed to assist traders in establishing directional bias and not to replace traditional entry and exit techniques. We recommend using it in conjunction with TrendMaster for best results.
Our Story
Founded in 2018 by IchimokuScholar and C00kie, TrendMaster is a team that produces technical analysis indicators with an emphasis on simplicity and noise reduction. We support a large community with educational content, automated market scanners and mentoring in our private chat rooms. We produce technical analysis indicators geared primarily towards the emerging Cryptocurrency asset class. We provide educational material to assist trader development and host a large online trend following community. All of our products are designed to help traders distinguish relevant information from background noise. Our indicators encourage disciplined trade management to maximise the opportunity captured while minimising losses.
IchimokuScholar
IchimokuScholar – In 2017 I retired from a career in higher education to focus on Trading. I like to trade long term trends, focusing primarily on continuation setups. I am dedicated to sharing my knowledge of trading and take great pleasure in simplifying technical analysis for newer traders.
C00kie
I started trading crypto in 2017 and immediately started coding a bunch of tools to improve my quality of life. Some definitely worked out better than others. Like to trade the higher timeframes and drawing horizontal lines on charts. I am also pretty much obligated to like cookies.

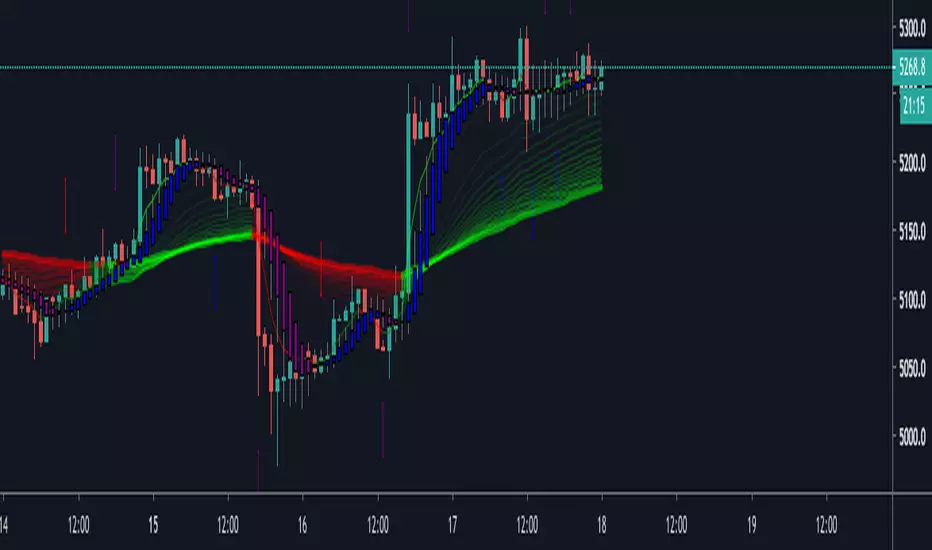
[astropark] EMA RibbonsHi Followers,
here a new free indicator: EMA RIbbons!
Please, don't trade without a check on chart! Here you have a lot of tools, today the EMA Ribbons!
On every timeframe, the EMA ribbons act as support or resistance for price action, and works nicely every where, from cryptocurrencies to forex, and on every timeframe!
Please let me know your point of view on comments below.
Enjoy and do Profits!
-- astropark
Do you like my free scripts? Offer me a coffee, a beer, a pizza or whatever :)
BTC jar: 1K5kuYQPEqoNo6GRmJbHWMPmqwKM5S3oRR
ETH jar: 0x091b541a6dd6fe08c4e7bd909baafb2fce9b975e
LTC jar: LSVoAChsZrVsvbNyUfdpxtFpDAUSaUTUig
XRP jar: (XRP deposit tag) 103997763 (XRP deposit address) rEb8TK3gBgk5auZkwc6sHnwrGVJH8DuaLh
PS: Do you need a customization or do you need a dev who implements your strategy? send me a private message ;-)

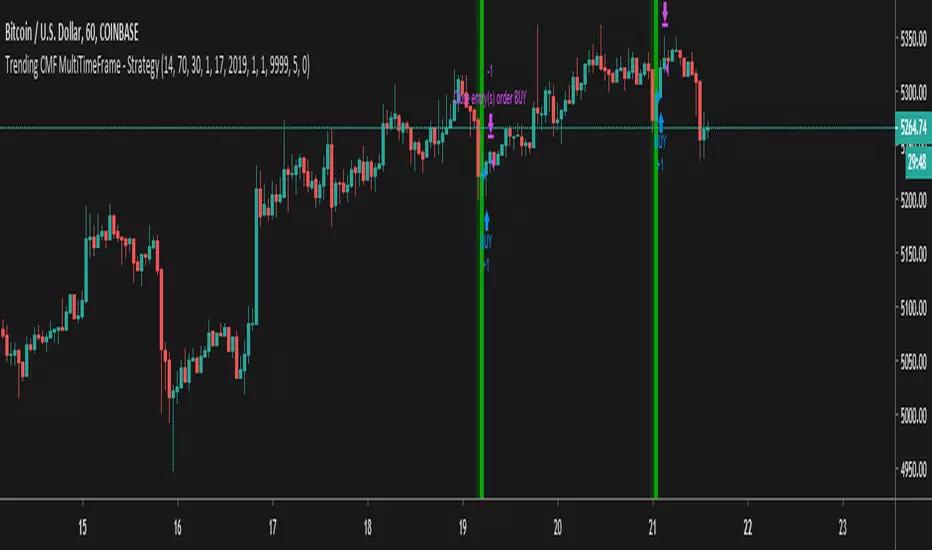
Trending CMF MultiTimeFrame - Strategythis is the strategy for the script below
Multi time frame crypto trader
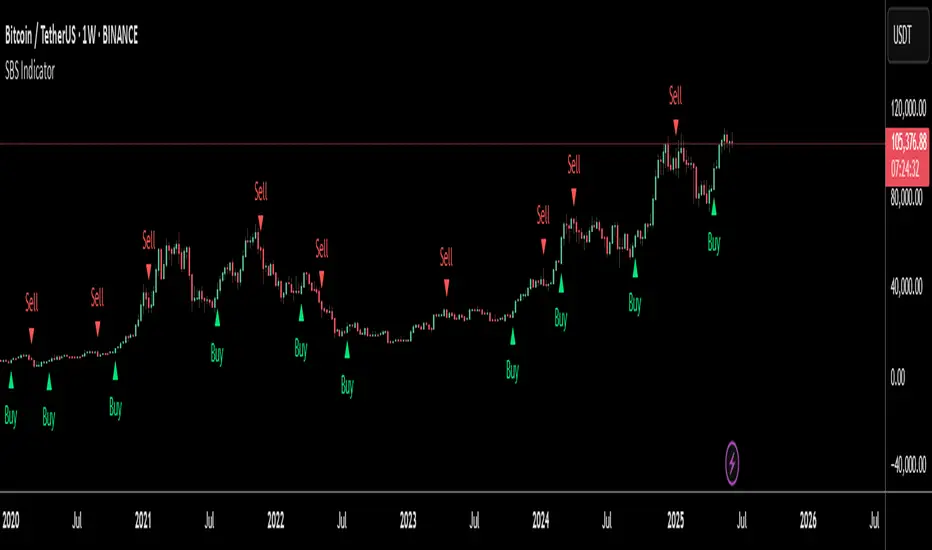
Scalping Buy and Sell IndicatorThis is the final version of scalping Buy and Sell Indicator, which is a combination of few indicators such as EMAs, MAs, Rsi, and MACD. It best used on 1hr, 4 hrs and smaller TimeFrame for scalping on Bitmex and other exchanges.
Buy symbol paints below the candle and sell symbol paints above the candle.
Buy and Sell Alerts are added for this indicator. In the Alerts window, please choose the option "Once the candle closes" for best results.
This is an invite-only script. Please message me or mail me for access. I am giving access to limited people only.
SHA & MMAR Strategy Alert IndicatorIndicator w/ alerts for 'Slow-Heiken Ashi & Madrid Moving Average Strategy'.
High win-percentage with cryptocurrencies on a 1H timechart.
PpSignal Coppock CurveIntroduction
The Coppock Curve is a momentum indicator developed by Edwin “Sedge” Coppock, who was an economist by training. Coppock introduced the indicator in Barron's in October 1965. The goal of this indicator is to identify long-term buying opportunities in the S&P 500 and Dow Industrials. The signal is very simple. Coppock used monthly data to identify buying opportunities when the indicator moved from negative territory to positive territory. Although Coppock did not use it for sell signals, many technical analysts consider a cross from positive to negative territory as a sell signal.
Signals
Using monthly data, this indicator will not trigger very many signals. A buy signal triggers with a cross into positive territory, while a sell signal triggers with a cross into negative territory. Unsurprisingly, there have been only five signals since the late 1980s. The chart below shows the last four signals. The first signal triggered in 1988, which was after the 1987 crash.
Conclusion
The Coppock Curve is simply a smoothed momentum oscillator. Even though it was originally designed for monthly charts and long-term analysis, it can be used on intraday, daily or weekly charts and the settings can be adjusted to suit one's style. The main signals are generated with crosses above and below the zero line. More aggressive chartists can consider looking for bullish and bearish divergences to anticipate such crossovers. Use caution, however. Divergences do not always result in trend reversals because the trend can simply slow and continue in the same direction.
stockcharts.com

[astropark - Premium] 3m-5m-15m-30m Renko ScalperHi Followers!
Is it possibile to multiply your capital by 30 times in one year?
YES, it is! Just use this script on Renko charts!
This script is the study version of this strategy:
Why is this version necessary? With this script you can set alarms and get notified when a new signal appears on the Renko chart ! With strategy you can't!
This strategy works great at following timeframes:
30 minutes
15 minutes
5 minutes
3 minutes
Keep in mind that this is not the Holy Grail and price manipulation can create great volatility!
So always set a stop loss in trades, like -3%/-5% from entry point, depending on your risk management style.
This is a premium indicator , so send me a private message in order to get access to this script.
Do you like my scripts? Offer me a coffee, a beer, a pizza or whatever :)
BTC jar: 1K5kuYQPEqoNo6GRmJbHWMPmqwKM5S3oRR
ETH jar: 0x091b541a6dd6fe08c4e7bd909baafb2fce9b975e
LTC jar: LSVoAChsZrVsvbNyUfdpxtFpDAUSaUTUig
XRP jar: (XRP deposit tag) 103997763 (XRP deposit address) rEb8TK3gBgk5auZkwc6sHnwrGVJH8DuaLh
PS: Do you need a customization or do you need a dev who implements your strategy? send me a private message ;-)

CUSTOM Crypto-Adjusted Moving AverageThis is a custom configuration of the Crypto-Adjusted Moving Average for TradingView user: JustCIO
This moving average can be applied to any Crypto-currency and ANY time-frame!
This custom moving average is adjusted to give weight to the performance of 14 specific Cryptocurrencies.
This is the Crypto-Index that affects the moving average.
BNB
BTC
BCH
ADA
DASH
DGB
EOS
ETH
LTC
NEO
XLM
TRX
XRP
ZEC
The use of this indicator is to observe divergence between the price of the underlying asset that is the basis of your chart, and the rest of the Crypto-currency market.
If more Crypto-currencies go down while your observed currency goes up, the CAMA will sit lower and a blue pool will become visible showing that that the chart is performing better than the Crypto-Weighted Index listed above. If more Crypto-currencies go up while your observed currency goes down, the CAMA will sit higher and a red cloud will form, showing that the chart is performing worse than the Crypto-weighted Index.
The indicator uses two variables that can be changed:
"MA_Length" = This is the length of the moving average and is set to 50 by default.
"CryptoFactor" = This is the weighting given to the movement of the Crypto-Index. Essentially, this is the factor as to how much the movement of the Crypto-Index effects the weight of the moving average. If you set this at 0, the line will be a simple moving average of the set length without any affect of the Crypto-Index.
By default, the CryptoFactor is set to 0.8.

Ichimoku Cloud Trend Long AlertsFantastic trading system allowing for high probability trading.
I prefer to use lesser timeframes, like in this example, for lower probability per trade but higher % profits over time. On some timeframes probability can be between 70-100%.
Settings for cryptocurrency:
Conversion: 20
Base: 60
Span B: 120
Displacement: 30
Enjoy!
TIP: I've noticed that when a new coin launches after IEO this script can work on small timeframes (15m) and with the Base and Span settings halved. This usually gives good results if ran for approx. five days from launch. Particularly with Huobi and Binance launches.

Ichimoku Trend Long StrategyFantastic trading system allowing for high probability trading.
I prefer to use lesser timeframes, like in this example, for lower probability per trade but higher % profits over time. On some timeframes probability can be between 70-100%.
Settings for cryptocurrency:
Conversion: 20
Base: 60
Span B: 120
Displacement: 30
Enjoy!
Please contact me for version with alerts for use on bots like ProfitTrailer, 3Commas, Gunbot etc.


Crypto grabberSo, its my first position in crypto (and not only crypto) bots series. What we have there.. program writting on Pine script language what can analyse market data of any trading instrument and signalise to enter the deal. Its next versions will update. Trade system based on my x-volume indicator.In central part of system is analyzing volume accumulation and distribution process which decide good and bad time for investing.
So some important points:
1) In time when you change timeframe or trading symbol bot analise all bars history. The number of trading (signal) candles in the analysis history is marked in black.
2) The percent of profitable signals is marked in blue.
3) Total profit points are marked in green.
4) Total bars in history are marked in red.
For better indicator vision you can turn off non interesting plots in settings menu.
There is two kinds of alerts: Buy alert and Sell alert. Set it once per bar close or every minute ( because the best way you must open the deal at 20 sec before bar close ).
This trading system is great for creating a profitable trading portfolio. Try it yourself to find exchanges and cryptocurrencies with profitable historical views. For example, the KRAKEN exchange trades well: XBTCAD, XBTUSD in 30-45 min timeframe.
I will do better settings in new versions of this bot. Waiting your likes)
