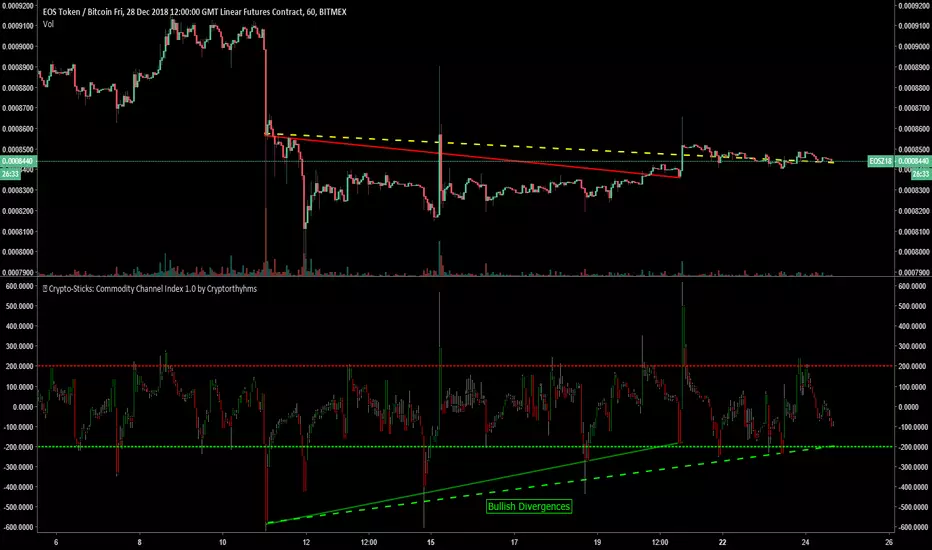
🥢 Crypto-Sticks: Commodity Channel Index 1.0 by Cryptorthyhms🥢 Crypto-Sticks™ CCI
A new series of indicators brought to you by Cryptorthyhms...giving you an alternate look at your trusted favorites!
🚀 Indicator Specific Info
I have found this indicator to show divergences as shown on the main chart. It also iuncludes the standard signaling system from CCI allowing you to define overbought and oversold zones. This indicator is freely available for anyone from the public library.
🚀 Crypto-Sticks General Info
💭This series isnt polished 100%, and I have some more options I will add in the future. But for now, I want to just release them, as I am not sure when I will have the time to put more work into them (many other big projects I am working on).
📊Its basically reinterpretations of all your favorite indicators. I calculate the values a little bit differently than normal, but the end result is creating a candlestick chart (for the indicator!). Then I added the option to plot them as Heiken Ashi candles to smooth out noise and make signaling easier. Here's how it looks as Heiken Ashi:
🔊Lastly I implemented a Volume Weighting system for them all which simply integrates volume into the formulas for these indicators. For the most part this feature is experimental and doesn't provide huge utility (yet - I have other ways I want to try it as well - just no time). Though on some of the indicators it already shows great promise. Here is Volume Weighted + Heiken Ashi:
👍Enjoying this indicator or find it useful? Please give me a like and follow! There are many more indicators to be released in this series, not to mention I post crypto analysis and other free indicators regularly.
💬Questions? Comments? Want to get access to an entire suite of proven trading indicators? Come visit us on telegram and chat, or just soak up some knowledge. We make timely posts about the market, news, and strategy everyday. Our community isnt open only to subscribers - everyone is welcome to join.
Wskaźnik impetu (CCI)
CCI MTF: Multi-timeframe CCIThis script can be quite useful to get a quick glance at momentum readings in the 3 main timeframes I use: Daily, Weekly and Monthly.
It helps, together with RgMov and the MTPC tool, to know how a market is moving and what to expect, without having to cycle through two or three timeframes constantly.
Cheers,
Ivan Labrie.

Trader Set - Woodies Super CCIThis a color coded of woodies supper CCI, everyone knows about woodies CCI, but supper CCI is something he put in together lately, like some other things from his system, the original idea of color coding CCI on different lines was not his !
I moved the chopzone to 150, imo, chopzone sitting close to sidewinder gives easier feedback to read, also, if you notice, other than the base line's color code, i have two lines that are similar to eachother, these are showing the relative positions of turbo, cci, and regression with eachother, three circles at the right side show turbo, cci, and regression's positions relative to the horizontal zones. In other words, when things get really close to eachother, no more guessing needed. one more thing that I may add to this tommorrow is to put signalling signs on the lines when they cross to help identifying the crosses and the color would code you toward possible positions in "MY" system.
Please, don't ask for access, only my students from my classes will have access to this indicator, at least for time being. If at any time in future I wish to sell, you will find the price and how to buy in the comments bellow.

Trader Set - Uni Renko MCCIThis is what Woodie calls MCCI, a band of moving averages.
The name MCCI means Moving Commodity Channel Index, although it's one of the rare woodies original indicators (shame on you woodie lol) he suggests that the relation between the bars or price with the bands are something like the movement of the CCI indicator. I can't accept that. For me, these bands have other usages that I teach to my students.
To use this, you should set your chart on Renko, Traditional with box size of 3.
Please, don't ask for access, only my students from my classes will have access to this indicator, at least for time being. If at any time in future I wish to sell, you will find the price and how to buy in the comments bellow.

CCI Highlighted [ankit4349]>> This script is purely based on Commodity Channel Index (CCI) with multiple CCI instances being used within one oscillator.
>> User can use as much as 5 CCI instances/plot within one oscillator.
> How to use :
1. When Bullish :
Whenever CCI length 14 crosses above -100(negative 100) that means bullish momentum is supported.
Best bullish/long entry would be when CCI length 14 crosses above -100(negative 100) as mentioned above and at the same time CCI length
200 is bouncing on top of +100(positive 100).
2. When Bearish :
Whenever CCI length 14 crosses below +100(positive 100) that means bearish momentum is supported .
Best bearish/short entry would be when CCI length 14 crosses below +100(positive 100) as mentioned above and at the same time CCI length
200 is bouncing at bottom of -100(negative 100) .
> Color Clarity :
a. Bullish support is highlighted GREEN and bearish support is highlighted RED within the oscillator background with respect to
Length 1 (i.e 14 by default) .
b. PURPLE is highhighted when Length 5(i.e 200 by default) is bouncing either on top of +100(for bullish) or at bottom of -100(for bearish).
c. AQUA is highlighted when Length 3(i.e 50 by default) is bouncing on top or at bottom of 0 from either side respectively.
d. Best entry in both cases i.e bullish or bearish as mentioned above('How to use') is highlighted WHITE by default.
> Tip:
Just observe the color outputs on any timeframe in a chart as it works fractally on every timeframe , it will help you understand better with
clarity.
> You are always free to experiment with the CCI lengths, change highlighted color and hide/unhide the Lengths as per your requirements in
setting/format .

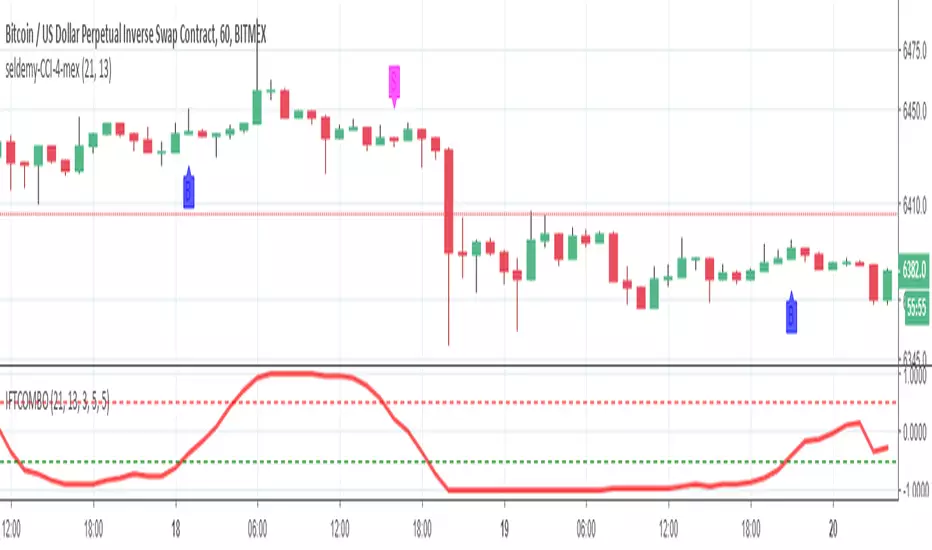
Seldemy-CCI-for-Auto4mexThis is the script I used in BITMEX for auto trading XBTUSD using great Chrome extension called Auto4mex . Default settings are good for 1h candle nowadays (September October 2018 period for Bitcoin). If more volatility comes adjusting needed. Enjoy !
yutas_CCI+RCIS+StochRSI_ver.freever .free
CCI×3
RCI×3
StochRSI cross sign × 1
It can be used as a material to judge the flow by closing CCI , RCI -2.78% and StochRSI.
Three CCIs and three RCIs can be displayed.
With the time axis change function, you can check the flow on one screen.
It is easy to grasp the flow of the whole by watching the eye with one hour's feet etc.
Let's aim at when all directions are complete.
※There will be no upcoming updates as it will be a free public version.
CCIとRCIとStochRSIのクロスで流れを判断する材料に使えます。
CCIとRCIはそれぞれ3本表示可能。
時間軸変更機能により、1画面で流れを確認出来ます。
1時間足等を使って、目を細めて見ると全体の流れを掴みやすいです。
全ての向きが揃った時を狙いましょう。
※無料公開バージョンになりますので今後の更新はない予定です。


3D Alien CCI - GyromaticalNovelty graphical CCI.
White background bar indicates CCI is over/under +100 or -100.


CCI Cycle (Modified Schaff Trend Cycle)This is a modified Schaff Trend Cycle (STC), which is designed to provide quicker entries and exits.
I've been a huge fan of the STC for a long time, but being based on the MACD means its signals often lag by a bar or two (especially in fast moving markets). All I've done here is take the base STC script (all credit to user @LazyBear), and change the source to a modified CCI.
The CCI Cycle provides more timely entries and exits, often by 1-2 bars. The flip side of the increased responsiveness is a prevalence for more false signals (a perfect example is the 17th August on the above chart). It's the nature of the beast! Still, I've been using this for a few months now and it's (in my opinion) an upgrade on the standard STC.
As always, you will need to pair this with another indicator or method of technical analysis to provide a trade bias, as the CCI Cycle (and STC) aren't designed to trade every signal. In my experience, either divergence identification, or using one or more moving averages works particularly well.
The indicator is also MTF capable, so you can get some interesting results from that.
Any queries let me know.
DD

yutas_CCI+RCIS+StochRSIver .1.0
CCI×3
RCI×3
StochRSI cross sign × 1
It can be used as a material to judge the flow by closing CCI, RCI and StochRSI.
Three CCIs and three RCIs can be displayed.
With the time axis change function, you can check the flow on one screen.
CCIとRCIとStochRSIのクロスで流れを判断する材料に使えます。
CCIとRCIはそれぞれ3本表示可能。
時間軸変更機能により、1画面で流れを確認出来ます。


Divergence TraderThe indicator catches the regular and hidden divergences on indicators like RSI, CCI and Williams %R. It is possible to select the indicator to be used for catching the divergences and multiple selection is possible. The script not only runs on Crypto trading but also Forex or DXY and EXY along with. The signal type can be selected as "Long/Short" or "Buy/Sell". Since the divergence does not occur sequentially, same signal may appear after the signal. There is no repaint, as the signal appears on the newly opened candle and it means the conditions are met and signal is solid to follow from the beginning time of candle. Besides, confirmations can be set for previous candle's high/low, previous candle's green or red, High/Low Doji or Body Doji candles. Doji sensibility can be set separately. There are 2 divergence calculation mode, each has to be used separately as they effect's calculation parameters differently. Alarms are defined in the indicator as again Long, Short, Buy or Sell.
Along with all of these, the entry point confirmations can be set as in indicators (ie. CCI has to be over 100 when Long condition met.) The confirmation code works separately from the divergence indicators so there is no need to use CCI divergence for confirmation. However, both divergence and confirmation source and length are the same.
The indicator does not depend on intervals. It focuses directly to divergences on the indicators.
Roadmap:
- MACD divergence integration
- Stoch RSI divergence integration
- Seperation of indicator confirmation modules and divergence base indicators in terms of length and source
- Implementation of exaggerated divergences

Indicator Top/Bottom Marker v3Marks the candles regarding indicator reaches to top or bottom defined level.


Ichi Trend Follow SystemBased on RSI, CCI, and Ichimoku Cloud. Bars are colored according to bullish or bearish potential.

WT3 speedup[WOZDUX]=Velocity and acceleration of the CCIModification of the CCI indicator WT3.
1) three indicators in one window. "kluch2" includes display 2 additional lines.
2) you can calculate the indicator by closing price and you can calculate the volume price. The key is the "key" includes the calculations according to the bulk price.
3) "kluchperegib" shows inflection points
4) For the line with the period "n1" the width of the channel on which it moves is calculated. The channel helps to track the boundaries of fluctuations.The channel width is Set in the "lband" variable.
5)" obLevel1 " defines the critical levels for the cci indicator.
6) since the meaning of the cci indicator and its modification wt is that it is the speed of price movement. Calculate the acceleration of prices. the variable "nwt"is used for this purpose.
The lilac line shows the acceleration of the price. Acceleration used to warn us about the reversal of the movement.
The General line of the indicator and the acceleration line together give more accurate information about the market mood. If the acceleration falls from top to bottom in advance, then wait for a quick price reversal from top to bottom. If the acceleration starts to rise from the bottom up, then also wait for a turn from the bottom up.
---------------
Скорость и ускорение CCI .
Модификация индикатора CCI под названием wt.
1) три индикатора в одном окне. "kluch2" включает дисплей 2 дополнительных линий.
2) Вы можете рассчитать индикатор по цене закрытия, и вы можете рассчитать цену объема. Ключ "ключ" включает в себя расчеты по объемной цене.
3)" kluchperegib " показывает пункты перегиба
4) Для линии с периодом "n1" рассчитывается Ширина канала, по которому она движется. Канал помогает отслеживать границы колебаний.Ширина канала Задается в переменной "lband".
5) "obLevel1" определяет критические уровни для индикатора cci.
6) так как смысл индикатора cci и его модификации wt заключается в том, что это скорость движения цены. Рассчитаем ускорение цены. для этого используется переменная "nwt".
Сиреневая линия показывает ускорение цены. Ускорение раньше предупреждало нас о развороте движения.
Общая линия индикатора и линия ускорения вместе дают более точную информацию о настроении рынка. Если ускорение падает сверху вниз заранее, то ждите быстрого разворота цены сверху вниз. Если ускорение начинает подниматься снизу вверх, то также ждите разворота снизу вверх.

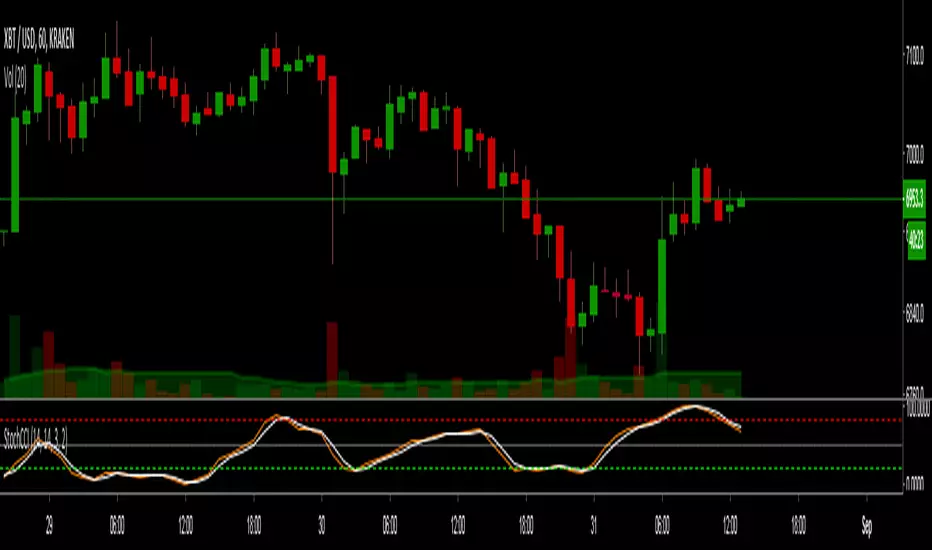
Stochastic CCIThis indicator is a Stochastic version of the regular CCI (commodity channel index).
For those of you who like a stochastic version of RSI, now you have one for CCI.
Enjoy!!!
drnk_CCIClassical CCI gives the mean deviation of typical price ((high+low+close)/3) value to the simple moving average of typical price
drnk_CCI is using the same mathematical formula but configuration let you choose average type to calculate the mean deviation.
Default values gives the classic CCI
MACD for Buy & Sell signal indicatorMACD for Buy & Sell signal indicator last part of Buy and sell signal set. It was coded base on CCI source. Allow trader can read volume trade on market
1 set buy and sell signal
1- Buy & Sell signal indicator
2- RSI for Buy & Sell signal indicator
3- MACD for Buy & Sell signal indicator
*********************************************************************************************************************
Gửi anh chị trader đây là chỉ báo cuối cùng trong bộ chỉ báo tín hiệu mua bán. Là chỉ báo điều kiện sử dụng cùng với chỉ báo RSI để giúp cho nhà đầu tư đưa ra quyết định kịp thời dựa trên tổng số khối lượng gd thời điểm hiện tại
