Yearly OHLplots Yearly Open, High, Low levels Interesting interactions to note at previous yearly opensWskaźnik Pine Script®od Chonky_158
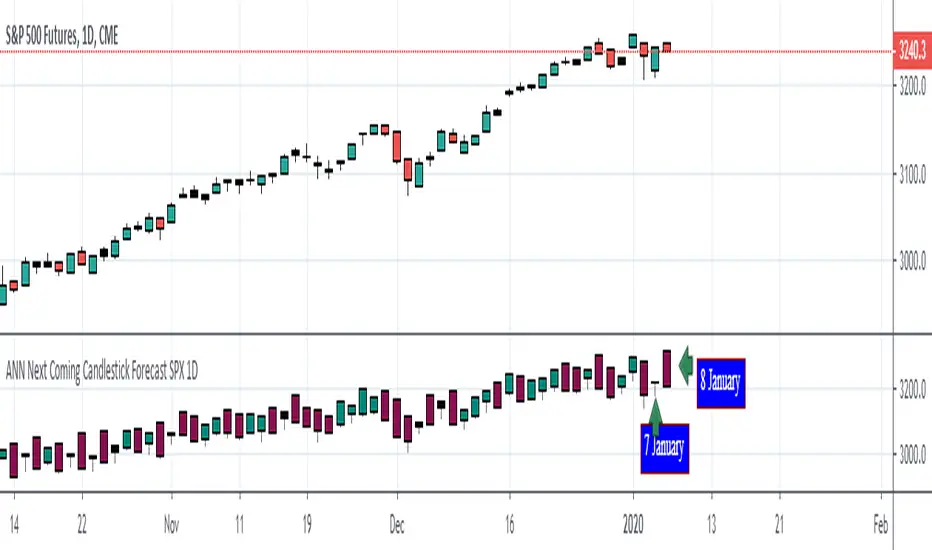
ANN Next Coming Candlestick Forecast SPX 1D v1.0WARNING: Experimental and incomplete. Script is open to development and will be developed. This is just version 1.0 STRUCTURE This script is trained according to the open, close, high and low values of the bars. It is tried to predict the future values of opening, closing, high and low values. A few simple codes were used to correlate expectation with current values. (You can see between line 129 - 159 ) Therefore, they are all individually trained. You can see in functions. The average training error of each variable is less than 0.011. NOTE : This script is designed for experimental use on S & P 500 and connected instruments only on 1-day bars. The Plotcandle function is inspired by the following script of alexgrover : Since we estimate the next values, our error rates should be much lower for all candlestick values. This is just first version to show logic. I will continue to look for other variables to reach average error = 0.001 - 0.005 for each candlestick status. Feel free to use and improve , this is open-source. Best regards. Wskaźnik Pine Script®od NoldoZaktualizowano 55585
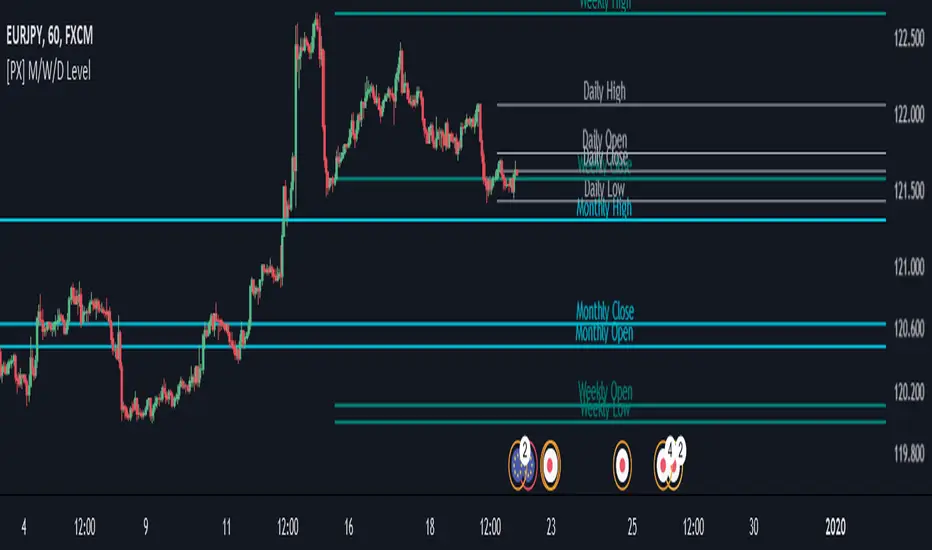
[PX] M/W/D LevelHey guys, this script shows monthly, weekly and daily OHLC data represented as horizontal level. I tried to make it as user-friendly as possible. Therefore, you can add different colors and styles for each level, as well as turn them on and off. With the "Label Offset" -parameter you are in control where the label text should appear. You can shift it from left to right and vice-versa. To shift it to the left choose a negative value. To shift it to the right use a positive one. This best setting for me personally is the "Candle Selection" -dropdown. This allows you to decide wether you want to show the previous candles OHLC-data or the current live OHLC-data. !!CAUTION!! If you use the "Current Month/Week/Day" -selection be aware that values shown are "live"-data of the current candle. Therefore, values will change the same way your chart keeps changing on live data. The "Previous Month/Week/Day" -selection on the other hand is historical data and therefore only changes once we reached a new month/week/day. If you like my work, consider leaving a like :) Happy trading! Wskaźnik Pine Script®od paaax1717641
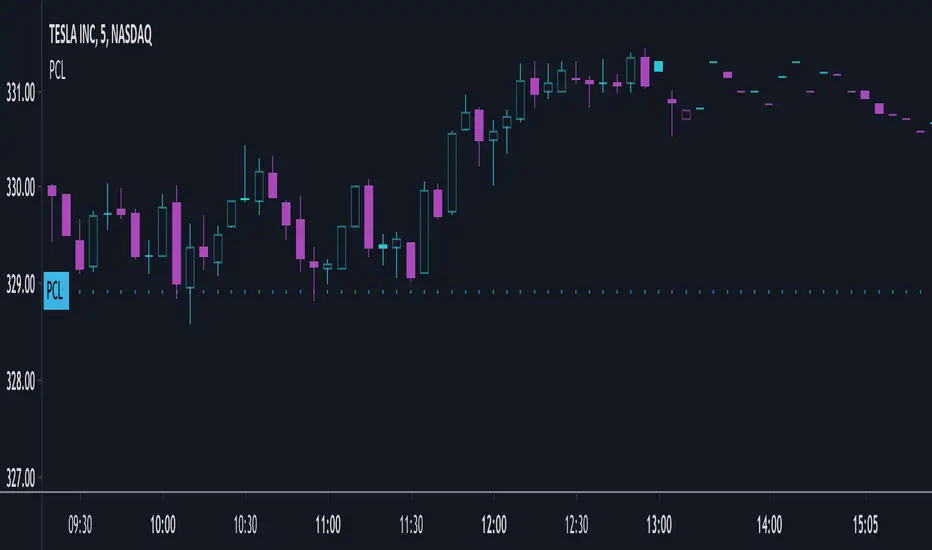
(PCL) Previous CloseI have recently been reading How to Day Trade for a Living by Andrew Aziz and one of the important support and resistance levels he talks about is the Previous Day Close Price. I did not find an indicator that would simply plot this so I wrote a short simple pine script to plot the indicator. Please feel free to edit or suggest improvements.Wskaźnik Pine Script®od PremiumAlgos2323413
Previous OHLC LevelsQuick dirty code for personal use. Plots previous OHLC levels based on a selected time-frame on the chart. Not bad if you want to see different time-frame levels. Fill function can serve to highlight the daily range (high-low or open-close) on non-standard charts Uses base code from JayRogersWskaźnik Pine Script®od kewbimingle11548
Support/Resistance Zones x3Support and Resistance Levels + Zones for 3 time frames, based on volume at fractal levels with Zones based on wick size which is a true reflection of a Zone when compared to other S/R Zone scripts which only use a thick line not based on anything. Original script is thanks to synapticex I have just migrated to version 3, heavily modified it and added Support and Resistance Zones.Wskaźnik Pine Script®od Lij_MCZaktualizowano 3131 2.8 K
Range: OHLC vs Previous OHLCThis will plot your choice of OHLC (or any of the averaging choices) of the current candle compared to the previous candle. For example if you choose "high" for the input and set the chart to daily, you'll see the currently daily high vs the previous daily high. Green candle represent a higher high and the length of the candle represents how much higher. Red candles represent a lower high than the previous day and the length is by how much lower. This indicator is pretty straight forward, look for me to build on this with something a little more elaborate in the near future.Wskaźnik Pine Script®od oldinvestor84
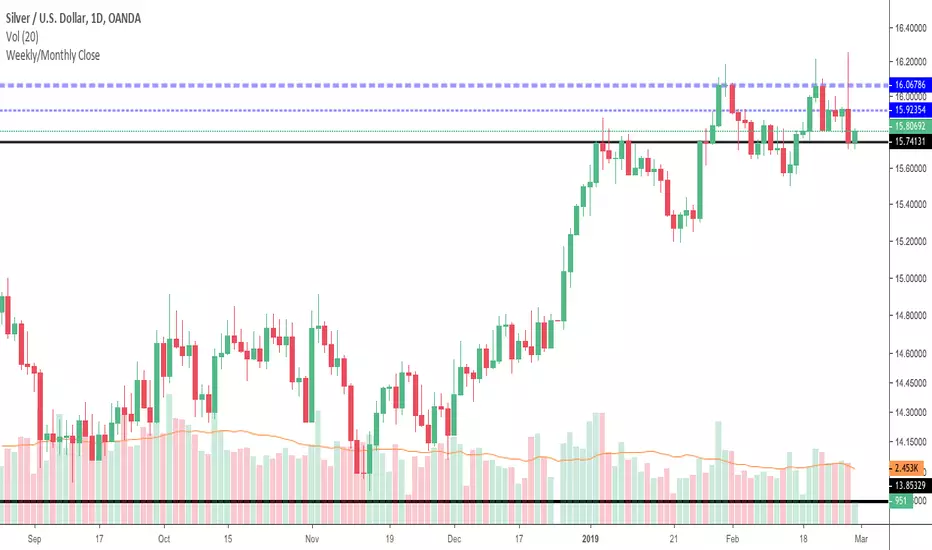
Weekly/Monthly CloseJust a simple support/resistance indicator that display weekly/monthly close price and it is configurable to work in two modes: tracking mode - to display last week/month's close history mode - to display weekly/monthly close prices See how last month's close (ticker blue line) provides nice resistance and the price forms a double top then it consolidates under last week's close line (thiner blue line). It also works on intraday charts and displays history close prices, see below how last month's close (ticker blue line) provides support over and over and also how price bounces off weekly close history prices (thiner blue line). Wskaźnik Pine Script®od icostan55614
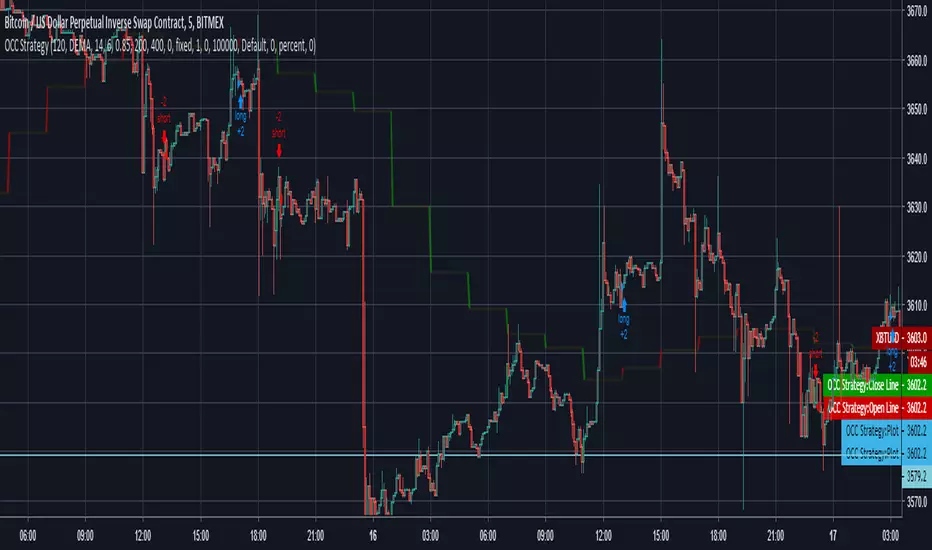
Open Close Cross Strategy // Real Back Test // Not goodI changed close series because, close series doing repaint. I changed the near series with the previous open series . but can use for sup and resistanceStrategia Pine Script®od Erkam11104
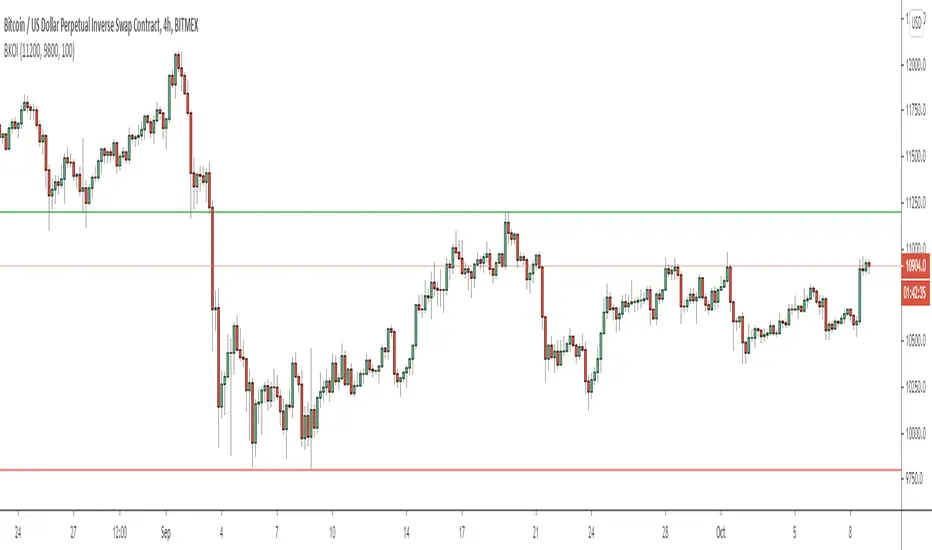
Breakout IndicatorThis script allows you to set breakout alerts. An alert will be triggered only when price breaks and closes beyond the specified prices. You will get an alert on the first candle that closes beyond the levels you set.Wskaźnik Pine Script®od ZenAndTheArtOfTradingZaktualizowano 1515 3.6 K
LongSetups with Entry Signals and Trailing Stop(HA)High probable Long Setups for any time frame and asset. 75+ win rate Trailing stop always used as exit point To trade only with the trand - enable MAs in the Inputs tab x - means Entry signal is active and waiting for long validation B - on a closed bar is entry signal for long C - on a developing bar is exit long signal Green line - long validation line. must close above to go long Pink line - trailing stop On Long Entry alert - use Once Per Bar Close option. On Long Exit alert (Trailing stop triggered) - use Once Per Bar option to trigger sooner and protect your capital. Always do your own analysis and make trades on your own risk. Find a confluence point where everything aligns and make your own decision. Don't enter a trade because the indicator tells you so. You are free to make a copy of the script and change it to your own needs for your own personal use.Wskaźnik Pine Script®od emkill2005Zaktualizowano 11203
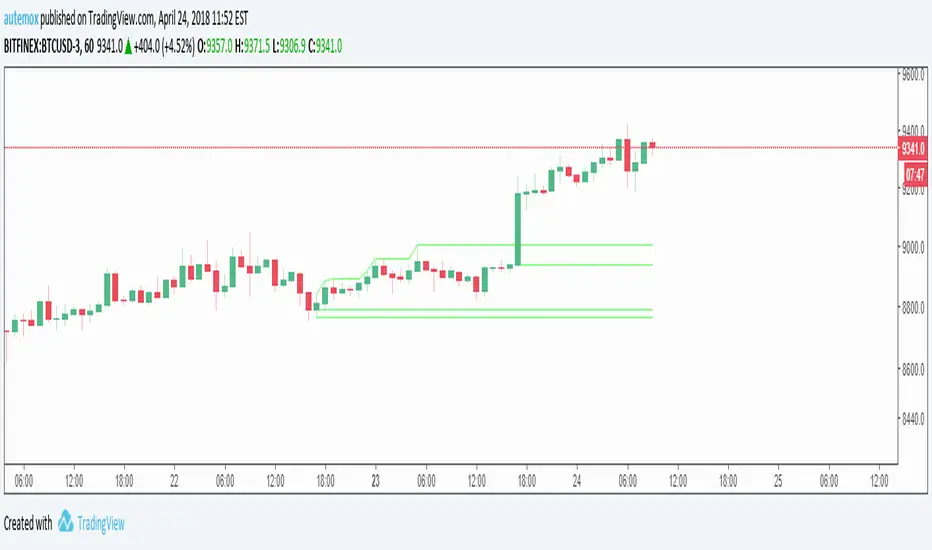
Yesterday Line: Lines at Yesterday's Open, Close, High, and Lowcreated by AutemOx twitter: @joyrider5 reddit: /u/joyrider5 This creates lines at yesterdays open, close, high, and low. It is pretty amazing use of the timenow and dayofweek variables if I say so myself 8)Wskaźnik Pine Script®od autemoxZaktualizowano 33495
Not closed yet scriptI made this to serve as a reminder if a candle is not closed yet. This is to avoid entering a trade based on a candle that is not closed because this candle could look alot different by the time it closes. Good luck.Wskaźnik Pine Script®od UnknownUnicorn373805Zaktualizowano 1178
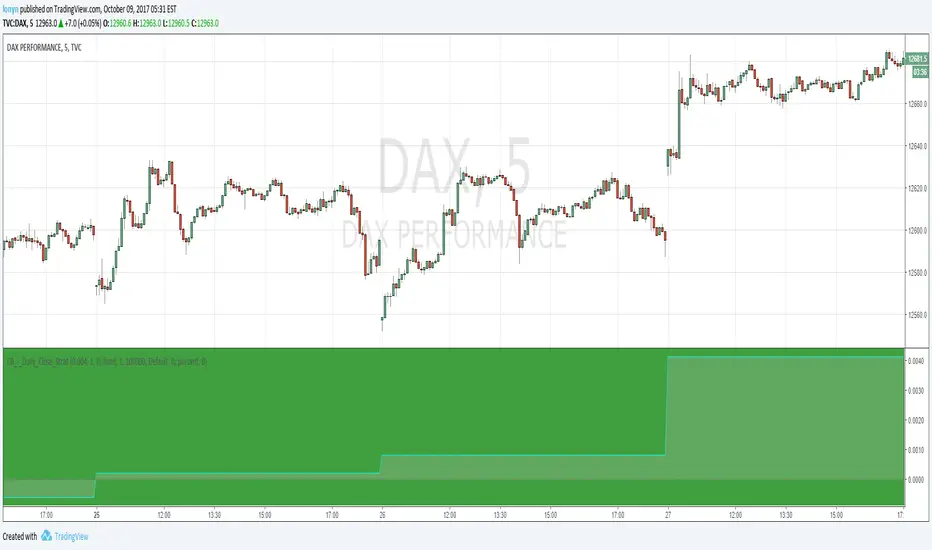
Daily Close repainting resultsit's a repainting script cheating on tester, on backtesting %100 correct but on forward testing it will only work % 15 correct and %85 wrong. I did another script showing real forward testing results of this script.Strategia Pine Script®od lonyn33120
Daily Close correct resultsit's showing the correct results of a repainting cheating scriptStrategia Pine Script®od lonyn44102
Previous Daily Open/High/Low/CloseThis indicator plots the previous day's open, high, low and close levels on the chart Published by Luke (DisciplinedTrader.co.uk)Wskaźnik Pine Script®od disciplinedtrader33826
MTF Previous Open/Close/RangeThis indicator will simply plot on your chart the Daily/Weekly/Monthly previous candle levels. The "Auto" mode will allow automatic adjustment of timeframe displayed according to your chart. Otherwise you can select manually. Indicator plots the open/close and colors the high-low range area in the background. Hope this simple indicator will help you ! You can check my indicators via my TradingView's Profile : @PRO_Indicators Wskaźnik Pine Script®od PRO_IndicatorsZaktualizowano 66 2.1 K
[M]HLC PlotsHLC Plots Draws points (lines) to high low and close. In some trading situations, this method is more convenient than candles or bars. -------------------------------------- Рисует точки(линии) по high low и close. В некоторых ситуациях торговли такой способ бывает удобней, чем свечи или бары. На вкус и цвет все фломастеры разные =) Wskaźnik Pine Script®od Maga363
Close of relevant previous periodThis indicator puts the previous close value of a higher relevant time frame on the chart, it adepts to the period of the chart. Relevant means that it puts: Close of previous year in monthly chart Close of previous month in weekly chart Close of either previous month of week in daily chart, default setting is week Close of previous week in 4hourly and 3hourly charts Close of previous day in 30minute and higher intraday charts Not bother the user below 30 minutes.Wskaźnik Pine Script®od eykpunter290
Weekly closeIt turned out not to be that easy to plot the close of the previous week in hourly or daily charts. In my first experiments things went wrong on Friday or intraday if you simply use the security function. So here is the thing with an algorithm that guaranties the correct value.Wskaźnik Pine Script®od eykpunter200
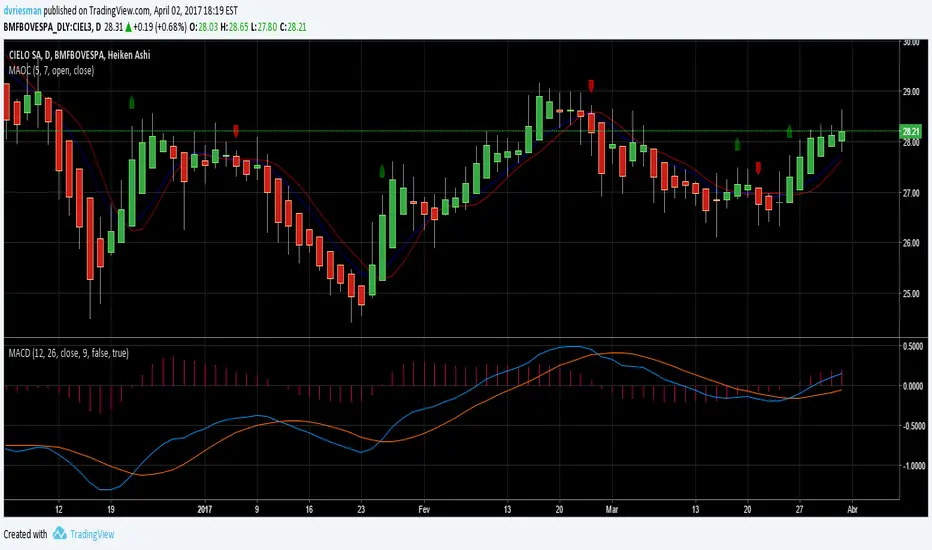
Moving Average Open vs CloseA 5 Open vs 7 Close days moving avarage difference.Wskaźnik Pine Script®od dvriesman116
Open/Close Vertical Line by WiscoDishOpen and close lines. I used a 4 minute timeframe, so the open price goes on 08:28-08:32 central time for the 8:30 open. You can change those times if you want, just copy/paste the script and edit.Wskaźnik Pine Script®od evandisher88266
Open Close Cross Alert R6 by JustUncleLThis revision of this indicator is an Open Public release. The indicator alert based on JayRogers "Open Close Cross Strategy R2" and is used in conjunction with the revised "Open Close Cross Strategy R5". Description: This indicator alert created for TradingView alarm sub-system (via the alertcondition() function, which currently does not work in a "Strategy" script). Also this indicator plots the Difference Factor between the Close and Open Moving Averages, this gives a good indication of strength of move. Also included in this release is optional Divergence finder with variable width channel. Wskaźnik Pine Script®od JustUncleLZaktualizowano 8383 3.4 K