Chaikin MF% (CMFP) w. Alerts, Bells & Whistles [LucF]This is Chaikin’s Money Flow indicator on a 0-100 scale with buy/sell signals, alerts and other bells & whistles.
It includes:
- a fast EMA (16 periods by default),
- a slow MA (64 periods by default),
- histograms,
- 3 different sorts of crosses,
- big swings identification,
- buy/sell signals on CMFP crossing back from outside user-defined levels,
- buy/sell signals on the slow MA pivots above/below user-defined levels,
- alerts on big swings and buy/sells.
This indicator started with @LazyBear code (VAPI) at:
@cI8DH then changed the scale to 0-100, which I find very useful:
I then added the rest.
The chart above shows both clean and busy versions of the indicator.
Note that the default length is 10 rather than the commonly used 20. I use CMFP in conjunction with VFI and like the fact that it is faster than VFI. The default inputs show the way I normally use this indicator, with the slow MA shown in histogram mode. I find it gives good context to the signal line. Crosses between the two are often useful.
The buy/sell signals aren’t the main attraction of this indicator, and nothing to write home about. Like the big swing markers, I think it’s more realistic to view them as pointers to potentially interesting areas on charts. Their nature makes them more suited to identifying reversals. They certainly aren’t reliable enough to turn this study into a strategy and I normally don’t use them. The levels pre-defined for the buy/sell signals on CMFP are most useful on short intervals. The buy/sell signals on the slow MA pivots work on a more complete range of intervals. Optimization for your specific instruments and intervals will improve their reliability.
As usual when defining alerts, be sure you already have defined proper inputs and that you are on the intended interval, as they will be used when triggering alerts.
Wskaźnik przepływów pieniężnych Chaikina (CMF)

Accumulation/Distribution Percentage (ADP) [Cyrus c|:D]Accumulation/Distribution Percentage ( ADP ) is used to measure money flow similar to Chaikin Money Flow ( CMF ) and Money Flow. It is the range-bound version of my previous indicator ADMF. This indicator can be used for analyzing momentum, buy/sell pressure, and overbought/oversold conditions. I believe that this indicator is more accurate than CMF and MFI (I will publish a TA about it one day!).
What to look for:
- When this indicator moves up, it means buy pressure is increasing and the other way around for sell pressure. Crossing 0 means that trend has changed in the given period (it is best to look for confirmation of buy/sell pressure in larger TFs)
- Overbought above 40 and oversold below -40 (these numbers vary depending on the security. Look for historical levels to determine overbought and oversold conditions of each security)
- Regular divergence shows that momentum of a trend is declining. Hidden divergence implies continuation of a trend. The non-bound mode should be more accurate for identifying divergence.
- Failure swings can detect potential reversals.
Please read Relative Strength Index and Money Flow for more information and similar disclaimers.
Recommendations:
- hlc3 (AKA typical price) as input source might be better than "close" as it captures more information. If you use hlc3 as a source, then change the chart type to line and set hlc3 as the source for identifying divergence.
- Use hybrid tickers e.g.(BITFINEX:BTCUSD+COINBASE:BTCUSD+BITSTAMP:BTCUSD)/3. Volume-based indicators are susceptible to wash trading/volume printing and hybrid tickers mitigate this issue.
- In non-bound mode, small TFs with longer length should be more accurate than larger TFs with standard length (same is true for many other indicators)
Background:
I have developed 4 indicators based on a simple but elegant concept of A/D ratio. A/D ratio is equal to (current close - previous close)/True Range (when there are no price gaps, True Range = High - Low)
1) What you see on ADV indicator as darker green and red is equal to A/D ratio x volume.
2) ADL indicator shows the summation of ADV
3) ADMF (or ADP in non-bound mode) shows Moving Average of ADV
4) ADP shows relative accumulation strength which is calculated as RMA (accumulations)/RMA(accumulation + distribution). ADP equation is based on RSI equation which is RMA(gains)/RMA(gains + losses). That is why these two indicators look quite similar.
PS: Please leave a like if you find these indicators useful. I am working on improvements on these and other indicators. I am trying my best to keep them as simple as possible. Please let me know in the comments if you want me to make future indicators even simpler.
--------
Complementary indicators based on the same concept:
ADL: a replacement for Chaikin's Accum/Dist, On Balance Volume, and Price Volume Trend
ADV: a replacement for regular volume indicator
ADP also has a scaled RSI and ADMF built in (ie ADMF is obsolete).

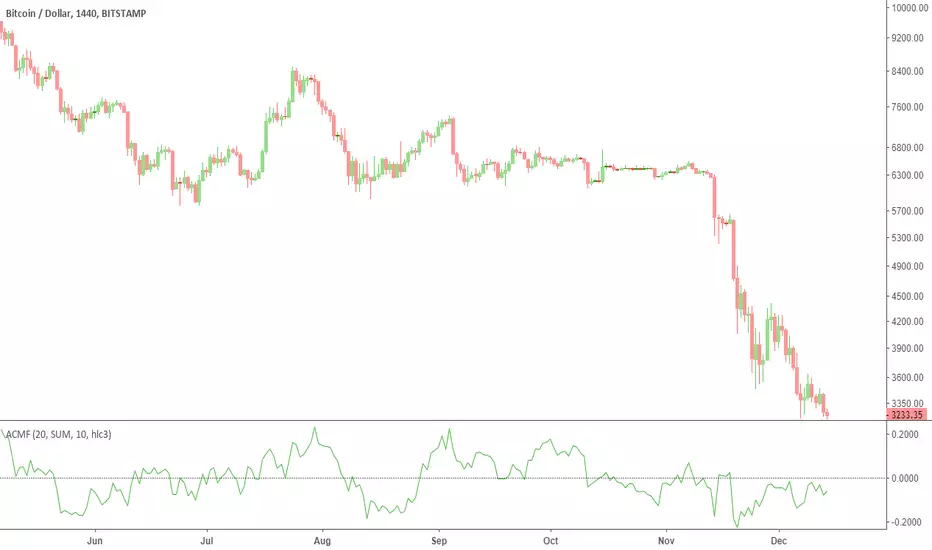
Accumulation/Distribution Money Flow [Cyrus c|:D]This indicator should be more accurate than other indicators in its class (including MFI, CMF, ADL, and OBV) for measuring buy/sell pressure, identifying trend change through divergence and calculating Accumulation/Distribution (A/D) level (I will explain why in a separate TA).
This indicator is based on my previous indicator "Accumulation/Distribution Volume". It does not include the volume bars. The volume effect is adjustable as well.
Application:
- Buy/sell pressure: above 0 shows buy pressure, below 0 shows sell pressure.
- Divergence: as shown in the chart above, this indicator diverged from BTC price during swing lows and highs in the shown period.
- Accumulation/distribution: set Aggregation=Sum, Volume Exponent=10 and uncheck Price Factor.
Recommendations:
- Never use SMA
- Use larger length EMA for confirmation of divergence or buy/sell pressure (EMA 27 is equal to RMA 14 which is used in RSI).
. A/D mode is not recommended for hidden divergence.
My Setup:
- I use one instances of this indicator with default settings for buy/sell pressure
- A second instance for A/D level overlaid on the main chart
- One instance of "Accumulation/Distribution Volume" as a replacement for volume indicator
This indicator can also replicate Accumulation/Distribution Line (improved by True Range), On Balance Volume, and Price Volume Trend. Read more details on the description of the previous indicator:
I strongly recommend reading about similar indicators for potential uses e.g. www.tradingview.com(MFI) and www.tradingview.com(PVT)
I will publish a TA about correctly measuring divergence and using these indicators.
Please report any problems you find in the comments.

Advanced Chaikin Money Flow (CMF)TL;DR: change the aggregation to EMA to achieve similar results to Twiggs Money Flow. Play with the rest of parameters to get the desired results.
This script allows customization of CMF. It also includes all the improvements made by Twiggs Money flow.
Regular CMF does not take price gaps into account as you can see in the chart below. True range fixes this issue, as done in Twiggs Money flow (TMF).
More info here: www.incrediblecharts.com
Customization Options:
- You can change the effect of volume by setting volume exponent. 0 to 10 reduces the effect and 10+ increases it. In exchanges with too much wash trading, you may want to reduce volume effect.
- You can factor in price in CMF. It gives you a slightly different results. See my Volume x price (VxP) indicator for why it might be useful.
- The range can be changed to percentage (similar to RSI)
PS: I do not recommend using CMF in today's Crypto markets. Chaikin uses the same multiplier in CMF and Accumulation/Distribution Line (ADL). ADL is a totally broken indicator for BTC. If you look at the period after ATH (chart below), you will notice that ADL keeps increasing implying accumulation. While it is clear that there was distribution going on. The reason might be the artificially inflated prices in Crypto that is achieved by the help of bots and having "certain" exchanges as a price reference. So, my reasoning is that if ADL is a broken indicator, so should be CMF. CMF diverges from BTC price frequently. This is a double edged sword IMO. Still CMF is a much better indicator than ADL because it works relative to prior periods which covers some of its flaws.
Note for super nerds: Twiggs Money Flow includes true range and Welles Wilder's Moving Average (WWMA). I have seen some other scripts using their own calculations for WWMA which is not efficient. WWMA is equal to built-in RMA/SMMA which is equal to EMA with length 2x-1.
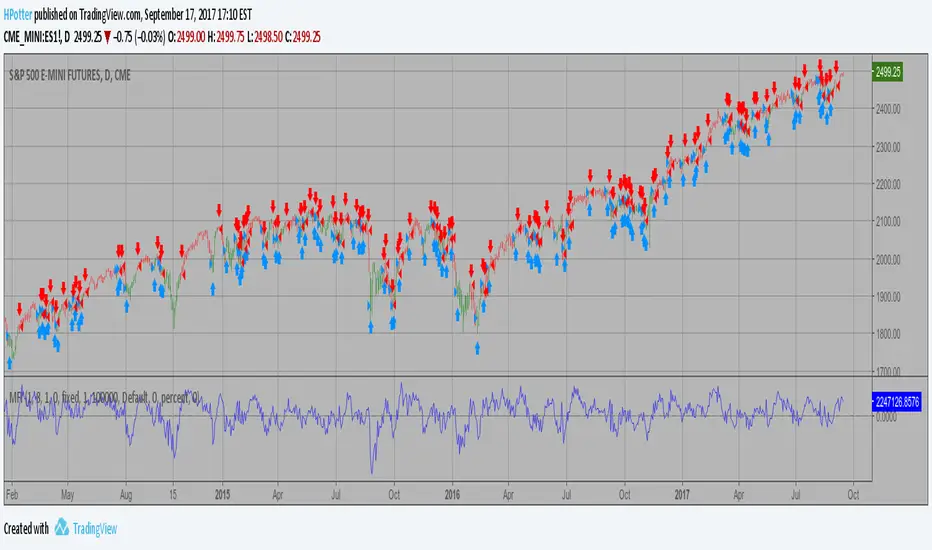
Money Flow Indicator (Chaikin Oscillator) Indicator plots Money Flow Indicator (Chaikin). This indicator looks
to improve on Larry William's Accumulation Distribution formula that
compared the closing price with the opening price. In the early 1970's,
opening prices for stocks stopped being transmitted by the exchanges.
This made it difficult to calculate Williams' formula. The Chaikin
Oscillator uses the average price of the bar calculated as follows
(High + Low) /2 instead of the Open.
The indicator subtracts a 10 period exponential moving average of the
AccumDist function from a 3 period exponential moving average of the
AccumDist function.
You can change long to short in the Input Settings
WARNING:
- For purpose educate only
- This script to change bars colors.
Money Flow Indicator (Chaikin Oscillator) Strategy Indicator plots Money Flow Indicator (Chaikin). This indicator looks
to improve on Larry William's Accumulation Distribution formula that
compared the closing price with the opening price. In the early 1970's,
opening prices for stocks stopped being transmitted by the exchanges.
This made it difficult to calculate Williams' formula. The Chaikin
Oscillator uses the average price of the bar calculated as follows
(High + Low) /2 instead of the Open.
The indicator subtracts a 10 period exponential moving average of the
AccumDist function from a 3 period exponential moving average of the
AccumDist function.
WARNING:
This script to change bars colors.

Klinger Volume Oscillator (KVO) Backtest The Klinger Oscillator (KO) was developed by Stephen J. Klinger. Learning
from prior research on volume by such well-known technicians as Joseph Granville,
Larry Williams, and Marc Chaikin, Mr. Klinger set out to develop a volume-based
indicator to help in both short- and long-term analysis.
The KO was developed with two seemingly opposite goals in mind: to be sensitive
enough to signal short-term tops and bottoms, yet accurate enough to reflect the
long-term flow of money into and out of a security.
The KO is based on the following tenets:
Price range (i.e. High - Low) is a measure of movement and volume is the force behind
the movement. The sum of High + Low + Close defines a trend. Accumulation occurs when
today's sum is greater than the previous day's. Conversely, distribution occurs when
today's sum is less than the previous day's. When the sums are equal, the existing trend
is maintained.
Volume produces continuous intra-day changes in price reflecting buying and selling pressure.
The KO quantifies the difference between the number of shares being accumulated and distributed
each day as "volume force". A strong, rising volume force should accompany an uptrend and then
gradually contract over time during the latter stages of the uptrend and the early stages of
the following downtrend. This should be followed by a rising volume force reflecting some
accumulation before a bottom develops.
You can change long to short in the Input Settings
Please, use it only for learning or paper trading.

Klinger Volume Oscillator (KVO) Strategy The Klinger Oscillator (KO) was developed by Stephen J. Klinger. Learning
from prior research on volume by such well-known technicians as Joseph Granville,
Larry Williams, and Marc Chaikin, Mr. Klinger set out to develop a volume-based
indicator to help in both short- and long-term analysis.
The KO was developed with two seemingly opposite goals in mind: to be sensitive
enough to signal short-term tops and bottoms, yet accurate enough to reflect the
long-term flow of money into and out of a security.
The KO is based on the following tenets:
Price range (i.e. High - Low) is a measure of movement and volume is the force behind
the movement. The sum of High + Low + Close defines a trend. Accumulation occurs when
today's sum is greater than the previous day's. Conversely, distribution occurs when
today's sum is less than the previous day's. When the sums are equal, the existing trend
is maintained.
Volume produces continuous intra-day changes in price reflecting buying and selling pressure.
The KO quantifies the difference between the number of shares being accumulated and distributed
each day as "volume force". A strong, rising volume force should accompany an uptrend and then
gradually contract over time during the latter stages of the uptrend and the early stages of
the following downtrend. This should be followed by a rising volume force reflecting some
accumulation before a bottom develops.
WARNING:
This script to change bars colors.

Twiggs-ss
The modified indicator money flow Chaikin -LasyBear. Drastically accumulation and a sharp distribution of the painted color
Indicators: Twiggs Money Flow [TMF] & Wilder's MA [WiMA]TMF is a CMF (Chaikin Money Flow) variation that addresses some of the gaps in the original indicator. More info: www.incrediblecharts.com
TMF uses true range, rather than daily Highs minus Lows. Also, uses Wilder's MA rather than SMA/EMA.
Since I had to write Wilder's MA (WiMA) for TMF, I have published that also as a separate indicator. WiMA is like EMA, but with a different "alpha" value.
How to include this in your charts?
-----------------------------------------------
- Click on "Share" button (top right on this chart). A dialog box opens up.
- Click on "Make it mine" button. This will create a copy of my published chart for you to edit.
- You can click on "{}" button next to the indicator name to get access to the source code.
- Save it to your CustomScripts library.
