TTC EMA Scalping Machine with RSI Filter and MACDTTC EMA Scalping Machine with RSI Filter and MACD
TTC EMA Scalping Machine with RSI Filter and MACD is a multi-layered technical analysis tool designed for traders looking to scalp the markets with a combination of trend-following and momentum-based indicators. This strategy leverages Exponential Moving Averages (EMAs) , Relative Strength Index (RSI) , MACD , and Volume Analysis to help traders identify high-probability entry points for short and long trades. The indicator can be used in multiple market conditions and is suited for both beginners and experienced traders looking for clear entry signals.
---
Key Features :
1. EMA-Based Trend Filtering :
- The indicator uses four Exponential Moving Averages (EMAs) with different periods:
- EMA 10 (Short-Term) : The fastest-moving average for detecting quick price movements.
- EMA 20 (Medium-Term) : A central trendline for market momentum.
- EMA 30 (Long-Term) : To observe broader market trends.
- EMA 50 (Longest-Term) : To identify the overall market direction.
- These EMAs are plotted on the chart and used to create EMA bands , visually displaying potential support and resistance levels. Price action inside these bands helps identify scalping opportunities.
2. RSI Filter :
- RSI (Relative Strength Index) is used to gauge overbought and oversold conditions in the market:
- Overbought condition (RSI > 70) : The market may be overextended, signaling the possibility of a short.
- Oversold condition (RSI < 30) : The market may be undervalued, signaling the possibility of a long.
- The RSI filter ensures that trades are not taken when the market is overextended, offering a more conservative approach to trade entries.
3. MACD Momentum Analysis :
- The MACD (Moving Average Convergence Divergence) indicator is included to confirm the trend and momentum direction:
- Long Condition : The MACD line crosses above the signal line, confirming a bullish momentum.
- Short Condition : The MACD line crosses below the signal line, confirming a bearish momentum.
- This serves as an additional filter to verify if the market momentum aligns with the long or short entry criteria.
4. Long Entry (Buy Signal) :
- A long entry signal is triggered when the following conditions are met:
- The price is above EMA 20 (indicating an overall bullish market).
- The price is within the green EMA band (EMA 10 and EMA 20), suggesting short-term support.
- The RSI is below 70 (indicating the market is not overbought).
- The MACD line is above the signal line , showing bullish momentum.
- These conditions combined suggest an ideal environment for entering a long position.
5. Short Entry (Sell Signal) :
- A short entry signal is triggered when the following conditions are met:
- The price is below EMA 20 (indicating an overall bearish market).
- The price is within the green EMA band (EMA 20 and EMA 30), suggesting short-term resistance.
- The RSI is above 30 (indicating the market is not oversold).
- The MACD line is below the signal line , showing bearish momentum.
- These conditions combined suggest an ideal environment for entering a short position.
6. Signal Alerts :
- Long Alerts : Users can set alerts to notify them when a long condition is met. These alerts are triggered when all the criteria for a long entry are satisfied.
- Short Alerts : Similarly, users can set alerts for short signals, notifying them when all the conditions for a short entry are satisfied.
7. EMA Bands :
- The EMA bands are visually represented with colored fills between the EMAs, providing a visual aid to recognize potential trading zones. These zones can serve as a reference for traders to make quick decisions regarding entries and exits.
8. Volume Filter :
- The indicator also includes a volume filter , which compares the current volume to its 20-period simple moving average. Higher volumes provide confirmation of price movement, which can indicate stronger potential for the trade.
---
How It Works :
- Long Trades : The indicator suggests a long position when the price is above the EMA 20, within the green EMA band, the RSI is not overbought, and MACD confirms bullish momentum (MACD line above the signal line).
- Short Trades : The indicator suggests a short position when the price is below the EMA 20, within the green EMA band, the RSI is not oversold, and MACD confirms bearish momentum (MACD line below the signal line).
- Volume Confirmation : The indicator uses a volume-based filter to ensure the trade is backed by sufficient market participation.
---
Usage :
- Best for Scalping : This strategy is designed for short-term trades ( scalping ) and can be applied to any time frame, though it works best on intraday charts, such as 5-minute or 15-minute charts.
- Ideal for Trend-Following : With the use of EMAs and MACD, the strategy is best suited for markets that exhibit clear trends. It helps to avoid whipsaw trades and focuses on capturing medium-term trends.
- Risk Management : By using RSI, MACD, and volume analysis together, this strategy reduces the likelihood of entering a trade in an overextended market, which helps with risk management.
---
Alerts and Signals :
- Long Signals : When all conditions are met for a long trade, a green label appears below the price bar, indicating a potential buy opportunity. An alert is also generated, notifying the user.
- Short Signals : When all conditions are met for a short trade, a red label appears above the price bar, indicating a potential sell opportunity. An alert is also generated, notifying the user.
---
This combination of EMA , RSI , MACD , and volume-based filters creates a balanced approach to scalping, ensuring that traders receive clear, actionable entry signals with trend confirmation, while avoiding overbought and oversold conditions that may lead to false signals. The indicator is designed to help traders confidently identify high-probability trades while maintaining simplicity and clarity in its setup.
Oscylatory skupione

TradFi Fundamentals: Momentum Trading with Macroeconomic DataIntroduction
This indicator combines traditional price momentum with key macroeconomic data. By retrieving GDP, inflation, unemployment, and interest rates using security calls, the script automatically adapts to the latest economic data. The goal is to blend technical analysis with fundamental insights to generate a more robust momentum signal.
Original Research Paper by Mohit Apte, B. Tech Scholar, Department of Computer Science and Engineering, COEP Technological University, Pune, India
Link to paper
Explanation
Price Momentum Calculation:
The indicator computes price momentum as the percentage change in price over a configurable lookback period (default is 50 days). This raw momentum is then normalized using a rolling simple moving average and standard deviation over a defined period (default 200 days) to ensure comparability with the economic indicators.
Fetching and Normalizing Economic Data:
Instead of manually inputting economic values, the script uses TradingView’s security function to retrieve:
GDP from ticker "GDP"
Inflation (CPI) from ticker "USCCPI"
Unemployment rate from ticker "UNRATE"
Interest rates from ticker "USINTR"
Each series is normalized over a configurable normalization period (default 200 days) by subtracting its moving average and dividing by its standard deviation. This standardization converts each economic indicator into a z-score for direct integration into the momentum score.
Combined Momentum Score:
The normalized price momentum and economic indicators are each multiplied by user-defined weights (default: 50% price momentum, 20% GDP, and 10% each for inflation, unemployment, and interest rates). The weighted components are then summed to form a comprehensive momentum score. A horizontal zero line is plotted for reference.
Trading Signals:
Buy signals are generated when the combined momentum score crosses above zero, and sell signals occur when it crosses below zero. Visual markers are added to the chart to assist with trade timing, and alert conditions are provided for automated notifications.
Settings
Price Momentum Lookback: Defines the period (in days) used to compute the raw price momentum.
Normalization Period for Price Momentum: Sets the window over which the price momentum is normalized.
Normalization Period for Economic Data: Sets the window over which each macroeconomic series is normalized.
Weights: Adjust the influence of each component (price momentum, GDP, inflation, unemployment, and interest rate) on the overall momentum score.
Conclusion
This implementation leverages TradingView’s economic data feeds to integrate real-time macroeconomic data into a momentum trading strategy. By normalizing and weighting both technical and economic inputs, the indicator offers traders a more holistic view of market conditions. The enhanced momentum signal provides additional context to traditional momentum analysis, potentially leading to more informed trading decisions and improved risk management.
The next script I release will be an improved version of this that I have added my own flavor to, improving the signals.

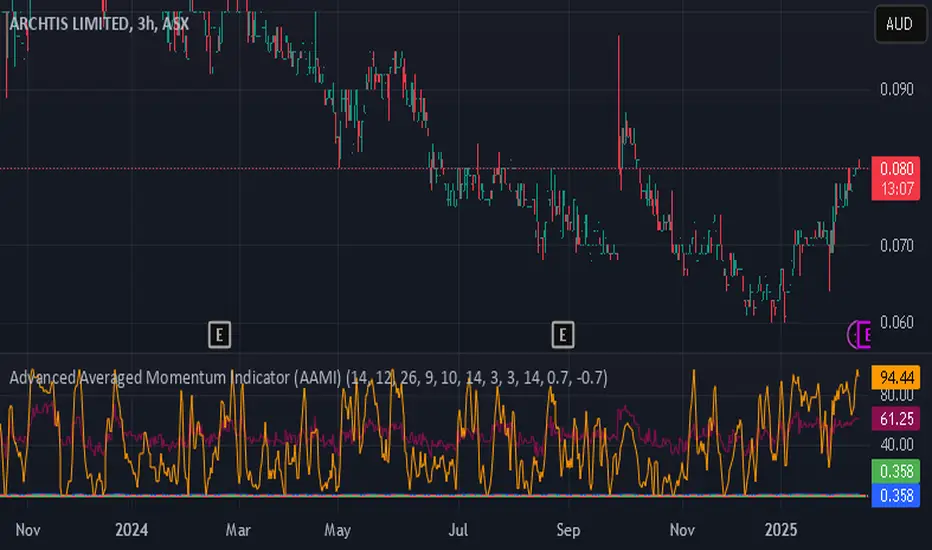
Advanced Averaged Momentum Indicator (AAMI)Key Features of AAMI:
Combination of Momentum Indicators: It averages normalized values from RSI, MACD histogram, raw Momentum, and Stochastic oscillator to give a comprehensive view of momentum.
Normalization: Each component is normalized to a scale from -1 to 1 to ensure they contribute equally to the AMI calculation.
Visual Cues: The indicator includes visual levels for neutral, overbought, and oversold conditions to aid in quick decision-making.
Alerts: Basic alert conditions are included for when AMI moves into overbought or oversold territory, which traders can customize further.
Customizable: All parameters can be adjusted within TradingView to tailor the indicator to different market conditions or trading strategies.
Smoothing: Included an SMA for AMI to reduce noise and give smoother signals.
Divergence Detection: Implemented a basic divergence detection mechanism to spot potential reversals.
Usage Tips:
Overbought/Oversold: When AMI goes above 0.7, it might suggest an overbought condition, potentially signaling a sell or take profit. Below -0.7 might indicate oversold conditions, suggesting a buy opportunity.
Divergence: Watch for divergences between the AMI and price action for signals of potential trend reversals.
Crossing Zero: The AMI crossing from negative to positive might be used as a buy signal, and vice versa for a sell signal.
This script provides a new way to view momentum by consolidating multiple traditional indicators into one, potentially offering clearer signals in complex market environments.
Multi-Indicator Signals with Selectable Options by DiGetMulti-Indicator Signals with Selectable Options
Script Overview
This Pine Script is a multi-indicator trading strategy designed to generate buy/sell signals based on combinations of popular technical indicators: RSI (Relative Strength Index) , CCI (Commodity Channel Index) , and Stochastic Oscillator . The script allows you to select which combination of signals to display, making it highly customizable and adaptable to different trading styles.
The primary goal of this script is to provide clear and actionable entry/exit points by visualizing buy/sell signals with arrows , labels , and vertical lines directly on the chart. It also includes input validation, dynamic signal plotting, and clutter-free line management to ensure a clean and professional user experience.
Key Features
1. Customizable Signal Types
You can choose from five signal types:
RSI & CCI : Combines RSI and CCI signals for confirmation.
RSI & Stochastic : Combines RSI and Stochastic signals.
CCI & Stochastic : Combines CCI and Stochastic signals.
RSI & CCI & Stochastic : Requires all three indicators to align for a signal.
All Signals : Displays individual signals from each indicator separately.
This flexibility allows you to test and use the combination that works best for your trading strategy.
2. Clear Buy/Sell Indicators
Arrows : Buy signals are marked with upward arrows (green/lime/yellow) below the candles, while sell signals are marked with downward arrows (red/fuchsia/gray) above the candles.
Labels : Each signal is accompanied by a label ("BUY" or "SELL") near the arrow for clarity.
Vertical Lines : A vertical line is drawn at the exact bar where the signal occurs, extending from the low to the high of the candle. This ensures you can pinpoint the exact entry point without ambiguity.
3. Dynamic Overbought/Oversold Levels
You can customize the overbought and oversold levels for each indicator:
RSI: Default values are 70 (overbought) and 30 (oversold).
CCI: Default values are +100 (overbought) and -100 (oversold).
Stochastic: Default values are 80 (overbought) and 20 (oversold).
These levels can be adjusted to suit your trading preferences or market conditions.
4. Input Validation
The script includes built-in validation to ensure that oversold levels are always lower than overbought levels for each indicator. If the inputs are invalid, an error message will appear, preventing incorrect configurations.
5. Clean Chart Design
To avoid clutter, the script dynamically manages vertical lines:
Only the most recent 50 buy/sell lines are displayed. Older lines are automatically deleted to keep the chart clean.
Labels and arrows are placed strategically to avoid overlapping with candles.
6. ATR-Based Offset
The vertical lines and labels are offset using the Average True Range (ATR) to ensure they don’t overlap with the price action. This makes the signals easier to see, especially during volatile market conditions.
7. Scalable and Professional
The script uses arrays to manage multiple vertical lines, ensuring scalability and performance even when many signals are generated.
It adheres to Pine Script v6 standards, ensuring compatibility and reliability.
How It Works
Indicator Calculations :
The script calculates the values of RSI, CCI, and Stochastic Oscillator based on user-defined lengths and smoothing parameters.
It then checks for crossover/crossunder conditions relative to the overbought/oversold levels to generate individual signals.
Combined Signals :
Depending on the selected signal type, the script combines the individual signals logically:
For example, a "RSI & CCI" buy signal requires both RSI and CCI to cross into their respective oversold zones simultaneously.
Signal Plotting :
When a signal is generated, the script:
Plots an arrow (upward for buy, downward for sell) at the corresponding bar.
Adds a label ("BUY" or "SELL") near the arrow for clarity.
Draws a vertical line extending from the low to the high of the candle to mark the exact entry point.
Line Management :
To prevent clutter, the script stores up to 50 vertical lines in arrays (buy_lines and sell_lines). Older lines are automatically deleted when the limit is exceeded.
Why Use This Script?
Versatility : Whether you're a scalper, swing trader, or long-term investor, this script can be tailored to your needs by selecting the appropriate signal type and adjusting the indicator parameters.
Clarity : The combination of arrows, labels, and vertical lines ensures that signals are easy to spot and interpret, even in fast-moving markets.
Customization : With adjustable overbought/oversold levels and multiple signal options, you can fine-tune the script to match your trading strategy.
Professional Design : The script avoids clutter by limiting the number of lines displayed and using ATR-based offsets for better visibility.
How to Use This Script
Add the Script to Your Chart :
Copy and paste the script into the Pine Editor in TradingView.
Save and add it to your chart.
Select Signal Type :
Use the "Signal Type" dropdown menu to choose the combination of indicators you want to use.
Adjust Parameters :
Customize the lengths of RSI, CCI, and Stochastic, as well as their overbought/oversold levels, to match your trading preferences.
Interpret Signals :
Look for green arrows and "BUY" labels for buy signals, and red arrows and "SELL" labels for sell signals.
Vertical lines will help you identify the exact bar where the signal occurred.
Tips for Traders
Backtest Thoroughly : Before using this script in live trading, backtest it on historical data to ensure it aligns with your strategy.
Combine with Other Tools : While this script provides reliable signals, consider combining it with other tools like support/resistance levels or volume analysis for additional confirmation.
Avoid Overloading the Chart : If you notice too many signals, try tightening the overbought/oversold levels or switching to a combined signal type (e.g., "RSI & CCI & Stochastic") for fewer but higher-confidence signals.

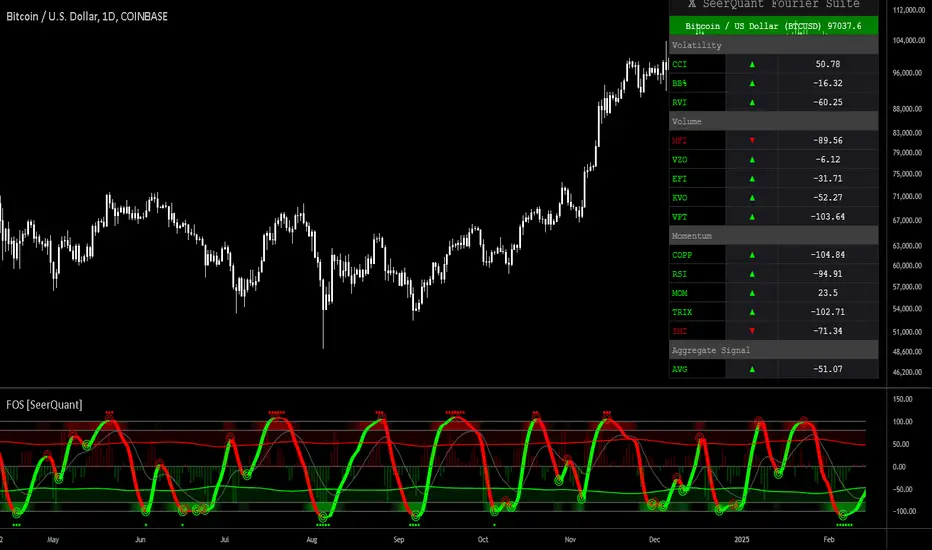
Fourier Oscillator Suite [SeerQuant]| Fourier Oscillator Suite |
WHY THE FOURIER TRANSFORM?
The Discrete Fourier Transform (DFT) extracts dominant cyclical patterns from market price data. Fourier analysis allows for the decomposition of price movements into frequency components, distinguishing trend-driven behaviour from noise and identifying oscillatory cycles within the market. This approach is effective in detecting dominant cycles in data, filtering out random fluctuations, and providing insights into price behaviour beyond conventional indicators.
This indicator applies a Fourier transform to the selected price source, converting it into a frequency-based signal. Instead of directly working with raw price data, the transformed signal acts as a smoothed and cycle-adjusted input for multiple technical indicators, enhancing their ability to adapt to market conditions dynamically.
Once the Fourier transform is applied, the extracted signal is processed through a suite of technical indicators, which are then normalized and aggregated into a single, actionable metric.
FEATURES AND BENEFITS
✅ Multi-Factor Aggregation:
By blending volatility, momentum, and volume-based oscillators, this indicator provides a comprehensive view of market conditions.
✅ Enhanced Signal Clarity:
Fourier transformation filters noise, revealing more reliable trading signals.
✅ Adaptive Market Sensitivity:
Unlike static oscillators, the Fourier-enhanced input dynamically adjusts to price shifts.
INDICATOR COMPONENTS
The Fourier Oscillator Suite aggregates the output of the transformed signal into three primary market components:
1. Volatility-Based Metrics
Commodity Channel Index (CCI) – Measures price deviation from a moving average.
Bollinger Band %B (BB%) – Evaluates price positioning within the Bollinger Bands.
Relative Volatility Index (RVI) – Identifies periods of heightened or subdued volatility.
2. Momentum Indicators
Relative Strength Index (RSI) – Gauges trend momentum and overbought/oversold levels.
Coppock Curve – A long-term momentum oscillator, often used for detecting major trend shifts.
Momentum (MOM), TRIX, and Stochastic Momentum Index (SMI) – Further refine momentum analysis.
3. Volume-Based Oscillators
Money Flow Index (MFI) – Measures price strength relative to volume.
Volume Zone Oscillator (VZO) – Detects accumulation and distribution phases.
Elder's Force Index (EFI) & Klinger Volume Oscillator (KVO) – Assess money flow strength.
These individual metrics are first normalized within a defined period and then smoothed using the selected moving average type. The final composite signal is derived from a weighted combination of the volatility, momentum, and volume components, each of which can be customized by the user.
SETTINGS
The indicator includes an extensive set of options for users to tailor its performance:
📌 Fourier Transform Parameters
Source Selection – Choose which price input (e.g., HLC3) is used for Fourier analysis.
Fourier Period – Defines the number of cycles analyzed for signal extraction.
📌 Aggregation Settings
Normalization Period – Controls how indicator values are scaled.
Smoothing Length – Adjusts the sensitivity of moving averages applied to oscillators.
Weight Adjustments – Fine-tune the impact of volatility, momentum, and volume-based inputs on the final signal.
📌 White Noise Control
White Noise Amplitude & Period – Filters out excessive market noise to improve signal clarity.
Enable/Disable White Noise Overlay – Provides optional visualization of filtered noise levels.
📌 Custom Styling & Visual Enhancements
Selectable Color Schemes – Choose from Default, Modern, Cool, or Monochrome.
Bull & Bear Color Customization – Define custom colors for positive/negative momentum shifts.
Adaptive Gradient Fills – Highlights market conditions dynamically based on oscillator movements.
The Fourier Oscillator Suite is designed for advanced traders seeking a noise-reduced, multi-dimensional view of market dynamics. By incorporating Fourier-transformed signals into a broad range of oscillators, this tool offers a highly adaptive, filter-enhanced, and customizable approach to momentum and trend analysis. Whether you are a trend follower, mean reversion trader, or volume analyst, this suite provides actionable insights with enhanced clarity.
MACD+ Divergences [CryptoSmart] By IgnotusIndicator Description: MACD+ Divergence
---
Overview
The MACD+ Divergence is an enhanced version of the classic MACD (Moving Average Convergence Divergence) indicator, meticulously crafted by CryptoSmart. This proprietary tool integrates advanced divergence detection, Top Dog Trading MOM (Momentum) and DAD (Direction as Decision) variations, and unique background shading to provide traders with a comprehensive view of market momentum, trend direction, and potential reversals.
This indicator is not just a standard MACD; it incorporates a unique configuration aligned with a proprietary trading strategy developed by CryptoSmart. Its settings and code are restricted to preserve the integrity and effectiveness of the strategy. Traders can leverage this powerful tool to identify high-probability trade setups without constantly monitoring the charts.
---
Key Features
- Proprietary MACD Calculation:
- MACD line calculated using user-defined fast, slow, and signal lengths.
- Supports both Exponential Moving Averages (EMA) and Simple Moving Averages (SMA).
- Includes optimized settings for Top Dog Trading MOM and DAD variations for structured momentum and directional analysis.
- Dynamic Coloring:
- MACD histogram changes color dynamically based on its direction and position relative to the zero line:
- Green/Lime: Increasing momentum above the zero line.
- Red/Maroon: Decreasing momentum below the zero line.
- MACD line and signal line adapt their colors to reflect directional trends.
- Background Shading:
- Background color highlights key conditions:
- Lime: Bullish momentum or upward DAD direction.
- Red: Bearish momentum or downward DAD direction.
- Provides an intuitive visual cue for market sentiment.
- Advanced Divergence Detection:
- Identifies regular and hidden divergences in:
- MACD Histogram.
- MACD Line.
- MOM (Momentum).
- DAD (Direction as Decision).
- Regular divergences indicate potential trend reversals, while hidden divergences suggest trend continuation.
- Divergences are plotted as lines and labeled with clear markers (`R` for regular and `H` for hidden).
- Customizable Inputs:
- Enable or disable specific features, such as:
- Displaying regular or hidden divergences.
- Showing divergence labels.
- Using Top Dog Trading MOM and DAD variations.
- Adjustable offset for divergence markers ensures realistic entry points.
- Comprehensive Alert System:
- Alerts notify traders of key events, including:
- MACD line crossing the signal line.
- Divergence formations (regular and hidden).
- Changes in DAD direction (upward or downward).
- Alerts ensure traders don’t miss critical trading opportunities.
- Unique Configuration:
- Built with a proprietary configuration integrating a proven trading strategy.
- Parameters and logic are fine-tuned to deliver precise signals.
- Restricted code ensures alignment with the proprietary strategy.
- Aesthetic Enhancements:
- Clean and professional design with customizable colors and line styles.
- Optional histogram outlines for better visibility.
---
How It Works
1. MACD Calculation:
- MACD line = Difference between fast and slow moving averages.
- Signal line = Smoothed version of the MACD line.
- Histogram = Difference between the MACD line and signal line.
2. Divergence Logic:
- Fractals identify local highs and lows in the MACD histogram, MACD line, MOM, and DAD.
- Regular divergences occur when price makes a higher high/lower low, but the MACD indicator does not confirm the move.
- Hidden divergences occur when price makes a lower high/higher low, but the MACD indicator confirms the trend continuation.
3. Background Shading:
- Background color changes based on the direction of the MACD histogram or DAD line, providing a quick visual reference for market bias.
4. Alerts:
- Alerts trigger when specific conditions are met, such as divergences forming or the MACD line crossing the signal line.
---
Inputs
- Standard MACD Settings:
- Fast Length: Default = 12
- Slow Length: Default = 26
- Signal Smoothing: Default = 9
- Top Dog Trading Settings:
- Fast Length: Default = 5
- Slow Length: Default = 20
- Signal Smoothing: Default = 30
- Visualization Options:
- Enable/Disable Top Dog Trading MOM and DAD.
- Show regular or hidden divergences.
- Display divergence labels.
- Background shading for momentum/direction.
- Offset Adjustment:
- Adjust divergence markers to align with realistic entry points.
---
Usage
- Trend Reversals:
- Use regular divergences to identify potential trend reversals.
- Trend Continuation:
- Use hidden divergences to confirm ongoing trends.
- Entry/Exit Points:
- Combine divergence signals with MACD crossovers for precise entry and exit points.
- Market Sentiment:
- Monitor background shading to gauge overall market bias.
---
Tips for Traders
Combine with Other Indicators:
- Use this indicator alongside support/resistance levels, candlestick patterns, or volume analysis for confirmation.
Adjust Parameters:
- Experiment with different fast, slow, and signal lengths to suit your trading style and timeframe.
Focus on Divergences:
- Pay close attention to divergence signals, as they often precede significant price movements.
Use Alerts:
- Enable alerts to stay informed about key events without constantly monitoring the chart.
---
Why Choose MACD+ Divergence ?
This indicator stands out due to its unique integration of a proprietary trading strategy, ensuring reliable and actionable signals. The inclusion of Top Dog Trading MOM and DAD variations adds precision, while the advanced divergence detection and alert system make it an indispensable tool for traders seeking an edge in the markets.
---
Restrictions
To maintain the integrity and effectiveness of the MACD+ Divergence , its configuration and code are restricted. This ensures alignment with the proprietary strategy developed by CryptoSmart, delivering consistent and accurate results.
---
Conclusion
The **MACD+ Divergence ** is a cutting-edge tool that combines traditional MACD analysis with advanced divergence detection and proprietary enhancements. Its unique configuration and restricted code ensure it remains a powerful and reliable resource for traders. Whether you’re looking for trend reversals, continuations, or overall market sentiment, this indicator provides the insights needed to make informed trading decisions.
---
Disclaimer
This indicator is for educational and informational purposes only. Trading involves risk, and past performance is not indicative of future results. Always conduct your own research and consult with a financial advisor before making trading decisions.

Moneyball EMA-MACD indicator [VinnieTheFish]Summary of the Moneyball EMA-MACD Indicator Script
Author: VinnieTheFish
Purpose:
This indicator helps traders identify trend direction, momentum shifts, and potential trade signals based on EMA and MACD crossovers.
This Pine Script is a custom indicator that combines Exponential Moving Averages (EMAs) and MACD (Moving Average Convergence Divergence) to analyze price trends and momentum. The script uses a custom 9/50 MACD with a 16 smoothing period. The script is written in a way that you can create your own custom MACD settings and create alerts based on those parameters. The chart bars are color coded based on the relative position of the MACD and Signal line primarily for bullish long trade setups.
Bar color coding helps the trader spot potential reversals based on where the price currently resides in relation to the custom 9/50 EMA based MACD and the 16 period smoothing period for the signal line. Indicator also has custom alerts to notify the trader when a potential trade setup exists that correspond with the bar color change.
Question: So why is this called the Moneywell EMA-MACD Indicator?
Answer: In the movie Moneyball the Oakland A's broke down how to win a championship based on data. To make the playoffs you needed so many wins, then broken down by runs and then broken down to base hits. A base hit was good as a walk. With trading often times we look too often for home runs and ignore the importance of getting on base with small wins. This indicator was designed on shorter timeframes to identify those base hits, but can also be adapted to higher timeframes for swing trading.
Key Features:
User Inputs:
Configurable fast and slow lengths for MACD calculation.
Choice between SMA and EMA for oscillator and signal line smoothing.
Customizable signal smoothing length.
EMA Calculation:
Computes 3 EMA, 9 EMA, 20 EMA, and 50 EMA to track short-term and long-term trends.
MACD Calculation:
Computes MACD using either SMA or EMA based on user selection.
Generates the MACD signal line for comparison.
Crossover Conditions:
Detects MACD and Signal line crossovers above and below the zero line.
Identifies price momentum shifts.
Bar Coloring Logic:
Green: MACD is above 0 and above the signal line.
White: MACD is below the signal line.
Orange: MACD is below 0 but above the signal line.
Fuchsia: Bullish EMA 3/9 cross but price is still below the 20/50 EMA.
Alerts for Key Trading Signals:
MACD crossing above/below the zero line.
Signal line crossing above/below the zero line.
MACD reaching new highs/lows.
Alerts for colored bar conditions.

US10Y Yield Range Percentile | JeffreyTimmermansUS10Y Yield Range Percentile
The "US10Y Yield Range Percentile" Indicator provides insights into the relative positioning of the U.S. 10-Year Treasury Yield (US10Y) within a specified lookback period. It highlights key valuation style conditions, helping traders assess market sentiment based on yield movements.
Why is the US 10-Year Treasury Yield Important?
The U.S. 10-Year Treasury Yield (US10Y) is one of the most critical benchmarks in global finance. It reflects the cost of borrowing for the U.S. government and serves as a risk-free rate that influences interest rates across the economy.
Macroeconomic Indicator:
Rising yields suggest strong economic growth or inflationary pressures, often leading to tighter monetary policy.
Falling yields indicate economic slowdown, deflationary risks, or increased demand for safe-haven assets.
Impact on Financial Markets:
Stock Market: Higher yields reduce the attractiveness of equities, while lower yields support risk assets.
Credit Markets: A rising 10-year yield increases borrowing costs, impacting corporate debt and mortgage rates.
Global Capital Flows: US10Y is a key driver of capital allocation worldwide, affecting currency valuations and capital flows into emerging markets.
Correlation with Risk Assets (Especially Crypto):
Crypto markets, particularly Bitcoin and Ethereum, have shown a strong inverse correlation with US10Y yields.
When yields rise, risk assets tend to sell off due to tighter financial conditions.
When yields decline, liquidity flows into speculative assets, boosting stocks, crypto, and growth sectors.
Key Functions of the Indicator
Range Calculation:
Computes the highest high and lowest low over a user-defined period (default: 63 days).
Measures the current yield’s position within this range.
Range Percentile Calculation:
Determines the percentile rank of the current yield within its range.
A higher percentile indicates higher yields, often associated with Risk OFF conditions.
A lower percentile suggests lower yields, signaling Risk ON sentiment.
Optional Smoothing:
Enable/Disable: Users can enable Simple Moving Average (SMA) smoothing to reduce noise.
Default smoothing length : 10 periods (can be customized).
Threshold Levels & Background Coloring:
The background color represents the current market regime (valuation based), based on the US10Y yield percentile:
Risk ON (Bullish): When the percentile falls below the lower threshold (default: 20).
Neutrally Positive Zone (also Risk ON): Between 20 and 80 percentile.
Risk OFF (Bearish): When the percentile rises above the upper threshold (default: 80).
Important : Background Coloring is NOT a Leading Signal.
The background color provides a visual representation of valuation periods, but it is not a leading indicator for price movements. Instead, traders should focus on the orange US10Y Range Percentile line, which is the key signal within this indicator. The colors behind the line below the chart are leading. The background colors behind the price chart are more of a valuation style indications.
When the orange line enters the Danger Zone (above 80 percentile), it signals that yields are elevated, and risk assets (such as stocks and crypto) are at increased risk of reversing downward.
While the background coloring helps to visualize market conditions, price reversals tend to occur when the percentile line is in extreme zones rather than when the background color changes.
Traders should monitor the percentile line closely, as it provides a clearer signal of potential shifts in market sentiment.
Visual Elements
Range Percentile Plot:
Displays the smoothed or raw percentile value over time.
Helps identify shifts in yield positioning.
Threshold Markers & Fill Zones:
Key percentile thresholds (0, 20, 80, 100) are marked with horizontal lines.
The area between 20-80 percentile is filled to indicate the neutral zone.
Extreme zones are highlighted to emphasize significant shifts in risk sentiment.
Dynamic Labeling:
A real-time percentile label appears next to the latest data point.
Alerts & Notifications
Risk OFF to Risk ON Transition:
Alert triggers when the percentile falls below the lower threshold (yields decreasing).
Risk ON to Risk OFF Transition:
Alert triggers when the percentile rises above the upper threshold (yields increasing).
Conclusion
The crypto market is highly sensitive to macroeconomic conditions, with Bitcoin often behaving like a high-beta tech stock.
A declining US10Y yield signals looser financial conditions, increasing demand for risk assets like crypto.
A rising US10Y yield tightens liquidity, leading to sell-offs in Bitcoin, Ethereum, and altcoins.
Tracking the US10Y percentile position helps traders anticipate market shifts before they occur.
This indicator serves as a leading signal for understanding market risk appetite by tracking Treasury yield movements. A decline in yields typically favors equities and risk assets, while rising yields indicate a shift toward safety and risk aversion.
Credits
This indicator was inspired by and builds upon the work of TomasOnMarkets . While incorporating significant enhancements, it acknowledges the foundational concepts provided by this original source. Thank you for sharing your input on this important indicator. We are honored to use it and to further improve upon it.
-Jeffrey

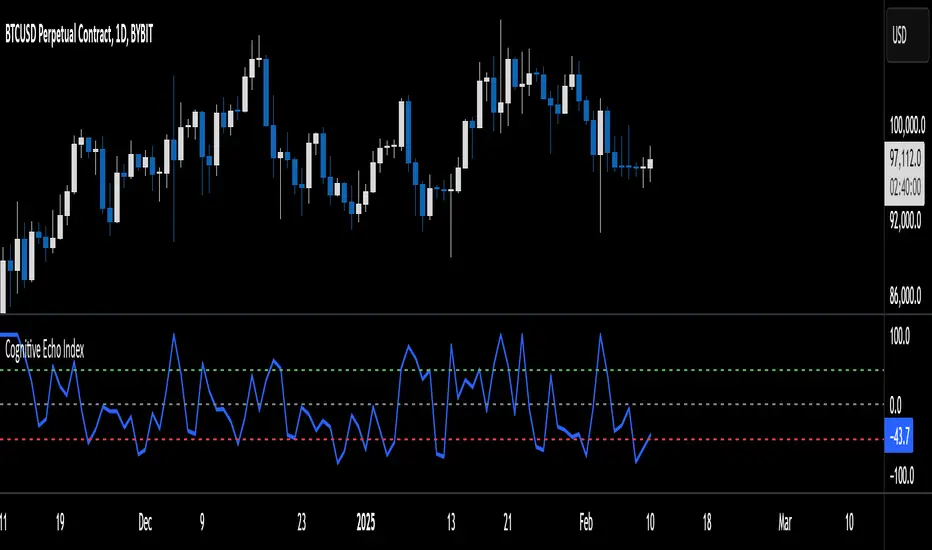
Cognitive Echo IndexCognitive Echo Index – User Guide
Overview
The Cognitive Echo Index is a composite indicator that combines several technical aspects—including price deviation from a moving average, normalized volatility (via ATR), and volume variations—to create a single numeric value. The output is scaled between -100 and +100, offering insights into market momentum and potential trend reversals.
How It Works
Price Component:
The indicator calculates the percentage change between the current price and its 14-period simple moving average (SMA). This helps identify how far the price deviates from its recent trend.
Volatility Component:
Using the Average True Range (ATR) over a 14-period, the script normalizes current ATR against its 14-period SMA. This shows relative volatility, highlighting unusual market activity.
Volume Component:
It computes the percentage change between the current volume and its 14-period SMA to detect spikes or drops in trading activity.
Composite Calculation:
The three components are summed together to produce the final index value, which is then clipped to remain between -100 and +100.
Interpreting the Indicator
Indicator Value Scale:
Positive Values (0 to +100):
Suggest that bullish forces are stronger. Higher values (e.g., above +50) could indicate a strong bullish sentiment.
Negative Values (0 to -100):
Indicate bearish pressures. Lower values (e.g., below -50) may signal strong bearish conditions.
Zero Level:
The midline indicates a balanced market condition with no dominant trend.
Key Horizontal Levels:
+50 Level:
When the indicator crosses above +50, it can be interpreted as a strong bullish signal.
-50 Level:
When the indicator crosses below -50, it can be considered a strong bearish signal.
Usage Tips
Confirmation Tool:
Use the Cognitive Echo Index as an additional confirmation tool in conjunction with other technical indicators or chart patterns to make more informed trading decisions.
Parameter Adjustments:
The script uses a 14-period setting for the moving average, ATR, and volume SMA by default. Depending on your trading timeframe or asset, consider tweaking these periods for better sensitivity.
Trend Analysis:
Watch how the indicator behaves during major price moves. A divergence between the index and the price trend (e.g., price rises while the index falls) may suggest a potential reversal or a false breakout.
Risk Management:
Always incorporate sound risk management practices. Use stop losses and position sizing rules, and consider the indicator as one part of your overall trading strategy.
Customization
Adjusting the Weights:
Although the current version gives equal weight to all three components, advanced users can modify the script to apply different weights to the price, volatility, and volume components based on historical performance or specific market conditions.
Adding Additional Inputs:
Future versions could incorporate external sentiment data or other technical factors if accessible. For now, the indicator focuses on technical inputs available directly within TradingView.
By following this guide, traders can integrate the Cognitive Echo Index into their TradingView platform to gain a unique perspective on market momentum and potential turning points. Enjoy testing and refining the indicator to better suit your trading style!
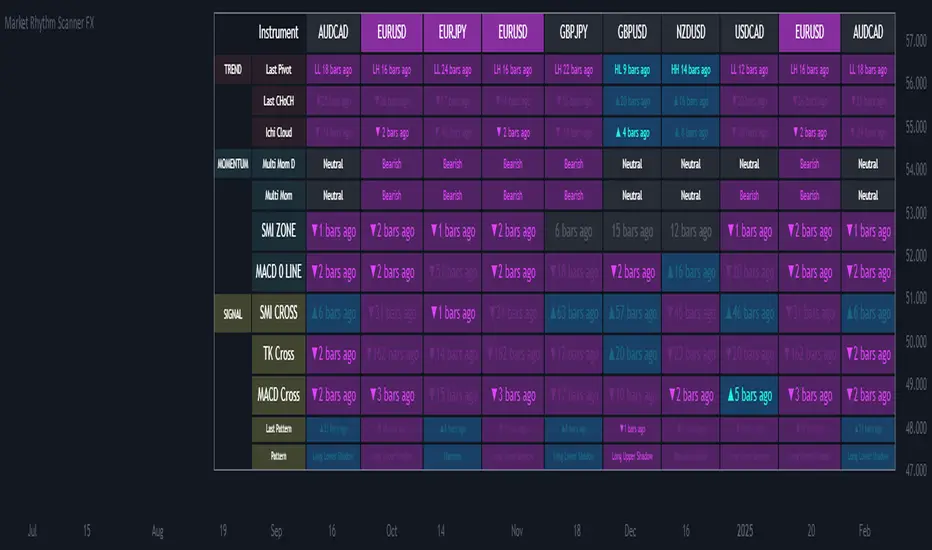
Ultimate Market Rhythm Scanner FXReady to feel like a chart-wielding wizard? The Ultimate Market Rhythm Scanner FX is here to supercharge your Forex analysis by piping in multi-timeframe goodness from up to 10 OANDA currency pairs. You’ll see structure breakouts, Ichimoku signals, MACD pulses, RSI/Bollinger momentum waves, and candlestick patterns—all at once.
Think of it as your own personal mission control dashboard, scanning the FX galaxy and beaming back color-coded signals so you know instantly where the market action is hottest. Remember, to keep the data aligned, you’ll want to load this indicator on an OANDA FX pair chart (like OANDA:EURUSD) so everything lines up perfectly behind the scenes.
Key Features
Market Structure Wizardry
Locates pivot highs and lows (Higher High, Lower Low, etc.)
Spots breakouts above/below these pivots
Shouts out “CHoCH” (Change of Character) when structure flips from bullish to bearish (or vice versa)
If you want to understnd more about the market structure logic in this script check out my other script, it uses the same logic:
Tracks price above/below the Ichimoku Cloud
Flags Tenkan/Kijun crosses for bullish or bearish setups
MACD & SMI Insights
MACD line vs. Signal Cross & crossing the Zero line
SMI crosses in overbought/oversold “zones” (because pure oscillator mania is cool)
Momentum Radar
Mashes up RSI + Bollinger + Ichimoku for either “Bullish,” “Bearish,” or “Neutral”
Also checks a separate Daily timeframe for cosmic perspective
Candlestick Pattern Goodness
Detects common candle formations (Hammer, Hanging Man, Marubozu, etc.)
Tells you exactly how many bars ago they flashed their signals
Time Fade Magic
Recent signals shine bright
Older signals fade out like invisible ninjas after a user-defined number of bars
Explanation of Settings
Below lies the control panel for your new chart-snooping sidekick:
Symbol Settings (Symbol 1...Symbol 10)
Select multiple FX OANDA pairs (like OANDA:AUDUSD).
Each pair spawns a new column in the scanner table.
Ensure your chart is also set to an OANDA pair—the script only speaks “OANDA.”
Ichimoku Settings
Use Ichimoku Filter: Toggles everything Ichimoku.
conversionPeriods, basePeriods, laggingSpan2Periods, displacement: The classic Ichimoku parameters to mold your cloud magic.
Pivot Logic
Pivot Source: Wicks vs. Closes for pivot detection.
BOS Confirmation: If you prefer breakouts confirmed by wicks or closes.
Left Swing Length: Bars left for pivots.
Right Swing Length High / Low: Bars right for pivot confirmation.
Invert Right Swing in Bearish Trend: Auto-flip logic when gloom takes over. This means right swing size high value will become right swing size low value in a bearish trend (determined by latest CHoCH).
RSI & Bollinger
RSI Period: The heartbeat of RSI.
RSI Overbought / Oversold: Thresholds for RSI mania.
BB Length / StdDev: The Bollinger band radius for measuring price expansions.
MACD
fastLength, slowLength, signalLength: The trifecta that shapes your MACD wave.
SMI Settings
Nested variables for SMI’s K, D, and EMA lengths.
Overbought and Oversold levels for zone detection.
Time Display Settings
Fade out old signals: Turn the fade effect on/off.
Fade After X Bars: The number of bars after which signals do a ghost trick.
Fade Transparency: How ghostly (0–100) those old signals become.
Table Settings
Show Table: Summon or banish the entire scanner table.
Table Position: Choose the quadrant for your new data-loving sidekick.
Table Text Size: Big or small text for those crucial signals.
Table Layout
With “Show Table” on, a futuristic readout appears, listing:
Columns: Each symbol’s name runs across the top (up to 10).
Rows: A row for each technical aspect, such as:
Last Pivot (pivot) – The most recent pivot type (HH, HL, LH, LL) and how many bars ago.
Last CHoCH – Crows “▲/▼ X bars ago” if structure reversed.
Ichi Cloud (ichi) – Tells you if price soared above or dived below the Cloud.
Multi Mom D (momentum_d) – A daily momentum label (Bullish/Bearish/Neutral). It shows you daily momentum even on times frames lower than the daily. Multi Mom D is not reliable if the chart is on a time frame higher than the daily.
Multi Mom (momentum) – Current timeframe momentum label.
SMI ZONE (smizone) – If SMI’s in a bullish or bearish zone.
MACD 0 LINE (macdzero) – Number of bars since crossing zero.
SMI CROSS (smicross) – A bullish or bearish cross in overbought/oversold territory.
TK Cross (tk) – Tenkan/Kijun cross and how many bars ago.
MACD Cross (macd) – MACD crossing above/below its signal line.
Last Pattern (lastpat) – The candle pattern found and bars since it popped.
Pattern (pattype) – The name of that pattern (Hammer, Hanging Man, etc.).
Each cell can be tinted in a blue-ish glow for bullish vibes, or a purple shade for bearish signals. The “bars ago” text helps you see how fresh the signal is—fewer bars = more relevant.
Usage Notes
OANDA Chart is King
Always apply this indicator on an OANDA-based chart (e.g., OANDA:GBPJPY). If you deviate, the script might not retrieve data properly from the OANDA feed.
Symbol List
For each of the symbols inputs, pick your favorite currency crosses (all from the OANDA universe).
Timeframes
The script runs on your current chart’s timeframe for near-term action.
It simultaneously checks the daily timeframe to measure high-level momentum.
Fade-Out Feature
By default, signals older than 5 bars fade out. Adjust in “Time Display Settings” if you want them to linger.
Confluence is King
If a pivot breakout, bullish Ichimoku cross, and an SMI overbought cross all light up at once, you might have a short-term rocket on your hands. Always confirm with your trading plan!
Summary
Embrace your inner data nerd with the Market Rhythm Scanner FX—the ultimate multi-asset intelligence platform for OANDA Forex pairs. From subtle pivot changes to daily momentum shifts, from candle patterns to MACD fireworks, it’s all consolidated into one easy-to-digest control panel.
Step 1: Load up an OANDA chart (like “OANDA:EURUSD”).
Step 2: Enter your chosen OANDA pairs under “Symbol Settings.”
Step 3: Geek out over the instant real-time multi-indicator table, letting you see which instruments are sizzling or fizzling.
No more frantic tab-hopping. Save your mental bandwidth for the big decisions.
Let the Ultimate Market Rhythm Scanner FX be your ever-watchful sidekick, scanning the charts so you can conquer the Forex battlefield like the tech-savvy champion you are!
This script is free to use at present, but I reserve the right to move it behind a paywall in the future.
Dynamic RSI Price Levels (Multi-Timeframe)This indicator dynamically calculates the nearest price levels where RSI (14) reaches 70 (Overbought) and 30 (Oversold) across multiple timeframes. It helps traders identify potential reversal zones and key support/resistance levels based on RSI behavior.
📌 Key Features:
✔ Multi-Timeframe Support: Calculates RSI-based price levels across 1min to 1M (monthly) timeframes.
✔ Dynamic Overbought (OB) & Oversold (OS) Levels: Automatically finds the nearest price where RSI = 70 (OB) and RSI = 30 (OS).
✔ Customizable RSI Settings: Users can adjust RSI length for more flexibility.
✔ Customizable Display: Adjustable line style, thickness, and colors for OB/OS levels.
✔ Clear Labels: Displays RSI timeframe and level directly on the chart.
🛠 How to Use:
Enable preferred timeframes and set RSI parameters.
The script will plot the closest OB (RSI 70) and OS (RSI 30) price levels automatically.
Labels show the timeframe and RSI level for better clarity.
⚠ Note:
For technical analysis only, not financial advice.
Too many enabled timeframes may clutter the chart—enable only needed ones.
🚀 Perfect for:
✔ Identifying Overbought & Oversold Zones
✔ Tracking RSI-Based Support & Resistance Levels
✔ Analyzing Market Conditions Across Timeframes

SatoshiSteps Swing StrategyCore Components:
The indicator combines three popular technical analysis tools:
Ichimoku Cloud: This helps identify the trend, support, and resistance levels.
RSI (Relative Strength Index): This momentum oscillator identifies overbought and oversold conditions.
MACD (Moving Average Convergence Divergence): This trend-following momentum indicator shows the relationship between two moving averages1 of prices.
Logic:
The strategy aims to identify potential swing trading opportunities by combining signals from these three components. It essentially looks for:
Trend Confirmation (Ichimoku):
Price should be above the Ichimoku cloud for buy signals.
Price should be below the Ichimoku cloud for sell signals.
The Tenkan-sen (conversion line) should cross above the Kijun-sen (base line) for buy signals.
The Tenkan-sen should cross below the Kijun-sen for sell signals.
Overbought/Oversold Conditions (RSI):
RSI should be below the overbought level for buy signals (avoiding buying when the market is potentially overextended).
RSI should be above the oversold level for sell signals (avoiding selling when the market is potentially oversold).
Momentum Confirmation (MACD):
The MACD line should be above the signal line for buy signals (indicating upward momentum).
The MACD line should be below the signal line for sell signals (indicating downward momentum).
Buy Signal:
A buy signal is generated when all the following conditions are met:
The Tenkan-sen crosses above the Kijun-sen.
The price is above both the Senkou Span A and Senkou Span B (the cloud).
The RSI is below the overbought level.
The MACD line is above the signal line.
Sell Signal:
A sell signal is generated when all the following conditions are met:
The Tenkan-sen crosses below the Kijun-sen.
The price is below both the Senkou Span A and Senkou Span B (the cloud).
The RSI is above the oversold level.
The MACD line is below the signal line.
Key Considerations:
Time Frame: The indicator has built-in adjustments for 1-hour and 4-hour timeframes, optimizing the parameters for each.
Customization: You can customize the overbought/oversold RSI levels and the styles of the buy/sell signals (triangle, label, arrow, circle) through the indicator's settings.
Accuracy: While the strategy combines multiple indicators to improve accuracy, remember that no trading indicator is perfect. Market conditions can change rapidly, and false signals can occur.
Risk Management: Always use proper risk management techniques, such as stop-loss orders, and never risk more than you can afford to lose.

Averaged Stochastic RSI by TenozenSimplicity beats everything! Averaged Stochastic RSi is calculated using the 2 points of stochastic of the RSI, where the difference is by 2 (larger), and averaged out the stochastic's values. In result it is less noisy and more responsive towards the market's momentum.
I hope you guys find this indicator useful! So far this is the best indicator I ever had! And I also learned that simplicity is better than complex blurry/abstract problems. Ciao!

Uptrick: Quantum RSI +Uptrick: Quantum RSI+ (QR-Pro) is a technical analysis indicator designed to enhance the functionality of the traditional Relative Strength Index (RSI). It incorporates adaptive volatility adjustments, threshold calculations, divergence detection, and visualization enhancements. This script is a vendor-protected indicator, and its source code is not publicly available. It adheres to TradingView’s vendor requirements while providing traders with a refined approach to analyzing market momentum, strength, and trend conditions.
Purpose:
The purpose of Quantum RSI+ (QR-Pro) is to adapt the RSI methodology dynamically based on changing market conditions. By utilizing smoothing techniques, adjustable length calculations, and divergence detection, it provides a structured way to evaluate trend strength and potential reversals. The indicator aims to offer a balanced response to varying levels of market volatility, helping traders minimize lag while reducing signal noise. Unlike standard RSI indicators that rely on fixed period settings, this script adapts to real-time market conditions, offering enhanced responsiveness and more accurate detection of potential reversal points.
Overview:
Quantum RSI+ (QR-Pro) modifies traditional RSI calculations by integrating a state-based adjustment system that alters the RSI length dynamically. This allows the indicator to respond more effectively to different volatility environments. It incorporates multiple analytical tools, such as divergence detection and support/resistance visualization, to assist in identifying momentum shifts and trend strength. In addition, the script offers an advanced metrics table that provides deeper insights into market statistics such as entropy, kurtosis, and volatility analysis. These insights are valuable for traders who wish to understand market structure in greater detail and adjust their strategies accordingly.
Originality:
This indicator differentiates itself by combining adaptive RSI length adjustments, divergence detection, and dynamic learning zones. Unlike standard RSI implementations that use fixed calculations, Quantum RSI+ (QR-Pro) adjusts automatically to market volatility, making it more responsive and effective under changing conditions. The advanced metrics table, which includes measures like the Hurst exponent, entropy, kurtosis, and volatility Z-score, further distinguishes the script by offering an additional layer of market intelligence. These metrics help traders determine whether a market is trending or mean-reverting, assess randomness, and identify volatility spikes, thereby justifying the script's value compared to freely available alternatives.
Enhanced RSI Framework:
Quantum RSI+ (QR-Pro) introduces a framework that adjusts RSI sensitivity based on volatility. Traditional RSI methods use a fixed calculation period, which can result in signals that either react too slowly or too quickly depending on market behavior. This indicator modifies the RSI length dynamically, shortening it in high-volatility periods to capture rapid shifts while extending it in low-volatility periods to filter out noise. This adaptive approach provides a more balanced assessment of market momentum and helps traders avoid false signals. It is best used in conjunction with other technical analysis tools to validate trade setups and manage risk effectively.
Advanced Adaptive Smoothing:
The script employs a multi-layered smoothing technique to refine RSI readings. Traditional RSI indicators can be affected by market noise, leading to erratic signals. By applying a structured smoothing process, Quantum RSI+ (QR-Pro) helps identify sustained trends while filtering out short-lived fluctuations. This balance between reactivity and stability leads to more reliable momentum assessments, making it easier for traders to discern genuine market movements from transient noise.
Dynamic Market Intelligence:
Instead of relying on static thresholds, Quantum RSI+ (QR-Pro) calculates its levels dynamically based on historical market performance. This approach provides a contextual understanding of market conditions, allowing traders to better anticipate reversals. Additional validation methods further increase the reliability of the signals, making the indicator a practical tool for confirming potential trend changes in real time.
Inputs:
• Line Width – Sets the thickness of the RSI plot line for visual clarity.
• MA Type for Quantum RSI – Allows users to choose the type of moving average (SMA, EMA, WMA, or VWMA) to overlay on the Quantum RSI.
• MA Length – Defines the period used for the selected moving average, providing additional trend filtering.
• Enable Moving Average – Toggles the calculation and plotting of the chosen moving average on the RSI. Bar coloring is then adjusted according to the slope of this MA if enabled.
• Ribbon Help – Enables or disables a moving average ribbon that visually compares two moving averages for enhanced trend clarity. Bar coloring is then adjusted according to the slope of this Ribbon if enabled.
• Ribbon Difference – Adjusts the gap between the fast and slow moving averages used in the ribbon visualization.
• Slope Length – Determines the period for calculating the slope of the moving average, which influences its color representation based on trend direction. A higher value usually can help filter out more noise as it would not be affected by small moves.
• Show Advanced Metrics Table – Toggles the display of a table that presents advanced market metrics.
Features and Usage:
• Adaptive RSI Length – Dynamically adjusts the RSI length based on market volatility. Traders can use this feature to obtain more responsive RSI signals during volatile periods and smoother readings during calmer market conditions.
• Quantum RSI Smoothing – Applies a structured smoothing process to RSI values to reduce noise, helping traders focus on genuine momentum shifts rather than transient fluctuations.
• Holographic Divergence Detection – Detects bullish and bearish divergences by comparing price action with RSI movements. This feature can be used to confirm potential trend reversals when combined with other market data.
• Gradient-Filled Zones – Highlights areas with smooth gradient transitions, making it easier to visualize and anticipate shifts in market sentiment.
• Moving Average of RSI – Overlays different moving averages on the RSI to provide additional trend filtering and confirmation for trading decisions.
• Ribbon Visualization – Displays a dynamic moving average ribbon that compares fast and slow moving averages, offering additional visual context and clarity regarding trend direction and potential momentum shifts.
• Metrics Table – Presents market statistics such as the Hurst exponent, Shannon entropy, kurtosis, skewness, fractal dimension, and volatility Z-score. These metrics offer deeper insights into market structure, assisting traders in understanding whether markets are trending or reverting and identifying periods of uncertainty. Here's what the metrics tell you:
• Hurst Exponent – Provides insight into whether market behavior tends to follow a trending or mean-reverting pattern.
• Shannon Entropy – Gauges the randomness or unpredictability in price movements, reflecting market stability.
• Kurtosis – Highlights the likelihood of extreme price swings, indicating the presence of heavy tails in the return distribution.
• Skewness – Indicates the asymmetry in the distribution of returns, pointing to potential biases in price direction.
• Fractal Dimension – Assesses the complexity of market patterns, revealing the intricacy of price action.
• Volatility Z-Score – Standardizes current volatility relative to historical levels, helping to identify periods of unusual market activity.
• UPT State – Provides a qualitative evaluation of the overall market environment, categorizing conditions as favorable, cautionary, or neutral for trading.
• Alerts – Built-in alert conditions notify users when bullish or bearish divergences occur, enabling traders to automate signal detection and respond promptly to market changes.
Summary:
Quantum RSI+ (QR-Pro) is a structured RSI-based momentum analysis tool that adapts to market conditions dynamically. By incorporating volatility-based adjustments, adaptive threshold calculations, and divergence detection, it delivers enhanced trend recognition and trade signals. Its advanced visualization techniques and moving average options offer a clear representation of market dynamics, while the advanced metrics table provides additional insights into market structure and behavior. Traders can use this indicator to identify overbought and oversold conditions dynamically, filter market noise through adaptive smoothing, and confirm trade signals using divergence detection. It is best applied as part of a comprehensive technical analysis strategy to validate trends and potential reversals in real-world trading scenarios.
Disclaimer:
This indicator is a technical analysis tool and should not be considered financial advice. Trading involves significant risk, and past performance does not guarantee future results. Users should exercise discretion and employ proper risk management when utilizing this tool in live trading.

Uptrick: FRAMA Matrix RSIUptrick: FRAMA Matrix RSI
Introduction
The Uptrick: FRAMA Matrix RSI is a momentum-based indicator that integrates the Relative Strength Index (RSI) with the Fractal Adaptive Moving Average (FRAMA). By applying FRAMA's adaptive smoothing to RSI—and further refining it with a Zero-Lag Moving Average (ZLMA)—this script creates a refined and reliable momentum oscillator. The indicator now includes enhanced divergence detection, potential reversal signals, customizable buy/sell signal options, an internal stats table, and a fully customizable bar coloring system for an enhanced visual trading experience.
Why Combine RSI with FRAMA
Traditional RSI is a well-known momentum indicator but has several limitations. It is highly sensitive to price fluctuations, often generating false signals in choppy or volatile markets. FRAMA, in contrast, adapts dynamically to price changes by adjusting its smoothing factor based on market conditions.
By integrating FRAMA into RSI calculations, this indicator reduces noise while preserving RSI's ability to track momentum, adapts to volatility by reducing lag in trending markets and smoothing out choppiness in ranging conditions, enhances trend-following capability for more reliable momentum shifts, and refines overbought and oversold signals by adjusting to the current market structure.
With the new enhancements, such as a manual alpha input, noise filtering, divergence detection, and multiple buy/sell signal options, the indicator offers even greater flexibility and precision for traders. This combination improves the standard RSI by making it more adaptive and responsive to market changes.
Originality
This indicator is unique because it applies FRAMA's adaptive smoothing technique to RSI, creating a dynamic momentum oscillator that adjusts to different market conditions. Many traditional RSI-based indicators either use fixed smoothing methods like exponential moving averages or employ basic RSI calculations without adjusting for volatility.
This script stands out by integrating several elements, including the fractal dimension-based smoothing of FRAMA to reduce noise while retaining responsiveness, the use of Zero-Lag Moving Average smoothing to enhance trend sensitivity and reduce lag, divergence detection to highlight mismatches between price action and RSI momentum, a noise filter and manual alpha option to prevent minor fluctuations from generating false signals, customizable buy/sell signal options that let traders choose between ZLMA-based or FRAMA RSI-based signals, an internal stats table displaying real-time FRAMA calculations such as fractal dimension and the adaptive alpha factor, and a fully customizable bar coloring system to visually distinguish bullish, bearish, and neutral conditions.
Features
Adaptive FRAMA RSI
The indicator applies FRAMA to RSI values, making the momentum oscillator adaptive to volatility while filtering out noise. Unlike a traditional RSI that reacts equally to all price movements, FRAMA RSI adjusts its smoothing factor based on market structure, making it more effective for identifying true momentum shifts.
Zero-Lag Moving Average (ZLMA)
A smoothing technique that minimizes lag while preserving the responsiveness of price movements. It is applied to the FRAMA RSI to further refine signals and ensure smoother trend detection.
Bullish and Bearish Threshold Crossovers
This system compares FRAMA RSI to a user-defined threshold (default is 50). When FRAMA RSI moves above the threshold, it indicates bullish momentum, while movement below signals bearish conditions. The enhanced noise filter ensures that only significant moves trigger signals.
Noise Filter and Manual Alpha
A new noise filter input prevents tiny fluctuations from triggering false signals. In addition, a manual alpha option allows traders to override the automatically computed smoothing factor with a custom value, providing extra control over the indicator’s sensitivity.
Divergence Detection
The indicator identifies divergence patterns by comparing FRAMA RSI pivots to price action. Bullish divergence occurs when price makes a lower low while FRAMA RSI makes a higher low, and bearish divergence occurs when price makes a higher high while FRAMA RSI makes a lower high. These signals can help traders anticipate potential reversals.
Reversal Signals
Labels appear on the chart when FRAMA RSI confirms classic RSI overbought (70) or oversold (30) conditions, providing visual cues for potential trend reversals.
Buy and Sell Signal Options
Traders can now choose between two signal-generation methods. ZLMA-based signals trigger when the ZLMA of FRAMA RSI crosses key overbought (70) or oversold (30) levels, while FRAMA RSI-based signals trigger when FRAMA RSI itself crosses these levels. This added flexibility allows users to tailor the indicator to their preferred trading style.
ZLMA:
FRAMA:
Customizable Alerts
Alerts notify traders when FRAMA RSI crosses key levels, divergence signals occur, reversal conditions are met, or buy/sell signals trigger. This ensures that important trading events are not missed.
Fully Customizable Bar Coloring System
Users can color bars based on different conditions, enhancing visual clarity. Bar coloring modes include: FRAMA RSI threshold (bars change color based on whether FRAMA RSI is above or below the threshold), ZLMA crossover (bars change when ZLMA crosses overbought or oversold levels), buy/sell signals (bars change when official signals trigger), divergence (bars highlight when bullish or bearish divergence is detected), and reversals (bars indicate when RSI reaches overbought or oversold conditions confirmed by FRAMA RSI). The system also remembers the last applied bar color, ensuring a smooth visual transition.
Input Parameters and Features
Core Inputs
RSI Length (default: 14) defines the period for RSI calculations.
FRAMA Lookback (default: 16) determines the length for the FRAMA smoothing function.
RSI Bull Threshold (default: 50) sets the level above which the market is considered bullish and below which it is bearish.
Noise Filter (default: 1.0) ensures that small fluctuations do not trigger false bullish or bearish signals.
Additional Features
Show Bull and Bear Alerts (default: true) enables notifications when FRAMA RSI crosses the threshold.
Enable Divergence Detection (default: false) highlights bullish and bearish divergences based on price and FRAMA RSI pivots.
Show Potential Reversal Signals (default: false) identifies overbought (70) and oversold (30) levels as possible trend reversal points.
Buy and Sell Signal Option (default: ZLMA) allows traders to choose between ZLMA-based signals or FRAMA RSI-based signals for trade entry.
ZLMA Enhancements
ZLMA Length (default: 14) determines the period for the Zero-Lag Moving Average applied to FRAMA RSI.
Visualization Options
Show Internal Stats Table (default: false) displays real-time FRAMA calculations, including fractal dimension and the adaptive alpha smoothing factor.
Show Threshold FRAMA Signals (default: false) plots buy and sell labels when FRAMA RSI crosses the threshold level.
How It Works
FRAMA Calculation
FRAMA dynamically adjusts smoothing based on the price fractal dimension. The alpha smoothing factor is derived from the fractal dimension or can be set manually to maintain responsiveness.
RSI with FRAMA Smoothing
RSI is calculated using the user-defined lookback period. FRAMA is then applied to the RSI to make it more adaptive to volatility. Optionally, ZLMA is applied to further refine the signals and reduce lag.
Bullish and Bearish Threshold Crosses
A bullish condition occurs when FRAMA RSI crosses above the threshold, while a bearish condition occurs when it falls below. The noise filter ensures that only significant trend shifts generate signals.
Buy and Sell Signal Options
Traders can choose between ZLMA crossovers or FRAMA RSI crossovers as the basis for buy and sell signals, offering flexibility in trade entry timing.
Divergence Detection
The indicator identifies divergences where price action and FRAMA RSI momentum do not align, potentially signaling upcoming reversals.
Reversal Signal Labels
When classic RSI overbought or oversold levels are confirmed by FRAMA RSI conditions, reversal labels are added on the chart to highlight potential exhaustion points.
Bar Coloring System
Bars are dynamically colored based on various conditions such as RSI thresholds, ZLMA crossovers, buy/sell signals, divergence, and reversals, allowing traders to quickly interpret market sentiment.
Alerts and Internal Stats
Customizable alerts notify traders of key events, and an optional internal stats table displays real-time calculations (fractal dimension, alpha value, and RSI values) to help users understand the underlying dynamics of the indicator.
Summary
The Uptrick: FRAMA Matrix RSI offers an enhanced approach to momentum analysis by combining RSI with adaptive FRAMA smoothing and additional layers of signal refinement. The indicator now includes adaptive RSI smoothing to reduce noise and improve responsiveness, Zero-Lag Moving Average filtering to minimize lag, divergence and reversal detection to identify potential turning points, customizable buy/sell signal options that let traders choose between different signal methodologies, a fully customizable bar coloring system to visually distinguish market conditions, and an internal stats table for real-time insight into FRAMA calculation parameters.
Whether used for trend confirmation, divergence detection, or momentum-based strategies, this indicator provides a powerful and adaptive approach to trading.
Disclaimer
This script is for informational and educational purposes only. Trading involves risk, and past performance does not guarantee future results. Always conduct proper research and consult with a financial advisor before making trading decisions.

Arpeet MACDOverview
This strategy is based on the zero-lag version of the MACD (Moving Average Convergence Divergence) indicator, which captures short-term trends by quickly responding to price changes, enabling high-frequency trading. The strategy uses two moving averages with different periods (fast and slow lines) to construct the MACD indicator and introduces a zero-lag algorithm to eliminate the delay between the indicator and the price, improving the timeliness of signals. Additionally, the crossover of the signal line and the MACD line is used as buy and sell signals, and alerts are set up to help traders seize trading opportunities in a timely manner.
Strategy Principle
Calculate the EMA (Exponential Moving Average) or SMA (Simple Moving Average) of the fast line (default 12 periods) and slow line (default 26 periods).
Use the zero-lag algorithm to double-smooth the fast and slow lines, eliminating the delay between the indicator and the price.
The MACD line is formed by the difference between the zero-lag fast line and the zero-lag slow line.
The signal line is formed by the EMA (default 9 periods) or SMA of the MACD line.
The MACD histogram is formed by the difference between the MACD line and the signal line, with blue representing positive values and red representing negative values.
When the MACD line crosses the signal line from below and the crossover point is below the zero axis, a buy signal (blue dot) is generated.
When the MACD line crosses the signal line from above and the crossover point is above the zero axis, a sell signal (red dot) is generated.
The strategy automatically places orders based on the buy and sell signals and triggers corresponding alerts.
Advantage Analysis
The zero-lag algorithm effectively eliminates the delay between the indicator and the price, improving the timeliness and accuracy of signals.
The design of dual moving averages can better capture market trends and adapt to different market environments.
The MACD histogram intuitively reflects the comparison of bullish and bearish forces, assisting in trading decisions.
The automatic order placement and alert functions make it convenient for traders to seize trading opportunities in a timely manner, improving trading efficiency.
Risk Analysis
In volatile markets, frequent crossover signals may lead to overtrading and losses.
Improper parameter settings may cause signal distortion and affect strategy performance.
The strategy relies on historical data for calculations and has poor adaptability to sudden events and black swan events.
Optimization Direction
Introduce trend confirmation indicators, such as ADX, to filter out false signals in volatile markets.
Optimize parameters to find the best combination of fast and slow line periods and signal line periods, improving strategy stability.
Combine other technical indicators or fundamental factors to construct a multi-factor model, improving risk-adjusted returns of the strategy.
Introduce stop-loss and take-profit mechanisms to control single-trade risk.
Summary
The MACD Dual Crossover Zero Lag Trading Strategy achieves high-frequency trading by quickly responding to price changes and capturing short-term trends. The zero-lag algorithm and dual moving average design improve the timeliness and accuracy of signals. The strategy has certain advantages, such as intuitive signals and convenient operation, but also faces risks such as overtrading and parameter sensitivity. In the future, the strategy can be optimized by introducing trend confirmation indicators, parameter optimization, multi-factor models, etc., to improve the robustness and profitability of the strategy.

MACD Histogram Color Tabledisplaying the MACD Histogram color and divergences across multiple timeframes. Here's how it works step by step:
1. Setting the Table Position
The script allows the user to choose where the table will be placed using the positionOption input. The three options are:
Top Right
Top Left
Top Center
Depending on the selected option, the table is created at the corresponding position.
2. Creating the Table
A table (macdTable) is created with 8 columns (for different timeframes) and 3 rows (for different data points).
3. MACD Histogram Color Function (f_get_macd_color)
This function calculates the MACD line, signal line, and histogram for a given timeframe.
The histogram (histLine) is used to determine the cell background color:
Green if the histogram is positive.
Red if the histogram is negative.
4. Divergence Detection Function (f_detect_divergence)
This function looks for bullish and bearish divergences using the MACD histogram:
Bullish Divergence (🟢)
The price makes a lower low.
The MACD histogram makes a higher low.
Bearish Divergence (🔴)
The price makes a higher high.
The MACD histogram makes a lower high.
The function returns:
🟢 (green circle) for bullish divergence.
🔴 (red circle) for bearish divergence.
"" (empty string) if no divergence is detected.
5. Populating the Table
The table has three rows for each timeframe:
First row: Displays the timeframe labels (5m, 15m, 30m, etc.).
Second row: Shows MACD Histogram color (red/green).
Third row: Displays divergences (🟢/🔴).
This is done using table.cell() for each timeframe.
6. Final Result
A table is displayed on the chart.
Each column represents a different timeframe.
The color-coded row shows the MACD histogram status.
The bottom row shows detected divergences.

Double RSI + MA Signal [AlgoRich]Objective:
This indicator combines two RSI (Relative Strength Index) calculations with moving averages applied to each. It generates visual signals to help identify overbought, oversold conditions, and potential trend reversals.
Functions and Key Features:
Dual Customizable RSI:
Two RSIs are calculated using different periods (for example, one with 7 periods and another with 14 periods).
This allows you to compare two perspectives on price strength over different timeframes.
Selectable Moving Averages for the RSI:
Each RSI can be smoothed using a moving average, with the type being selectable:
EMA (Exponential Moving Average)
SMA (Simple Moving Average)
WMA (Weighted Moving Average)
DEMA (Double Exponential Moving Average), which is calculated in a custom way for a faster response.
You can also independently set the length (period) of these moving averages for each RSI.
Display of Key Levels:
Horizontal lines are drawn at important levels (80, 70, 50, 30, and 20).
These levels help identify overbought conditions (above 70 or 80) and oversold conditions (below 30 or 20).
Dynamic Colors and Fill Between the RSIs:
The two RSIs are plotted with dynamic colors that change based on their relationship:
For example, if the shorter-period RSI is above the longer-period RSI, a color (such as green) is used to indicate strength; otherwise, another color (such as red) is applied.
Additionally, a fill is drawn between the two RSIs that changes tone according to which RSI is dominant, making it easier to visualize divergences or convergences between them.
Signals Through Moving Averages Applied to the RSI:
The moving averages applied to each RSI act as an additional reference line, helping to detect when the RSI is accelerating or stabilizing.
These lines are displayed on the chart in contrasting colors to make them easy to identify.
Benefits of Using This Indicator:
Early Trend Reversal Detection:
Combining two RSIs with different periods and their moving averages can help identify divergences and early changes in price strength.
Clear Visual Presentation:
The dynamic colors and fill between the RSIs provide a clear visual representation of which side (bullish or bearish) is dominating at any given time.
Flexibility and Customization:
The adjustable parameters allow you to tailor the indicator to different assets and timeframes, according to your trading preferences.

Overextension Oscillator [by DanielM]The Overextension Oscillator is an indicator that detects when a market move has extended significantly beyond its typical range, signaling potential areas for a correction or reversal. Unlike traditional oscillators that rely on fixed overbought/oversold levels, this tool dynamically adjusts its thresholds based on historical swing high and swing low movements.
By analyzing all swing points on the chart, the indicator determines the expected range of price movements and identifies when the price extends beyond normal levels. Since every asset has different price behavior and volatility, swing lengths may vary from asset to asset, ensuring that overextension is measured relative to each market's historical price behavior.
How It Works
1️⃣ Swing Detection & Data Collection
The indicator scans all available swing highs and swing lows on the chart to gather a complete dataset of past price fluctuations.
It records the percentage differences between swings to determine how much price typically moves in a given market.
2️⃣ Overextension Calculation
Using the stored swing data, the indicator calculates:
Average Swing Difference – Measures the average percentage difference between swings.
Average Move Percentage – Determines the typical magnitude of price moves within a trend cycle.
These values are used to create dynamic overextension thresholds that adjust based on historical data.
3️⃣ Price Distance & Overextension Measurement
The indicator calculates the distance between the current price and the closest historical swing point. If this distance exceeds the predefined threshold based on past swings, the move is considered overextended. The greater the deviation, the higher the probability of a pullback or short-term reversal.
4️⃣ Buy/Sell Signal Generation
A Buy signal is generated when the price has dropped below an overextended threshold relative to a past swing low.
A Sell signal is generated when the price has risen beyond an overextended threshold relative to a past swing high.
These signals indicate that the price has reached a level where it historically tends to slow down or reverse.

Finite Difference - Backward (mcbw_)In calculus there exists a 'derivative', which simply just measures the difference between two points on a curve. For well behaved mathematical functions there are infinitely many points and so there exists a derivative at every point. Where there are infinitely many points in a curve that curve is called 'continuous'. Continuous curves are very nice to deal with since each point on it exists almost exactly where its neighbors are. However, if the curve does not have infinitely many points on it, but instead has a finite number of points on it, that curve is called 'discrete' instead of continuous. Taking the derivative of discrete curves is much trickier business since there are none of the mathematical conveniences that a continuous offers. In the real world everything we measure is a discrete curve, including Price (since we measure it a finite number of times, aka each candlestick)!
The branch of Discrete Mathematics has found an approach to measure the derivative along a discrete curve, that approach is aptly called " Finite Difference ". To get a more accurate approximation of a discrete derivative, the finite difference approach uses weighted combinations of neighboring points. The most common type of finite difference is a 'central' difference, this uses a combination of points before and after the point of interest to approximate the discrete derivative. This is great for historical analysis but is not of much use for trading algorithms since it technically means using future prices to calculate the derivative of the current point. Instead we can use a less common variant called a ' Backwards Difference ' that only uses a combination of points before the current one to help approximate the current derivative.
In this script you can choose the " Order " of your derivative and the " Accuracy " of its approximation. This script is for educational purposes for folks building trading algorithms. Many trading algorithms often have an element of seeing how much Price has changed from the previous candle to the current candle. This approach is the lowest accuracy derivative possible, and using the backwards finite differences, made available for the first time on TradingView (!!), algorithms that use derivatives can now have higher orders of accuracy!
Happy Trading/Developing!
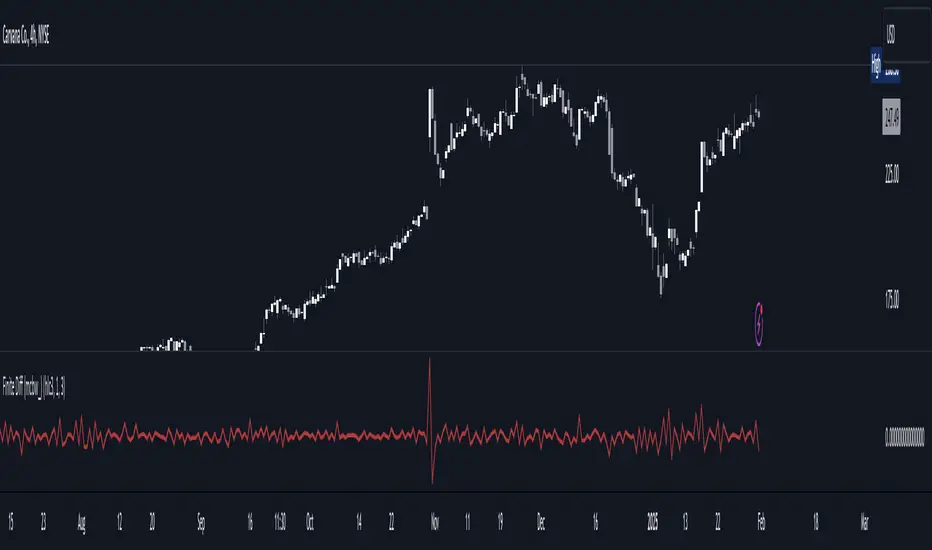
Liquidity Heatmap & Volume-Weighted RSILiquidity Heatmap Indicator with Volume-Weighted RSI
Description:
The Liquidity Heatmap Indicator with Volume-Weighted RSI (VW-RSI) is a powerful tool designed for traders to visualize market liquidity zones while integrating a volume-adjusted momentum oscillator. This indicator provides a dynamic heatmap of liquidity levels across various price points and enhances traditional RSI by incorporating volume weight, making it more responsive to market activity.
Key Features:
Liquidity Heatmap Visualization: Identifies high-liquidity price zones, allowing traders to spot potential areas of support, resistance, and accumulation.
Volume-Weighted RSI (VW-RSI): Enhances the RSI by factoring in trading volume, reducing false signals and improving trend confirmation.
Customizable Sensitivity: Users can adjust parameters to fine-tune heatmap intensity and RSI smoothing.
Dynamic Market Insights: Helps identify potential price reversals and trend strength by combining liquidity depth with momentum analysis.
How to Use:
1. Identify Liquidity Zones: The heatmap colors indicate areas of high and low liquidity, helping traders pinpoint key price action areas.
2. Use VW-RSI for Confirmation: When VW-RSI diverges from price near a liquidity cluster, it signals a potential reversal or continuation.
3. Adjust Parameters: Fine-tune the RSI period, volume weighting, and heatmap sensitivity to align with different trading strategies.
This indicator is ideal for traders who rely on order flow analysis, volume-based momentum strategies, and liquidity-driven trading techniques.
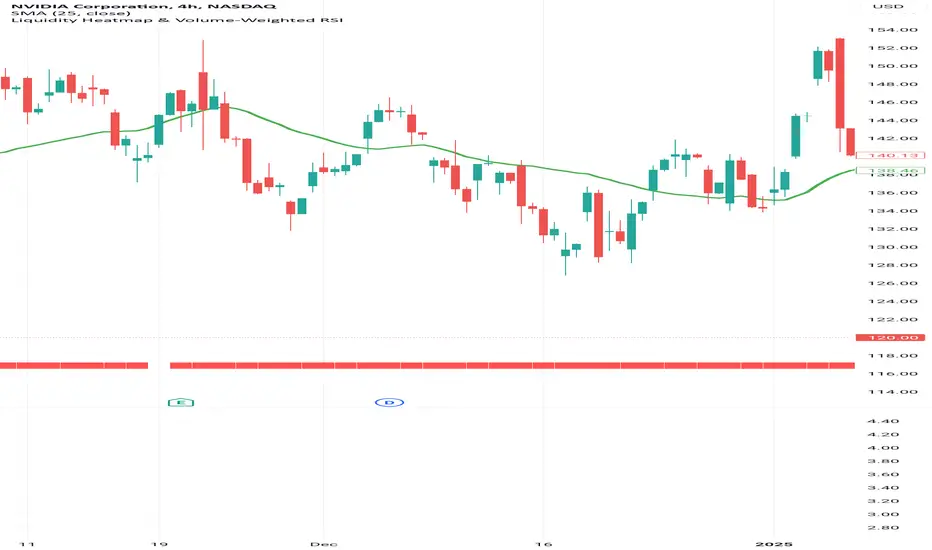
Early MACD Reversal IndicatorThis indicator should provide early warnings of potential price reversal based on the difference between the MACD and its signal line. The keys of the reversal come from creating a histogram of the difference between the two lines and further monitoring the first indications of breadth decrease. The first change when trending up will paint a red vertical line and downward triangle to indicate potential trend reversal to the low side. The opposite with a green vertical line and upward triangle signals potential upside movement soon.
Enjoy!
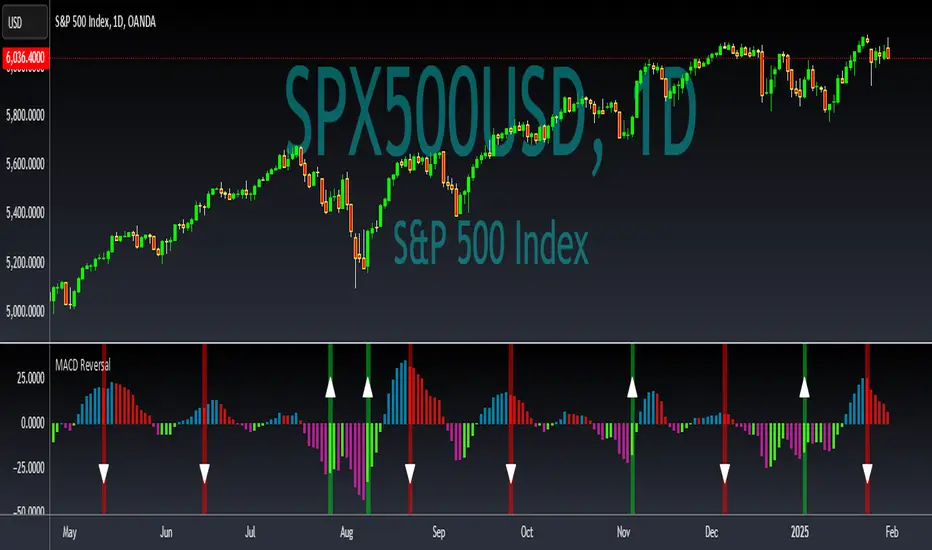
HTC peppermint_07 CCI w signal + s&r RSI
This CCI version enhances the traditional Commodity Channel Index (CCI) by integrating a dynamically calculated Relative Strength Index (RSI) that acts as support and resistance as shown in the screenshot, it can add as a confirmation to the divergence found in the CCI.
Key Features:
Enhanced CCI: The primary plot (black line but customizable) represents the standard CCI, providing insight into price momentum and potential overbought/oversold conditions.
Dynamic RSI Support/Resistance: The upper and lower bands (medium cyan line) are derived from a smoothed RSI, dynamically adjusting to the current market volatility. These bands serve as potential support and resistance levels for the CCI as additional confirmation for the divergence.
Overbought/Oversold Zones: The traditional overbought (+100) and oversold (-100) levels for CCI are marked with horizontal dotted lines.
Benefits:
Improved Entry/Exit Signals: Combining CCI with dynamic RSI support/resistance may offer more precise trading signals compared to using CCI alone.
Dynamic Adaptation: The RSI-based bands adapt to changing market conditions, potentially providing more relevant support and resistance levels.
Divergence Confirmation: dynamic s&r RSI adds confluence to potential trend reversals identified by the CCI.
Potential Usage:
Traders might use this indicator to:
Identify potential overbought/oversold conditions using the CCI and its relationship to the dynamic RSI bands.
Look for breakouts beyond the dynamic support/resistance levels as potential entry points.
Confirm potential trend reversals using RSI divergence (cyan and red label above divergence) signals.
Further Development Considerations:
Customizable Parameters: Allowing users to adjust the CCI length, RSI periods, and smoothing factors would enhance flexibility.
Alert Conditions: Adding alerts for breakouts, overbought/oversold conditions, and divergence signals would improve usability.
Backtesting: Thoroughly backtesting the indicator's performance across different assets and timeframes is essential before using it for live trading.
DISCLAIMER: !!
indicator is a custom technical analysis tool designed for educational and informational purposes only. It should not be construed as financial advice or a recommendation to buy or sell any security. Trading involves substantial risk of loss and may not be suitable for all investors.
Key Points to Consider:
No Guarantee of Profitability: The indicator's past performance is not indicative of future results. No trading strategy can guarantee profits or eliminate the risk of losses. You could lose some or all of your investment.
Use at Your Own Risk: Use of this indicator is solely at your own discretion and risk. You are responsible for your trading decisions. The developers and distributors of this indicator are not liable for any losses incurred as a result of using it.
Not Financial Advice: This indicator does not provide financial advice. Consult with a qualified financial advisor before making any investment decisions.
Backtesting Limitations: Backtested results, if presented, should be viewed with caution. Past performance may not reflect future results due to various factors, including changing market conditions and the limitations of backtesting methodologies.
Indicator Limitations: Technical indicators, including this one, are not perfect. They can generate false signals, and their effectiveness can vary depending on market conditions and the specific parameters used.
Parameter Optimization: Optimizing indicator parameters for past performance can lead to overfitting, which may not translate to future profitability.
No Warranty: The indicator is provided "as is" without any warranty of any kind, either express or implied, including but not limited to warranties of merchantability, fitness for a particular purpose, or non-infringement.
Changes and Updates: The developers may make changes or updates to the indicator without notice.
By using the "HTC peppermint_07 CCI w signal + s&r RSI" indicator, you acknowledge and agree to the terms of this disclaimer. If you do not agree with these terms, do not use the indicator.
