ArkWork:: Vector of Candlesこのインジケータは連続した蝋燭とRSIを調べます。
買われ過ぎや売られ過ぎに見える背景にペイントします。
力強い価格変動の場合は、他の抵抗やサポート、修正波、ラインを見てください。
(次のチャンネルレベルへの更新の引き金となる可能性がありますので)
あくまでご参考までに。
This indicator look at the consecutive candle and RSI.
Paint to background of like a overbought or oversold.
If price movement of powerful, please look at the other resistance and support, corrective waves, lines.
(maybe have possibility, to the trigger of update to next channel level)
for your information.
Candles


BH - Candlestick Pattern DetectionThis is a script to help the beginners locate the candle patterns. It has a nice code that can be used in other scripts too. Easy to use with separated functions, simple patterns and complex patterns detections.
I have done some updates at the Candlestick Patterns Identified script by @repo32. Was a good start of my ideia. Tks for sharing repo.
It will be always under constant development but I want to share this first version to know what can be done to get better, improve, get more desired patterns, know what are you guys using that could be helpful.
I still need to check if all patterns are correct.
Any comments, help and suggestions will be appreciated.
Marcos Issler @ Isslerman

RSI candlesnice RSI candles , so you can use to see where the real trend is
in next update i will make buy and sell points

Candlestick Patterns DemoMy first Pine Script attempt to identify and display candlestick patterns on the chart. In this demo version the script identifies Doji, Bullish Engulfing and Bearish Engulfing patterns.

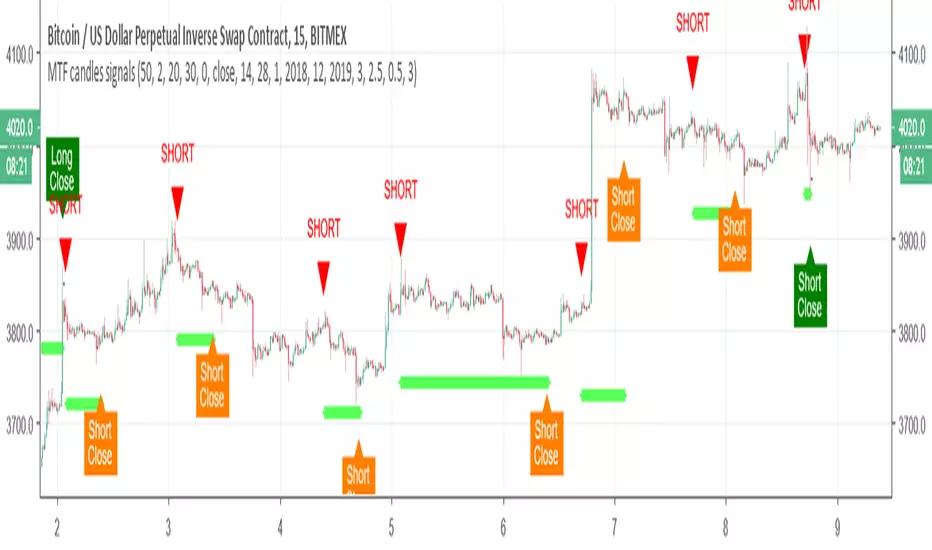
MTF candles by yatrader2 signalsthis is the signal version of this study
alerts included
for more detail look at original study
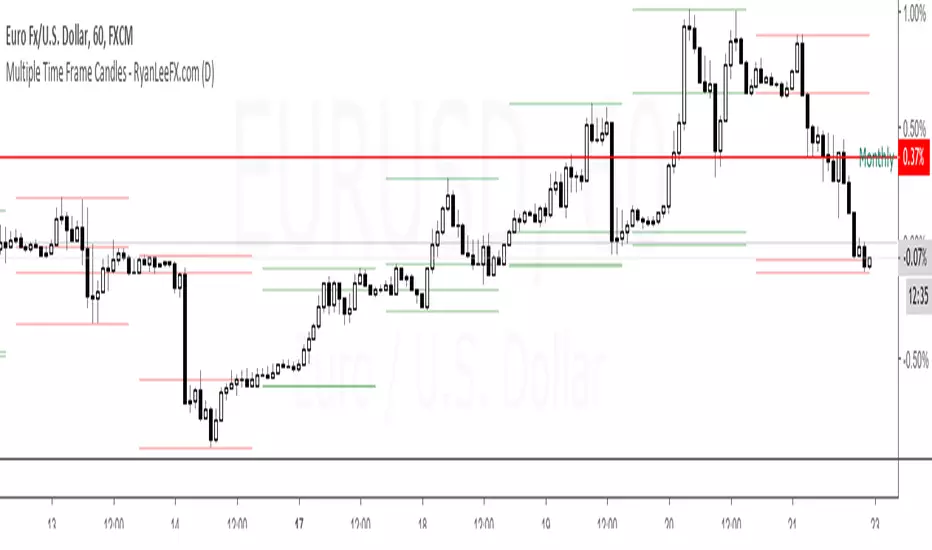
Multiple Time Frame Candles - RyanLeeFX.comMultiple Time Frame Candles is a unique script that allows traders to quickly and easily analyze price action candles across multiple time frames all from one chart. Multiple Time Frame Candles eliminates the need for price action traders to change chart time frames when trying to analyze multiple time frames. With this script, traders can easily see the candles from a lower time frame inside candles from a higher time frame.
For example, traders can see 1 Hour candles inside Daily candles. Or 5 Min candles inside Hourly candles. Or Daily candles inside Weekly candles. Or Hourly candles inside Daily candles inside Weekly candles. The options for comparing multiple time frame candles on one screen are almost limitless.
This script differs from other Multiple Time Frame Candle scripts by displaying the open, high, low and close of the larger time frame candle as well as highlighting the close price due to its proven importance.
The ability to quickly analyze multiple time frames from a single chart will make you more confident in your trades as well as save you valuable time during your analysis.
Multiple Time Frame Candles is also an amazing script to help beginning to experienced traders better visualize price movement across multiple time frames all from a single chart. Happy Trading!!
Candles HistoryA utility tool to get some metrics from the whole candles history.
Consider it as my Christmas gift to the community.
Available metrics
Starting Year
Starting Month
Starting Day
Starting Weekday
Starting Hour
Starting Minute
Highest Volume (works correctly only on the tickers with available volume data)
Lowest Volume (works correctly only on the tickers with available volume data)
Longest Candle Range
Average Candle Range
Longest Candle Body
Average Candle Body
Available Candles
Bullish Candles
Bullish Trend Candles (body >= range / 2)
Bearish Candles
Bearish Trend Candles (body >= range / 2)
Doji Candles
Bullish Marubozu Candles
Bearish Marubozu Candles
Longest Bullish Serie
Longest Bearish Serie
Good luck!

SadLittleThings Price Compare With Offset MTF by RRBSadLittleThings Price Compare With Offset MTF by RagingRocketBull 2018
Version 1.0
This indicator lets you compare multiple assets across different timeframes, supports offsets and alpha multipliers.
Standard TradingView Compare doesn't have Offset/Timeframe/Multiplier options, hence this indicator.
Features:
- compare current asset's price with 2 custom ext OHLC sources
- plot sources as lines/bars/candles
- use offset:
- for lines - both positive/negative offsets, unlimited
- for bars/candles - only positive offsets <= 5000
- specify timeframe for each source
- uses timeframe textbox instead of input resolution dropdown to allow for 240 120 and other custom TFs
- support for timeframes in H: H, 2H, 4H etc
- show/hide sources
- colorize sources
- convert source price to 1000s, mlns, or blns using alpha multiplier
- total bars counter
Notes on using offsets:
- Max offset is defined by study max_bars_back which is limited to 5000 for free accounts. This variable specifies the number of history bars an indicator can access.
- if you see the 'internal server study error' => one of the indexes of ohlc series is out of bounds (i.e. close ) => decrease the offset <= 5000 or switch to line type
- you will be limited only by the total number of bars in history (n) +/- 1 full screen of empty bars
- you can't scroll past the beginning of history - 1 empty screen and past the end of history + 1 empty screen to be able to still see the line with applied offset
- before applying a large offset, scroll back long enough to make sure you have enough history loaded
- if you have a long history the indicator will get slower, its UI less responsive. Reloading the page may fix that.
- you will not see source's history past the beginning of the current asset - open the chart with the longest history first (i.e. BLX, not COINBASE)
- Make sure that the Left Price Scale shows up with Auto Fit Data enabled. You can reattach the indicator to a different scale in Style.
- you may not be able to plot intraday TFs < current TF, because free accounts are limited to TFs >= D1 (i.e. D, 2D, 3D, W), but you can still plot, say, H4+ on a lower TF H1 chart
1. uses plot*, security, change

Volume CandlesHello traders!
Well, I was trying to implement EquiVolume Charts that were developed by Richard W. Arms, but unfortunately I got a poor result.
Instead, I used my groundwork on EquiVolumes to create Volume Candles indicator to help you make better, smarter trades.
What are the cool features?
Excellently filters the instrument's movements
Gives a better view of the accumulation/distribution phases
Completely removes price gaps
Works on ANY instrument that has available volume data.
Personally, I am a big fan of the volume-based indicators and to clarify my position I cite the following words of Buff Pelz Dormeier from his book "Investing with Volume Analysis: Identify, Follow, and Profit from Trends" :
A trade produces only two pieces of information: the price and price's neglected sibling, volume. Perhaps the least appreciated piece of the puzzle, volume represents fertile ground for technical analysis. Proficiency in volume analysis is a rare skill. Properly understood, though, volume analysis can provide its practitioner with the power to peer deeply into market mechanics.
Benjamin Graham, the father of value investing and a mentor of Warren Buffett, often called the market a 'voting machine'. If so, then volume is the ballot box. Volume is a literal illustration of the power behind the forces of supply and demand.
Volume is understood as the validation of price, the source of liquidity, the substantiation of information, the fulfillment of convictions, the revelation of divergent opinions, the fuel of the market, the proponent of truth, and the energy behind the velocity of money. If you believe any of this information might be important in making an investment decision, volume analysis is important to you.
I attached some screenshots to show you how it works with other instruments.
Happy Trading!
MTF candles by yatrader2Get higher time frame candles overlaid on a lower timeframe chart.
Add 1H candles on 1M or 1D on 30M
Overlaid candles feature wicks and multiple display options to customize appearance.
Add the indicator multiple times to get MTF (multiple time frames) all on one chart.

RSI with Highlights and DivergencesThis script is an RSI replacement, useful especially for Day traders (15m or less) but can be used as a normal RSI by changing the settings to 14 / 70 / 30
Features:
- RSI with adjusted settings for lower time frames
- highlight when RSI and price diverge when RSI is at extremes
- highlight of the Overbought and Oversold conditions
- 50% line
- candle colors for Overbought and Oversold conditions

Smoothed Candles ProIt is a graphical indicator used to identify trends and pullbacks. Through it, it is possible to eliminate the noises and clearly see the smoothed pattern.
How should I use it ? This is just a example to be used with this indicator.
Let's assume that we are looking for sell opportunities.
step 1: identify some (at least 3) positives (green) candles with a good volume , excluding consolidation regions.
step 2: wait for negative (red) candles with a good volume and also all previous candles must be by majority green.
step 3: wait for pullback with high volume or consolidation region to close the position.
AUDUSD
The example can be better described in the image below:
EURUSD
Another example os use, displayed in the image below:
EURJPY
Look how makes it easy to identify tops and bottoms.
BTCUSD
Very easy to indetify trends:
GBPUSD
Very easy to indetify pullbacks:
It can be used with almost of pairs!
Send me a private msg to get the script!
You can purchase the script here:
perfect-cat-87.localtunnel.me

Librehash Heikin ScalpsThe ZN Heikin Candle Signals is a special indicator that is designed to do two things:
1. Provide all 'new' candles for you.
2. Provide entries and exits.
The purpose of this indicator is to provide a different set of candles that will allow you to see trends in the price data easier by smoothing it over and providing a slightly modified Heikin Ashi candle formula (no, it is not equivalent to the Heikin Ashi formula; i.e., the OHLC/4 for the opening that it commonly uses)
The indicator is fairly straightforward in its design as well, so this description will remain brief for the time being.
Essentially, what we did is create our own candle system. Then we installed buy and sell signals on those candles in order to give users super tight entries and exits.
Simple put, this is a must-have in any trading suite. These candles are not exact replicas of the Heikin Ashi, but rather a clever modification that allows for easier trend reading whilst still allowing you to exit at the tippy top or enter at the very bottom of a trend per the actual prices on the chart.
Here’s one major example:
Here we can see the indicator calling a sell before a major fall and not re-calling it until the precipitous negative price action completely exhausts itself.
Additional Notes
For some charts and time frames, you may need to tinker with the metrics in the control panel slightly (i.e., change the period and also the 'fastener' settings ever so slightly). Make sure to backtest after any and all changes that you make in the control panel and understand that different settings work better in different situations for different coins if you're looking to absolutely optimize this indicator for it to perform its best.
This is not necessary, but something that you all may find helpful as you're trading.
If you have purchased this indicator and you have any additional questions/concerns, please do not hesitate to reach out to me through here or via my other channels I have specified (TradingView does not allow me to post links; you know how to reach me).
Also, if you are interested in purchasing and have not done so yet, please reach out at your earliest convenience.
Thank you.

Real Candles with Support & Resistance by Emiliano Mesa Public VReal time support & resistance levels with something I like to call real candles. This is a complex overlay indicator which uses several algo's to calculate a real support and resistance level.
(To be honest I wasn't even going to release it to the public, so please do leave positive feedback... This indicator has over 100 lines and took me several hours of hard work. So I do appreciate your support <3 )
Features:
- Real Candles (Evaluates price action and gives each candle a different color based on how bullish or bearish they are)
- Adaptive S/R levels (This are real time support & resistance levels found with algo's, they are most likely to be respected again)
- Confirmed S/R levels with Experimental EMA (Are more likely to be respected than adaptive S/R due to a confirmation by Experimental EMA & KC)
-Squeeze Bars (Fuchsia colored bars which indicate a squeeze in the market)
-Trend Lines (Work in progress, if you have functioning trend lines I do appreciate any feedback on how to work them out. Not in public version)
Key:
Real Candles:
1) Green : Bullish
2) Red : Bearish
3) Lime : Strong Bullish
4) Black : Strong Bearish
S/R:
1) Green: Support
2) Red: Resistance
3) Orange: Previous S/R levels
4) Blue: Confirmed level of S/R
Squeeze:
1) Fuchsia: Squeeze
DiNapoli Color CandlesDiNapoli Candles is a new indicator that colors the price candles to indicate Bullish and Bearish Cycles.
This version of the indicator includes the following features :
Show/Hide Colored Candles
Show/Hide Black & White Candles
Colors are customizable
Blue Candle signals New Bull Cycle
Bright Green Candle signals Strenght in Bull Push
Dark Green Candle signals Weakness in Bull Push
Pink Candle signals New Bear Cycle
Bright Red Candle signals Strenght in Bear Push
Pale Red Candle signals Weakness in Bear Push
For convenience it also includes Custom Alerts . Now it is possible to get alerts on:
Signal DiNapoli Cycle Shift
New DiNapoli Bull Cycle
New DiNapoli Bear Cycle
Signal DiNapoli Cycle Strength
DiNapoli Bull Cycle Strength
DiNapoli Bear Cycle Strength
Signal DiNapoli Cycle Weakness
DiNapoli Bull Cycle Weakness
DiNapoli Bear Cycle Weakness
This indicator is meant to be used by professional traders.
If you would like to subscribe , please send me a private message.

Institucional VolumeAccording to Anna Colling, we should analyze the spreads together with the volume "VSA", the work in this script was to make the study of the volume of visual form, in this way we focus only on the candle spread, since the volume is represented by colors and their respective activities
Red Candles = Ultra High Volume
Orange Candles = Very Hight Volume
Candles Yellow = Volume Hight
White Candles = normal volume
Aqua Candle = Low Volume
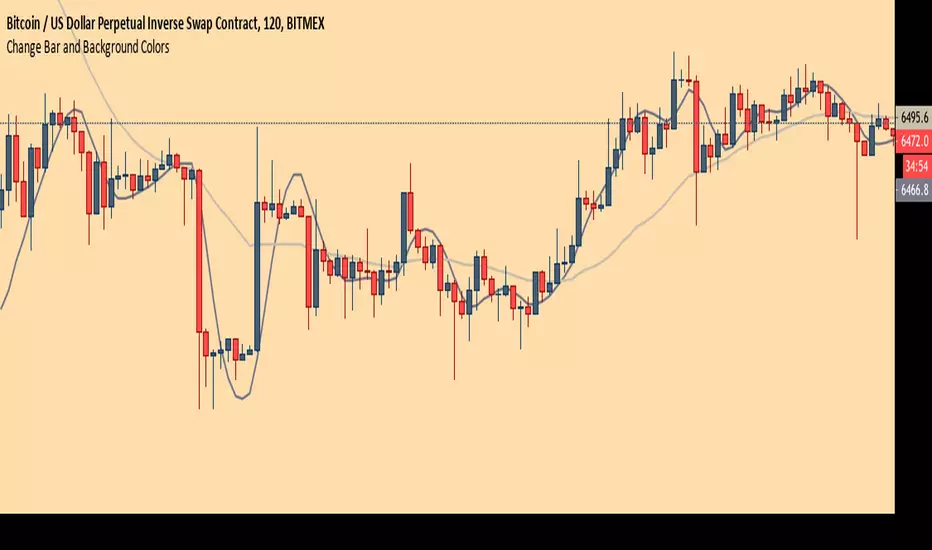
Chart Theme - Change Bar and Background Colors using HEX #sAdds aesthetic ability to charts by allowing the trader to change the color of the bars, background, and plots using HEX colors, rather than TradingView's limited color selector box. This makes for easy application of color palettes to charts. The color palettes can be saved as indicators and applied quickly, as desired.

Strength Candles With GapCode written by Krishna Khanna on 20/11/2017 includes the following components for NimblrTA
1) Logic for detection of strength candles, only displayed candles are of strength (BH>50%CH)
2) Wicks are not considered
3) Any Gaps are indicated with a arrow, can detect gapup and gapdown
This indicator is apt for small screen devices

Bull/Bear CandleThis script will display a small triangle under the latest two candles to indicate whether that candle is bullish or bearish based on the following definition.
A bullish candle closes in the top portion of the trading range of the candle while a bearish candle closes in the bottom portion of the trading range of the candle.
The cutoff is currently set at 65% (you can adjust it) so the close must be outside or equal to 65% of the trading range to be considered bullish or bearish. If less than 65% the triangle will indicate a neutral candle.
Colours are;
green triangle = bullish candle
red triangle = bearish candle
yellow triangle = neutral candle
I hope this helps those using TraderCobb's cradle strategy.
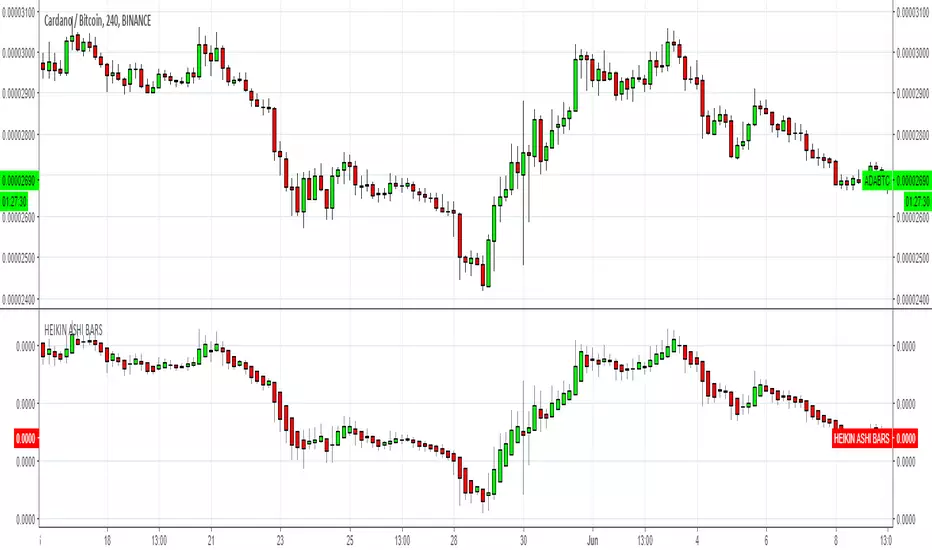
HEIKIN ASHI BARSSimple Heikin Ashi candlebars
Please consider a tip if you find this useful
BTC: 3FiBnveHo3YW6DSiPEmoCFCyCnsrWS3JBR
ETH: 0xac290B4A721f5ef75b0971F1102e01E1942A4578
Overbought Oversold CandlesA simple script that indicates the overbought and oversold area of the rsi by coloring the candlesticks
