Buy / Sell alert indicator [Crypto_BCT]Hello everyone!
I bring to your attention a indicator to determine the point of buy and sell purchase.
It is based on oscillators and a moving average.
It can be used to work with bots, for example 3COMMAS DCA bot.
Signal Condition Settings:
ATR
The current candle is larger than the ATR for this period
EMA
The signal is necessarily below (for buy) and above (for sell) the EMA of the specified period
(Buy) RSI low
The RSI index is below this value
(Sell) RSI High
The RSI index is higher than this value
(Buy) MFI low
The MFI index is below this value
(Sell) MFI High
The MFI index is higher than this value
(Buy) CCI low
CCI index is below this value
(Sell) CCI High
The CCI index is higher than this value
(Buy) Lowest bar from
The closing of the current bar is lower than the closing of the bars back in this range
(Sell) Highest bar from
The closing of the current bar is higher than the closing of bars in this range
(Buy) Lowest EMA bar ago
During a given distance back, the EMA value only decreased
(Sell) Highest EMA bar ago
At a given distance back, the EMA value only increased
I hope it will be useful!
Buysignal

Buy alert [Crypto_BCT]Hello everyone!
I bring to your attention a simple indicator to determine the point of purchase.
It is based on oscillators and a moving average.
It can be used to work with bots, for example 3COMMAS DCA bot.
Signal Condition Settings:
ATR
The current candle is larger than the ATR for this period
EMA
The signal is necessarily below the EMA of the specified period
MFI low
The MFI index is below this value
CCI low
CCI index is below this value
RSI low
The RSI index is below this value
Lowest bar from
The closing of the current bar is lower than the closing of the bars back in this range
Lowest EMA bar ago
During a given distance back, the EMA value only decreased
I hope it will be useful!

Automated Bitcoin (BTC) Investment Strategy from Wunderbit Automated Bitcoin (BTC) Investment Strategy from Wunderbit Trading
This strategy is designed for the automated long-term investment in Bitcoin. The BTC investment strategy is primarily suitable for long-term investors who want to increase the percentage of their investments through timely trading long-term transactions. The main feature is the difference from the indicator of long-term investment. Based on their statistics, this figure is 2 times less. That is, if we just bought Bitcoin and held it, we would receive 2 times less than if we applied the BTC Investment strategy.
This strategy uses the intersection of the triple exponential moving average and the least squares moving average. We also control the profit you will make during an uptrend by implementing a trailing stop based on the ATR indicator.
This is a spot market-only strategy and can be used primarily for long-term investors. The strategy is designed to create an automatic version of investing using a webhook.
Automation allows you to safely ignore the state of your portfolio and exclude emotions.
In order to create a cryptocurrency bot for this strategy, you need to:
1. Create alerts and link the URL to the webhook.
2. Connect the TradingView strategy with automated trading service.

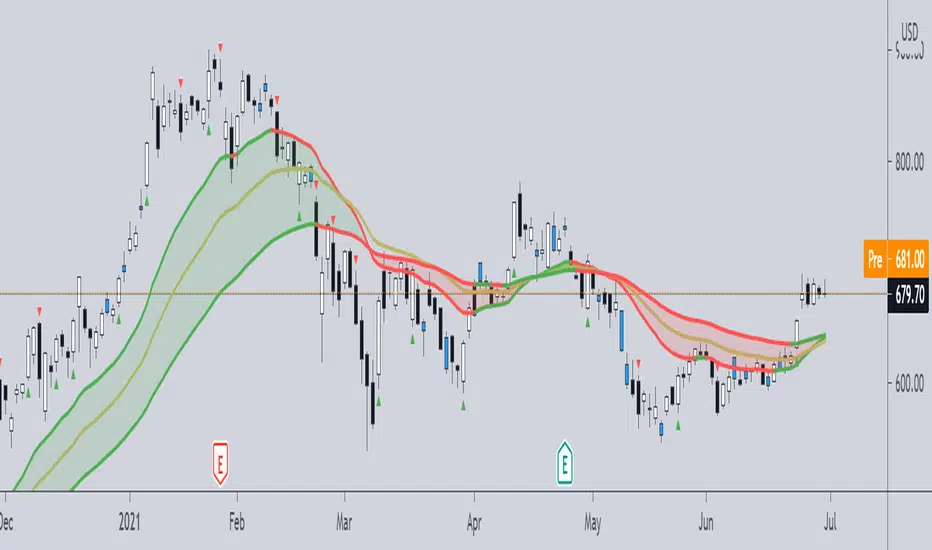
Long Term Buy/Sell Signal by BonyThis script attempts to use Exponential Moving averages (short-term and long-term convergence) of different lengths in order to identify trade entries and exits for bullish & bearish trades. I would strongly recommend using this as a guide to enter or exit long-term swing trades on growth names such as Apple, Tesla, Microsoft to keep your emotions out of the trading. You use this script by entering a trade when it signals a green BUY signal with a UP arrow and exiting when it signals red. The general idea is that one is fast and one is slow-moving EMA and these indicate when to buy/sell when they crossover the overbought/sold lines.
Disclaimer:
This script is for educational purposes only. The market is always moving up or down, so always trade with caution and use your best judgment for every trade.

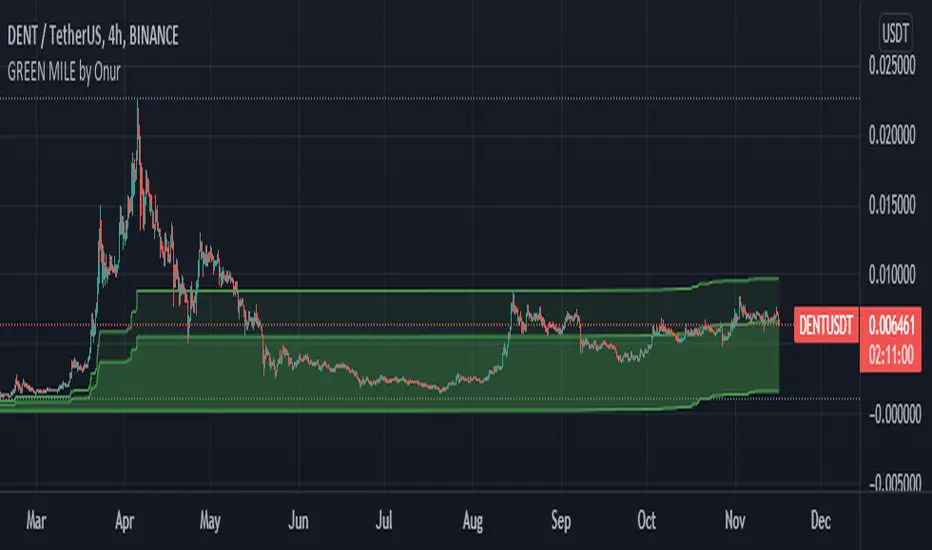
GREEN MILE by Onur This indicator shows fibonacci buying levels due to the past 1500 (adjustable) candles. Prices in the dark green area is a strong buying signal.
more effective with 15m and 240m.
The DD investThe script tells me when to invest in the stock.
Split ur money into 3 piles. Each must be bigger than the previous one.
Buy with the first pile when the chart touches the middle line (SMA200).
Buy with the second pile when the chart touches the bottom line (lowest price of 200 weeks).
Buy with the third pile when the chart goes significantly below the bottom line (lowest price of 200 weeks).
Watch only the W1 chart (!!!).
Circles on the chart indicate places where you should buy (examples).
Consider selling half of the holding when the chart touches the top line (the highest price of 200 weeks).
Hold the rest much longer then you plan to ;)

Roberts Pi Cycle Top and Bottom Indicator BTCIndicator Overview
The Pi Cycle Top Indicator has historically been effective in picking out the timing of market cycle highs to within 3 days.
It uses the 111 day moving average (111DMA) and a newly created multiple of the 350 day moving average, the 350DMA x 2.
This updated indicator is based on the original x2 Daily Simple Moving Average Pi Cycle Top Indicator for BTCUSD but with the addition of a 3rd 350 SMA
Standard Pi Cycle SMA = 350*2 SMA + 111 SMA
Updated Pi Cycle SMA = 350*2 SMA + 111 SMA + 350 SMA
How It Can Be Used / How to Read:
Chart should be used on BTCUSD only
Chart should be set to Daily Timeframe only
Buy signal RED SMA crosses up over WHITE SMA
Sell Signal RED SMA crosses up over GREEN SMA (a vetical yellow line will indicate the cycle top)

TradingGroundhog - Strategy & Fractal V1#-- Public Strategy - No Repaint - Fractals -- Short term
Here I come with another script, more simple than Wavetrend V1. You will love it.
#-- Synopsis --
Another simple idea, on a small time frame (15 min) we buy when the opening price goes below a Bottom fractals and sell when it goes over a Top fractals, but as this script do not use Wavetrends. You should stop by your self to use the script during long lasting downtrends.
I developed the strategy using BTC /EUR 3 MIN BINANCE but it can be applied to many other cryptos, I don't know for forex or others. You can use it for short term (to a month of uptrend) and automated trading.
#-- Graph reading --
And now, how to read it ?
Fractals:
Yellow Flags occur when the opening price goes below a Bottom fractal , it means Buy.
White Flags appear when the opening price goes over a Top fractal , it means Sell.
#-- Parameters --
*** Parameters have been intensively optimized using 10 cryptocurrency markets in order to have potent efficiency for each of them. I would recommend to only change the Can Be touch parameter. For the others, I don't recommend any modifications. The idea behind the script is to be able to switch between markets without having to optimize parameters, less work, easy to target active crypto and therefor limit the risks. ***
Can be touch :
'Filter fractals' : Activate or Disable the filtering fractal operation. If Enable, buy during less risky periods. (Activate is often better)
Can be touch but not necessary :
'VolumeMA' : The Volume corrector used by the fractals
'Extreme window' : The number of price individuals to look for if we want to remove extreme fractals.
Not to touch :
'Long Sop Loss (%)' : The minimal difference of price between a Fractal bottom and the opening price to buy.
#-- Time frame --
Should be used with the following time frames depending on the necessity:
1 MIN
3 MIN (Preferred with the parameters set)
5 MIN
#-- Last words --
The script can be set up to send Tradingview signals to 3comma just by adding comment = " " in strategy.close_all() and strategy.entry().
Good trades !
Disclaimer (As it should always be one to any script)
***
This script is intended for and only to be used for personal purposes only. No such information provided by it constitutes advice or a recommendation for any investment or trading strategy for any specific person. There is no guarantee presented or implied as to the accuracy of specific forecasts, projections, or predictive statements offered by the script. Users of the script agree that its original developer does not take responsibility for any of your investment decisions. Please seek professional advice before trading.
***
# Here are the results from the 20rst of September 2021 with 100% of equity on the BTC /EUR 3 Min and with a capital of 10 000 EUR. So almost, one month.
# As I saw, it goes from +30% to more than +160% (the great SHIB) depending on the selected crypto. It may be negative if you spot a downtrend.

TradingGroundhog - Strategy & Wavetrend V2#-- Public Strategy - No Repaint - Fractals - Wavetrend --
Here I come with another script, a nice and simple strategy based on fractals and Wavetrends.
#-- Synopsis --
A simple idea, on a small time frame (15 min) we buy when the opening price goes below a Bottom fractals and sell when it goes over a Top fractals, but in order to avoid bad and evil downtrends, we use Wavetrends based on a Daily time frame. From it, Tops and Bottoms are extracted. If the opening price goes above Wavetrend Tops, no trades will be conducted during the day. If the price goes below Wavetrend bottoms, no trades will be executed from 1 to N days, until a new Wavetrend bottom is generated.
I developed the strategy using BTC /EUR 15 MIN BINANCE but it can be applied to many other cryptos, I don't know for forex or others. You can use it for long term and automated trading, I implemented the Wavetrend indicator to do so, or for short term if you have spot a long coming uptrend. Test it, look at its profit and long or short period on your crypto of choice.
#-- Graph reading --
And now, how to read it ?
Wavetrends:
Red Backgrounds are associated to No Trade periods. These periods occur when the price goes below a Wavetrend bottom or above a Wavetrend Top. They are here to limit the loss.
Blue Gradient lines represent the past Tops. For each bar, only the increasing values of the Wavetrend tops are acquired. Going from light to dark blue based on the age of the Tops. Thus, if on line goes from dark to light, this means the price is approaching a previous Wavetrend top. In the opposite, if it darken, thus the price say 'buy buy' and go dropping.
Yellow Gradient lines represent the past Bottoms. They are based on the same principe that the blue lines.
Fractals:
Yellow Flags occur when the opening price goes below a Bottom fractal , it means Buy.
White Flags appear when the opening price goes over a Top fractal , it means Sell.
#-- Parameters --
*** Parameters have been intensively optimized using 10 cryptocurrency markets in order to have potent efficiency for each of them. I would recommend to only change the Can Be touch parameter. For the others, I don't recommend any modifications. The idea behind the script is to be able to switch between markets without having to optimize parameters, less work, easy to target active crypto and therefor limit the risks. ***
Can be touch :
'Combined Smoothness' : The number of open individuals used by the Wavetrend. (6 or 9, often 9 is better but with less volatile crypto it will be 6)
'Filter fractals' : Activate or Disable the filtering fractal operation. If Enable, buy during less risky periods. (Disable is often better)
Can be touch but not necessary :
'VolumeMA' : The Volume corrector used by the fractals
'Extreme window' : The number of price individuals to look for if we want to remove extreme fractals.
Not to touch :
'Limit_candle to look on' : Number of candles to use to compute the Wavetrend Tops and Bottoms.
'Length top bottom drawn' : Size of the lines
'Long Sop Loss (%)' : The minimal difference of price between a Fractal bottom and the opening price to buy.
#-- Time frame --
Should be used with the following time frames depending on the necessity:
1 MIN
3 MIN (Interesting for short term profit, may need some parameter ajustements)
5 MIN
15 MIN (Preferred for long term profit, the script was developed on it)
#-- Last words --
The script can be set up to send Tradingview signals to 3comma just by adding comment = " " in strategy.close_all() and strategy.entry().
Good trades !
Disclaimer (As it should always be one to any script)
***
This script is intended for and only to be used for personal purposes only. No such information provided by it constitutes advice or a recommendation for any investment or trading strategy for any specific person. There is no guarantee presented or implied as to the accuracy of specific forecasts, projections, or predictive statements offered by the script. Users of the script agree that its original developer does not take responsibility for any of your investment decisions. Please seek professional advice before trading.
***
# Here are the results from the 1rst of July 2021 with 100% of equity on the BTC /EUR 15 Min and with a capital of 1 000 EUR.
# As I saw, it goes from +20% to more than +100% depending on the selected crypto. Sometimes it's negative but it's quite rare on crypto using the EUR.

Scalping EMA ADX RSI with Buy/Sell AlertsThis is a study indicator that shows the entries in the strategy seen in one of the youtube channel so it does not belong to me. I can't tell who it is because it's against the House Rules to advertise but you can find out if you look for it on youtube. Default values of oscilators and ema adjusted as suggested. He says he got the best results in 5 min timeframe but i tried to make things as modifiable as possible so you can mess around with the settings and create your own strategy for different timeframes if you'd like. Suggested to use with normal candlestick charts. The blue line below indicates the ADX is above the selected threshold set in the settings named "Trend Ready Limit". You can set alerts for Buy, Sell or Buy/Sell signal together.
The entry strategy itself is pretty straight forward.
The rules for entry are as follows, the script will check all of this on auto and will give you buy or sell signal :
Recommended time frame: 5 min
For Long Entry:
- Check if price above the set EMA (Can disable this rule if you'd like in the settings)
- RSI is in Oversold
- ADX is above set "Trend Ready" threshold (Meaning there is a trend going on)
- Price must approve the trend of previous candles. This is bullish for buy entries and bearish for sell entries.
- Enter with stop loss below last swing low with 1:1 or 1.5:1 take profit ratio.
For Short Entry:
- Check if price below the set EMA (Can disable this rule if you'd like in the settings)
- RSI is in Overbought
- ADX is above set "Trend Ready" threshold (Meaning there is a trend going on)
- Price must approve the trend of previous candles. This is bullish for buy entries and bearish for sell entries.
- Enter with stop loss above last swing high with 1:1 or 1.5:1 take profit ratio.
This is my first indicator. Let me know if you want any updates. I am not sure if i can add everything but i'll try nonetheless.
Changed: Signals will check up to 2 candles before if the RSI is below or above the set value to show signal. This is because sometimes the entry signal is right but the response might be a bit late.

[DS]Bitcoin BTC ETH and others cryptos==DESCRIPTION - English version
The purpose of this script is to show information on graph that can help your decision to buy and sell cryptos.
The script is indicated for Position Trade (Long Term - Holder) and Swing Trade (Medium term).
Position Trade it is recommended to use the Weekly (W) and Daily (D) charts, Swing trade to use the 4H and 2H charts.
It is not advisable to use this indicator with graphic time frame less than 2 hours because the noise levels of information are very high.
An alert function has been inserted in the indicator and to activate this function you will need configure it in the Tradingview.
This alert will indicate the likely points of entry and exit of the asset.
**DESCRIÇÃO - Versão em Português
A proposta deste script é mostrar no gráfico informações que possam auxiliar a sua decisão de compra e venda de cryptos.
Este script é indicado para negociação Position Trade (Longo Prazo - Holders) e Swing Trade (Médio prazo).
Para Position Trade (Holders) é indicado utilizar os gráficos Semanal (W) e Diário (D), para Swing trade utilizar os gráficos 4H e 2H.
Não é aconselhável utilizar este indicador com tempos gráficos menores que 2hs pois os níveis de ruídos nas informação são muito altos.
Foi inserido no indicador uma função de alerta e para ativar esta função, você precisará configurá-la no seu Tradingview.
Este alerta irá indicar os provaveis pontos de entrada e saída do ativo.
====================================================================================================
** English Version
====================================================================================================
█ SETUP applied to Indicator
The setup is based on the average 8, 21 and 56 of the weekly chart (taught on youtube channel: Augusto Backes)
Price above the average 8 on the weekly, indicates that the market is UP trend, below the average 8 on the weekly that the market is DOWN trend
RSI greater than 60% the market is UP trend
RSI greater than 40% and lower 60% the market is in ACCUMULATION
RSI less than 40% the market DOWN trend
The weekly average 8 is represented in GREEN (Upward Trend) and RED (Downward Trend).
The weekly average 21 is represented in LIGHT ORANGE
The weekly average 56 is represented in LIGHT PURPLE
The crossing of weekly averages 8 and 21 is represented with a GREEN (HIGH trend) and RED (LOW trend) cross - this signal is disabled on the graph but you can enable it by clicking on the graph setup
█ FUNCTION USE
(1) Average 8, 21 and 56 on Weekly - show the average 8, 21, 56 weekly on graphic (Average 8 in color red and green, 21 - light orange, 56 light purple)
(2) Crossing of averages 8 and 21 Weekly - is not active but you can activate
(3) Calculation of RSI
(4) barcolor() - mark the candles with the green color (High market) and red color (Dow market)
(5) alertcondition() - you can active this alert on Tadingview
█ BUY AND SELL POINTS - likely points
The indication of the BUY position is shown by a green arrow pointing upwards and the sell position by a red arrow pointing downwards. Buy and sell indications are obtained from the divergence in the market trend.
█ THANK TO
PineCoders for everything they do, all the tools and help they provide, and their involvement in making a better community. All PineCoders, Pine Pros and Pine Wizards, people who share their work and knowledge because of it and helping others, I am so happy and so grateful.
█ NOTE
This indicator is not a buy and sell recommendation, it indicates the most likely buy and sell points. Every purchase and sale decision is your responsibility
*****************************************************************************************************
** Versão em Português
*****************************************************************************************************
█ SETUP aplicado no Indicador
O setup está baseado na média 8, 21, e 56 do gráfico semanal
Preço acima da média 8 no semanal indica que o mercado esta em tendência de ALTA, abaixo da média 8 no semanal que o mercado está em tendência de BAIXA
RSI maior que 60% o mercado está em ALTA
RSI maior que 40% e menor 60% o mercado está em ACUMULAÇÃO
RSI menor que 40% o mercado está em BAIXA
A média 8 semanal está representadas nas cores VERDE (Tendência de Alta) e VERMELHA (Tendência de Baixa).
A média 21 semanal está representada na cor laranja claro
A média 56 semanal está representada na cor roxa claro
O cruzamento das médias 8 e 21 semanal esta representado com uma cruz VERDE (Tendência de ALTA) e VERMELHA (Tendência de BAIXA) - este sinal esta desativado no gráfico mas você pode ativá-lo clicando no setup do gráfico
█ FUNÇÕES UTILIZADAS
(1) Média 8, 21 e 56 no Semanal - mostra a média 8, 21, e 56 no gráfico
(2) Cruzamento das médias 8 e 21 Semanal - não está ativo mas você pode ativá-lo
(3) Cálculo do RSI
(4) barcolor() - marca a vela (Candle) com a cor verde (Mercado em Alta) e a cor vermelha (Mercado em Baixa)
(5) alertcondition () - você pode ativar o alerta no Tradingview
█ PONTOS DE COMPRA E VENDA - prováveis pontos
A indicação da posição de COMPRA é apresentada por uma seta na cor verde apontada para cima e a posição de VENDA por uma seta na cor vermelha apontada para baixo. As indicações de compra e venda são obtidas a partir da divergência na tendência do mercado.
█ OBRIGADO PARA
PineCoders por tudo o que fazem, todas as ferramentas e ajuda que fornecem, e seu envolvimento em fazer uma comunidade melhor. Todos os PineCoders, Pine Pros e Pine Wizards, pessoas que compartilham seu trabalho e conhecimento por causa dele e ajudando os outros, estou muito feliz e muito grato.
█ NOTA
Este indicador não é uma recomendação de compra e venda ele indica os pontos mais prováveis de compra e venda. Toda decisão de compra e venda é de sua responsabilidade

Williams Fractals StrategyThis indicator made with using Williams Fractals, 20 50 100 Moving Averages and Relative Strength Index. You can easily find entry points by using Long (L), Short (S) signals.
Note : Settings are optimized for BTC:USDT Perpetual 15min TF. For use different pairs or TFs you may need to change settings.

Multi-timeframe MAs + Stoch RSI SignalsHello traders,
I welcome you to my first published script on TradingView: “Multi-timeframe Moving Averages + Stochastic RSI”.
The script is based on a simple formula: Buy signals are generated when a fast moving average is above a slower moving average (uptrend) and the Stochastic RSI K line is crossing above the oversold level (entry).
Sell signals are generated when a fast moving average is below a slower moving average (downtrend) and the Stochastic RSI K line is crossing below the overbought level (entry).
This indicator works best in strong trends!
**Please note the above example has repainting turned on which may produce unrealistic results when viewing historical data. See below for more information regarding this and how you can turn it off.**
The user has the following inputs:
- Option to change the Stochastic RSI settings, including the oversold and overbought levels.
- Option to enter any value for both the Fast Moving Average and the Slow Moving Average.
- Option to change between EMA or SMA for each moving average.
- Multiple time frames to choose from, as well as the ability to selectively turn off individual time frames (both plots and alerts).
(Default time frames are 1 hour, 4 hour, and Daily. You can have a 4th time frame by changing your current time frame to something lower than the other 3 time frames)
- Turn on/off repainting: If repainting is turned on you will get an alert and buy/sell signal on chart immediately when condition is met, however the signal may disappear from chart if the condition reverses during the same candle.
If repainting is turned off, the indicator will wait for the candle to close before issuing the alert and painting the signal on chart.
For higher time frames, the indicator will wait for the candle in the higher time frame to close before issuing a signal if repaint is turned off. Default is set to Repaint on, so please be aware of this if you do not want repainting.
How to use alerts:
- Before you do anything, make sure your current time frame is the lowest time frame you’d like alerts on, as you will still receive alerts for the higher time frames you selected in settings.
- Once you have all the settings changed to how you like, save your chart first. Then right click on any of the indicator’s buy/sell signals on the chart and click “Add Alert on MAs + Stoch RSI”.
- Make sure “Any alert() function call” is selected under the Condition.
- You can delete or change the text in “Alert name” if you want as the alert message is already built into the indicator, and it will tell you in the alert message which asset and time frame to buy or sell.
Other things to note:
- The indicator will not display the buy/sell signals of lower time frames when you are on a higher time frame. This was done purposely to reduce clutter on the chart when you switch to higher time frames.
- While the alert message will tell you which time frame a signal was generated, the plots on the chart will instead show “Buy/Sell TF1, or TF2, or TF3”.
If the signal is from the current time frame that the alert was created on, then it will simply show “Buy” or “Sell”.
Hope you guys enjoy using this one, please drop a like if you found it useful. If anyone wants to modify my script in any way, please just credit me for the original work when you publish the script. Good luck!

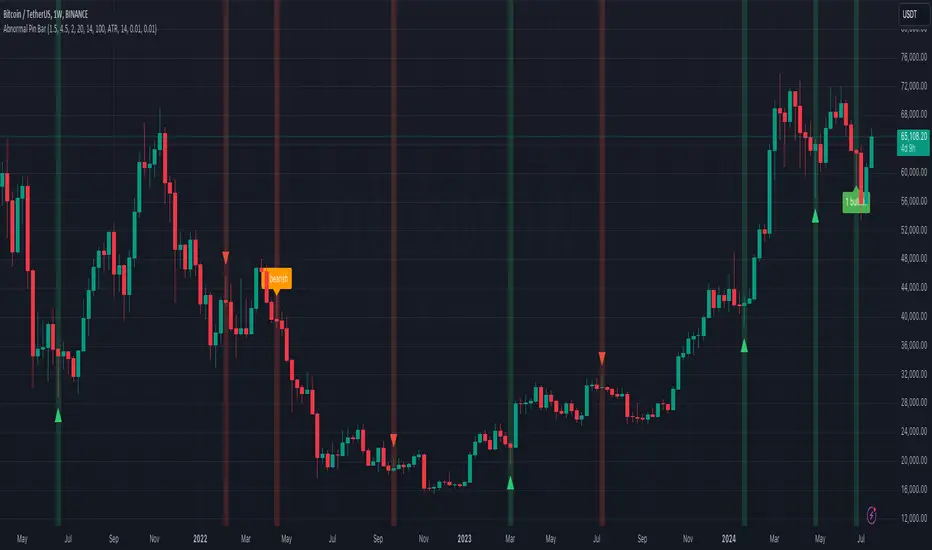
Abnormal Pin BarPin Bar is one of the most important candlestick patterns. Almost every time you see a pin bar, you can expect the price to turn in the opposite direction.
You should pay more attention to the abnormal ones among the pin bars. What I mean by abnormal pin bar is that the long leg is at least 3 times larger than the body.
With this indicator, you can set your own abnormal pin bar settings. The indicator will highlight abnormal pin bars according to the settings you specified.
The indicator uses the following three factors to indicate abnormal pin bar:
- Minimum body ratio in the pattern in percent
- Minimum ratio of the long shadow to the body
- Minimum ratio of the long shadow to the short shadow
Also, there is a volume strength check to confirm the pin bar. If the volume where the pin bar is formed is greater than the 20 volume average, it indicates that the pin bar is more important. Of course, confirming the pin bar with the volume is optional and you can disable it in settings if you wish.
You can use the highlights of this indicator as an entry signal if the pin bar appears at the trend key levels or in support or resistance zones.
Pivot Boss -- Squat bars and Non Squat Bars 2.0Squat Bar Signal -- current Volume is greater than previous volume but Current bar MFI(Market Facilitation index) is lesser than previous bar MFI
Other Conditions -- Current Bars Range is lesser than (Average Range * Range Multiplier)
Non Squat Bar Buy Signal(Green Up Triangle) -- Volume and MFI is greater than previous bar, Close greater than open, Close is greater than midpoint
Non Squat Bar Sell Signal(Red Down Triangle) -- Volume and MFI is greater than previous bar, Close lesser than open, Close is lesser than midpoint
Usually Squat signal is confirmed by Non Squat Bar Signal..
Other indicator used -- PEMA -- Pivot based EMA
For Better results use it along with Advanced Volume indicator and PEMA

CryptoSignalScanner - MACD Multiple Time FramesDESCRIPTION:
After receiving some multiple request to provide a MACD indicator that displays multiple timeframes at the same time I created this simple script.
You can use this script for free and adjust it as much you like.
With this script you can plot 6 MACD lines & 6 Signal lines.
• Current Timeframe MACD Line
• Current Timeframe Signal Line
• 15 minute candle MACD Line
• 15 minute candle Signal Line
• 30 minute candle MACD Line
• 30 minute candle Signal Line
• 1 hour candle MACD Line
• 1 hour candle Signal Line
• 2 hour candle MACD Line
• 2 hour candle Signal Line
• 4 hour candle MACD Line
• 4 hour candle Signal Line
HOW TO USE:
• When multiple MACD lines on an uptrend are grouped together it is time to SELL.
• When multiple MACD lines on a downtrend are grouped together it is time to BUY.
• The higher to length of the MACD lines the stronger the BUY/SELL signal.
FEATURES:
• You can show/hide the preferred MACD lines.
• You can show/hide the preferred Signal lines.
How MACD works
The MACD indicator is generated by subtracting two exponential moving averages (EMAs) to create the main line (MACD line), which is then used to calculate another EMA that represents the signal line. In addition, there is the MACD histogram, which is calculated based on the differences between those two lines. The histogram, along with the other two lines, fluctuates above and below a center line, which is also known as the zero line.
The MACD indicator consists of three elements moving around the zero line:
• The MACD line. By default the MACD line is calculated by subtracting the 26-day EMA from the 12-day EMA.
MACD line = 12d EMA - 26d EMA
• The signal line. By default the signal line is calculated from a 9-day EMA of the MACD line.
Signal line = 9d EMA of MACD line
• Histogram. The histogram is nothing more than a visual record of the relative movements of the MACD line and the signal line.
It is simply calculated as: MACD line - signal line
REMARKS:
• This advice is NOT financial advice.
• We do not provide personal investment advice and we are not a qualified licensed investment advisor.
• All information found here, including any ideas, opinions, views, predictions, forecasts, commentaries, suggestions, or stock picks, expressed or implied herein, are for informational, entertainment or educational purposes only and should not be construed as personal investment advice.
• We will not and cannot be held liable for any actions you take as a result of anything you read here.
• We only provide this information to help you make a better decision.
• While the information provided is believed to be accurate, it may include errors or inaccuracies.
Good Luck,
SEOCO

No-lose trading targets (based on RSI) By Mustafa ÖZVERThis code shows expected reaction target prices after sudden moving based on RSI. Red area means the price is on overbought area, green area means the price is on oversold area. If you see red area under price, you can make short option to next to the horizontal beginning price of red area. If you see green area over price, you can make long option to next to the horizontal beginning price of green area.
When this code works
- The green area starts where rsi value is on oversold
- The red area starts where rsi value is on overbought
Of course, this code may be failed, do not forget the target may never come. But hopefully price will cross over the target.
And you (as developers) can develop this code by using anything instead of rsi to get up-down target prices.
But only this values can not guarantee good results for trading. BE CAREFUL

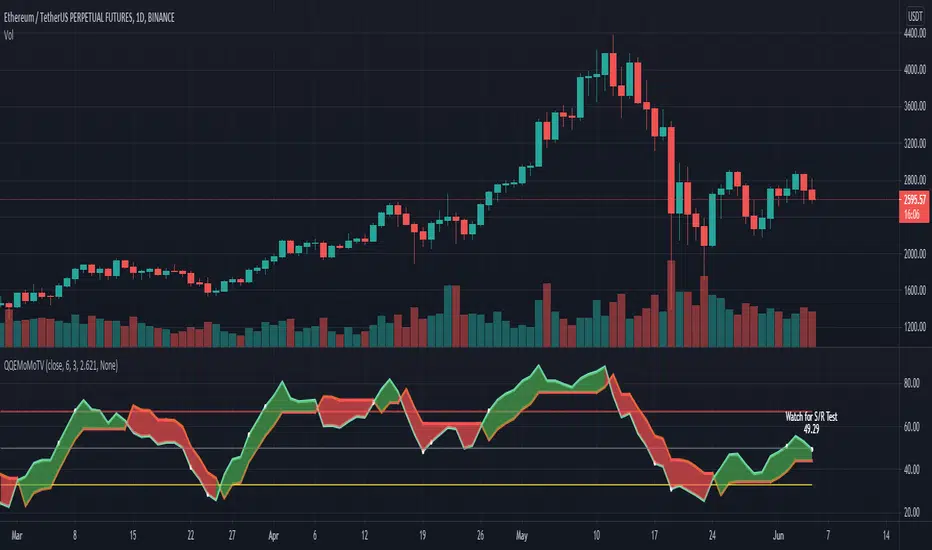
QQEMoMoTV█ OVERVIEW
This plots the QQE (Quantitive Qualitative Estimation)
with the addition of labels to show areas to watch out for and a colored cloud to show Green Upwards or Red Downwards Momentum
The QQE indicator is based on Wilder's RSI, which is based on a smoothed RSI comparing the change (delta Δ) between between bars
to compute the FastTL and SlowTL depending on the RSI Period, Slow Factor and QQE settings selected
As this works similarly to the RSI, it provides areas of overbought and oversold, and a cross at 50 for more bullish or more bearish
The FastTL and SlowTL crossovers works similarly to the crossover of a fast and slow moving average which can indicate bullish or bearish
When the SlowTL crosses above the FastTL a Green cloud indicating upwards momentum is drawn and vice versa when FastTL crosses above SlowTL
Bullish signals generated when Blue line crosses above Orange line, or Green MoMo cloud, Uptrend
Bearish signals generated when Orange line crosses above Blue line, or Red MoMo cloud, Downtrend
QQE Areas of interest:
Oversold: QQE < 33, Overbought: QQE > 67
Cross at 50: QQE crossing 50, this is an area that is between more bullish >50 and more bearish <50 zones
Note: as 50 is the switch between more bullish or more bearish zones , it is common to watch out for Support/Resistance Tests at this level
Tip: when QQE appears to be flat, this indicates a flat trend, this can commonly happen around the 50 zone when direction is relatively undecided, see the image below for an example
Very Overbought: QQE > 90, Careful! Watch out! QQE is showing very overbought and is generally a good area to take profit as others may sell soon too
QQE Fast settings: gives earlier signals, but also gives more shorter term signals
RSI_Period = 6, Slow_Factor = 3, QQE = 2.621
QQE Slow settings: gives more reliable signals, but sometimes a little late, best to use both fast and slow together for confirmation of the trend
RSI_Period = 20, Slow_Factor = 5, QQE = 4.236
You can add the QQEMoMoTV indicator to your chart twice and change one of them to the Fast settings and one of them to the Slow settings.
By comparing the QQEMoMoTV Fast and QQEMoMoTV Slow together you can get a better idea of the overall trend.
To best determine if this is a entry point or a trend reversal, it is recommended to use in conjunction with the MashumeHullTV indicator
█ FEATURES
Calculations
Calculates the change (delta Δ) between between bars based on Wilder's smoothed RSI to compute the FastTL (Orange) and SlowTL (Blue) lines
These are dependent on the QQE Fast settings or QQE Slow settings from the input RSI Period, Slow Factor and QQE selected
Labels are shown when QQE crosses areas of interest on the chart as Label text and shown with white dots on the QQEMoMoTV indicator
Inputs
You can use the script's inputs to configure:
• Calculation Source (default close)
• RSI Period (default 20)
• Slow Factor (default 5)
• QQE (default 4.236)
• Whether to show Green/Red MoMo Cloud
• Whether to show the QQE Label
• Style and Position of the QQELabel (default None)
None is selected as default to take up least space for optimal viewing when on Tradingview mobile, but you are free to change the style however you like
Alerts
Buy Signal alert based on rsi_ma crossing above FastAtrRsiTL, when Blue Line Cross above Orange Line, Green MoMo Cloud, Bullish
Sell Signal alert based on FastAtrRsiTL crossing above rsi_ma, when Orange Line Cross above Blue Line, Red MoMo Cloud, Bearish
█ CREDITS
Original Author: greyghost7
Feature upgrades and usage: Xiuying
Converted to Tradingview by: Machdragon
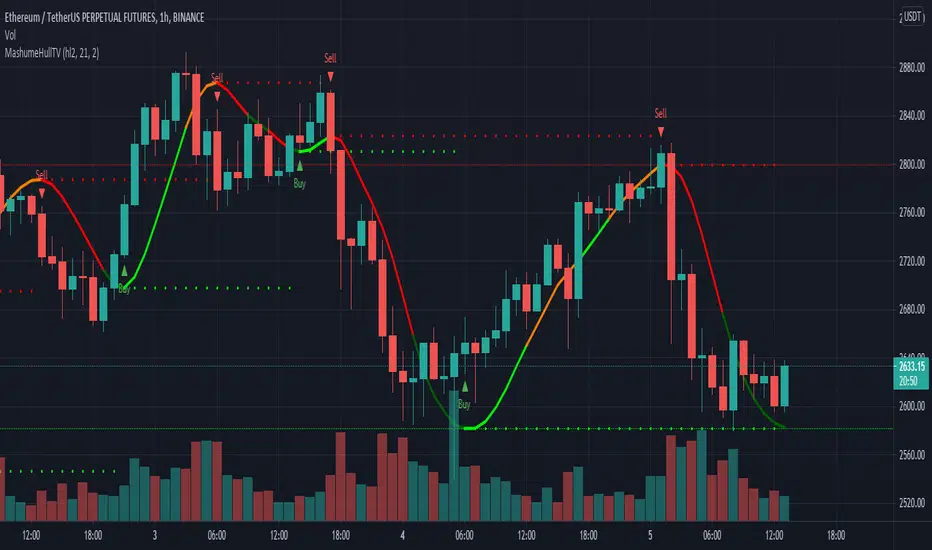
MashumeHullTV█ OVERVIEW
This plots the Hull Moving Average Turning Points and Concavity
with the addition of colored segments representing concavity and turning points: maxima, minima and inflection.
a fast way to determine the trend direction and possible reversals based on concavity of the trend
Dark Green: Concave Up but HMA decreasing. The 'mood' has changed and the declining trend of the HMA is slowing. Possible trend change to Uptrend soon
Light Green: Concave up and HMA increasing. Price is increasing, and since the curve is still concave up, it is accelerating upward. Uptrend
Orange: Concavity is now downward, and though price is still increasing, the rate has slowed, perhaps the mood has become less enthusiastic. Possible trend change to Downtrend soon
Red: Concave down and HMA decreasing. Downtrend
Buy signals generated when Hull turns from Dark Green -> Light Green
Sell signals generated when Hull turns from Orange -> Red
To best determine if this is a entry point or a trend reversal, it is recommended to use in conjunction with the QQEMoMoTV indicator
█ FEATURES
Calculations
Calculates the concavity of the Hull Moving Average comparing the Hull concavity of the current bar to the previous bar and displays the concavity in the form of 4 different colors.
Note: may cause repainting, so recommended to use with another indicator such as the QQEMoMoTV indicator to confirm signals.
Calculates divergence between the calculated HMA and the actual price and displays this in the Divergence Label.
Calculates the local minima, maxima and inflection points with the ability to display these as auto support/resistance lines.
Inputs
You can use the script's inputs to configure:
• Calculation Source (default HL2)
• HMA Length (default 21)
• Lookback (default 2)
• Whether to show Auto Support/Resist Lines
• Whether to show Buy/Sell Arrows
• Whether to show Divergence Label
• Whether to extend Local Auto Support/Resist Lines
Alerts
Buy Signal alert based on HMA crossing above MA_Min/Hull Support, when Hull turns from Dark Green -> Light Green, Bullish
Sell Signal alert based on HMA crossing below MA_Max/Hull Resistance, when Hull turns from Orange -> Red, Bearish
Experimental support for applying the indicator to higher time frames
eg. charting the hourly MashumeHull indicator on 15 min chart. See the commented code to access this feature
█ CREDITS
Original Author: Seth Urion (Mashume)
Feature upgrades and usage: Xiuying
Converted to Tradingview by: Machdragon
[GJ]IFRSITHE INVERSE FISHER TRANSFORM STOCH RSI
HOW IT WORKS
This indicator uses the inverse fisher transform on the stoch RSI for clear buying and selling signals. The stoch rsi is used to limit it in the range of 0 and 100. We subtract 50 from this to get it into the range of -50 to +50 and multiply by .1 to get it in the range of -5 to +5. We then use the 9 period weighted MA to remove some "random" trade signals before we finally use the inverse fisher transform to get the output between -1 and +1
HOW TO USE
Buy when the indicator crosses over –0.5 or crosses over +0.5 if it has not previously crossed over –0.5.
Sell when the indicator crosses under +0.5 or crosses under –0.5 if it has not previously crossed under +0.5.
We can see multiple examples of good buy and sell signals from this indicator on the attached chart for QCOM. Let me know if you have any suggestions or thoughts!

Jaws Mean Reversion [Strategy]This very simple strategy is an implementation of PJ Sutherlands' Jaws Mean reversion algorithm. It simply buys when a small moving average period (e.g. 2) is below
a longer moving average period (e.g. 5) by a certain percentage and closes when the small period average crosses over the longer moving average.
If you are going to use this, you may wish to apply this to a range of investment assets using a screener for setups, as the amount signals are low. Alternatively, you may wish to tweak the settings to provide more signals.
Context can be found here:
LINK

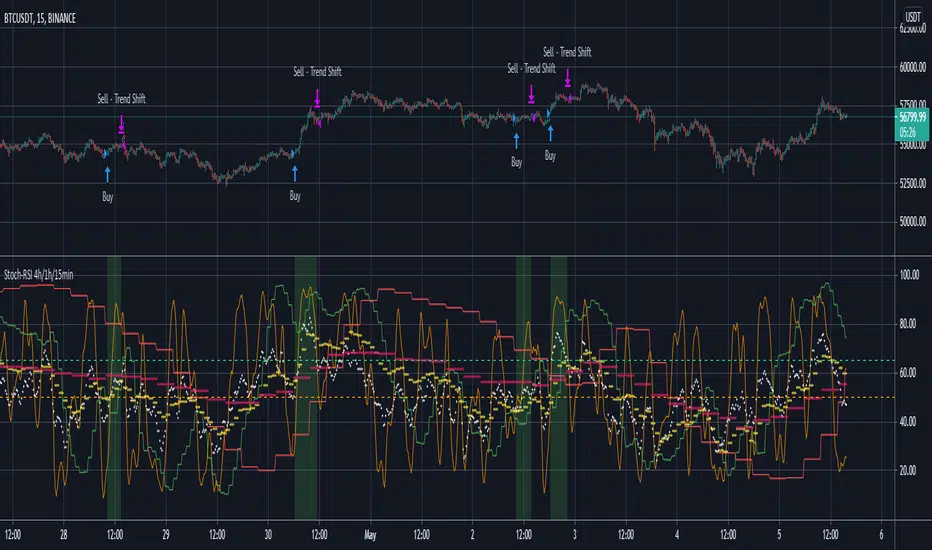
Stoch-RSI 4h/1h/15min!!!! Note: Run this on the 15min timeframe (Important) !!!!
Note the default settings on this indicator are best for BTC/USDT. For other pairs it might take some fiddling with variables to get a useful result (if a useful result is obtainable with the selected pair)
Generally, select between the options (RSI/Stoch) and (15min/1hour) and (1hour/4hours) - to find a strategy backtest result that is worth considering.
Only long positions are considered here (I tried shorts but could not get a credible backtest result with this approach).
This is an indicator which looks at RSI and StochRSI on the 15min, 1hour and 4hour timeframe.
The user can select a 15min/1hour option (RSI/Stoch) and then also a 1hour/4hour option (RSI/Stoch).
So there is one selection from a lower (15min/1hour) timeframe and another selection from a longer (1hour/4hour) timeframe.
The general idea is to, consider buying when, the lower timeframe (RSI/Stoch) is going upwards and also the longer timeframe (RSI/Stoch) is going upwards.
A good backtest result would suggest that the confluence in RSI/Stoch over the shorter and longer timeframes can estimate a good time to buy.
(Careful with a 1hour Stoch for the shorter timeframe variable as its possible to also select a 1hour Stoch for the longer timeframe variable.)
There are user set variables that can be set to avoid a buy signal, if either the lower or high timeframe variables are greater than.
For example, buying when a rsi/stoch is >65% might not be advisable as the rsi/stoch is most probably due for a downswing when above this value.
The strategy closes a position when either the shorter or longer timeframe variables no longer are going up.
There is also a take profit % which can be set to exit trades at a given %.
The default values on this indicator tool are for bitcoin, which shows a reasonable backtest result. - worth sharing on tradingview.
Please do get in touch for any additional information/suggestions.
Sincerely,
MoonFlag