Volumatic Trend [ChartPrime]
A unique trend-following indicator that blends trend logic with volume visualization, offering a dynamic view of market momentum and activity. It automatically detects trend shifts and paints volume histograms at key levels, allowing traders to easily spot strength or weakness within trends.
⯁ KEY FEATURES
Trend Detection System:
Uses a custom combination of weighted EMA (swma) and regular EMA to detect trend direction.
A diamond appears on trend shift, indicating the starting point of a new bullish or bearish phase.
Volume Histogram Zones:
At each new trend, the indicator draws two horizontal zones (top and bottom) and visualizes volume activity within that trend using dynamic histogram candles.
Gradient-Based Candle Coloring:
Candle color is blended with a gradient based on volume intensity. This helps highlight where volume spikes occurred, making it easy to identify pressure points.
Volume Summary Labels:
A label at the end of each trend zone displays two critical values:
- Delta: net volume difference between bullish and bearish bars.
- Total: overall volume accumulated during the trend.
⯁ HOW TO USE
Monitor diamond markers to identify when a new trend begins.
Use volume histogram spikes to assess if the trend is supported by strong volume or lacking participation.
A high delta with strong total volume in a trend indicates institutional support.
Compare gradient strength of candles—brighter areas represent higher-volume trading activity.
Can be used alone or combined with other confirmation tools like structure breaks, liquidity sweeps, or order blocks.
⯁ CONCLUSION
Volumatic Trend gives you more than just trend direction—it provides insight into the force behind it. With volume-graded candles and real-time histogram overlays, traders can instantly assess whether a trend is backed by conviction or fading strength. A perfect tool for swing traders and intraday strategists looking to add volume context to their directional setups.
Buy

Lowess Channel + (RSI) [ChartPrime]The Lowess Channel + (RSI) indicator applies the LOWESS (Locally Weighted Scatterplot Smoothing) algorithm to filter price fluctuations and construct a dynamic channel. LOWESS is a non-parametric regression method that smooths noisy data by fitting weighted linear regressions at localized segments. This technique is widely used in statistical analysis to reveal trends while preserving data structure.
In this indicator, the LOWESS algorithm is used to create a central trend line and deviation-based bands. The midline changes color based on trend direction, and diamonds are plotted when a trend shift occurs. Additionally, an RSI gauge is positioned at the end of the channel to display the current RSI level in relation to the price bands.
lowess_smooth(src, length, bandwidth) =>
sum_weights = 0.0
sum_weighted_y = 0.0
sum_weighted_xy = 0.0
sum_weighted_x2 = 0.0
sum_weighted_x = 0.0
for i = 0 to length - 1
x = float(i)
weight = math.exp(-0.5 * (x / bandwidth) * (x / bandwidth))
y = nz(src , 0)
sum_weights := sum_weights + weight
sum_weighted_x := sum_weighted_x + weight * x
sum_weighted_y := sum_weighted_y + weight * y
sum_weighted_xy := sum_weighted_xy + weight * x * y
sum_weighted_x2 := sum_weighted_x2 + weight * x * x
mean_x = sum_weighted_x / sum_weights
mean_y = sum_weighted_y / sum_weights
beta = (sum_weighted_xy - mean_x * mean_y * sum_weights) / (sum_weighted_x2 - mean_x * mean_x * sum_weights)
alpha = mean_y - beta * mean_x
alpha + beta * float(length / 2) // Centered smoothing
⯁ KEY FEATURES
LOWESS Price Filtering – Smooths price fluctuations to reveal the underlying trend with minimal lag.
Dynamic Trend Coloring – The midline changes color based on trend direction (e.g., bullish or bearish).
Trend Shift Diamonds – Marks points where the midline color changes, indicating a possible trend shift.
Deviation-Based Bands – Expands above and below the midline using ATR-based multipliers for volatility tracking.
RSI Gauge Display – A vertical gauge at the right side of the chart shows the current RSI level relative to the price channel.
Fully Customizable – Users can adjust LOWESS length, band width, colors, and enable or disable the RSI gauge and adjust RSIlength.
⯁ HOW TO USE
Use the LOWESS midline as a trend filter —bullish when green, bearish when purple.
Watch for trend shift diamonds as potential entry or exit signals.
Utilize the price bands to gauge overbought and oversold zones based on volatility.
Monitor the RSI gauge to confirm trend strength—high RSI near upper bands suggests overbought conditions, while low RSI near lower bands indicates oversold conditions.
⯁ CONCLUSION
The Lowess Channel + (RSI) indicator offers a powerful way to analyze market trends by applying a statistically robust smoothing algorithm. Unlike traditional moving averages, LOWESS filtering provides a flexible, responsive trendline that adapts to price movements. The integrated RSI gauge enhances decision-making by displaying momentum conditions alongside trend dynamics. Whether used for trend-following or mean reversion strategies, this indicator provides traders with a well-rounded perspective on market behavior.

Cumulative Price Change AlertCumulative Price Change Alert
Version: 1.0
Author: QCodeTrader 🚀
Overview 🔍
The Cumulative Price Change Alert indicator analyzes the percentage change between the current and previous open prices and sums these changes over a user-defined number of bars. It then generates visual buy and sell signals using arrows and labels on the chart, helping traders spot cumulative price momentum and potential trading opportunities.
Key Features ⚙️
Customizable Timeframe 🕒:
Use a custom timeframe or default to the chart's timeframe for price data.
User-Defined Summation 🔢:
Specify the number of bars to sum, allowing you to analyze cumulative price changes.
Custom Buy & Sell Conditions 🔔:
Set individual percentage change thresholds and cumulative sum thresholds to tailor signals for
your strategy.
Visual Alerts 🚀:
Displays green upward arrows for buy signals and red downward arrows for sell signals directly
on the chart.
Informative Labels 📝:
Provides labels with formatted percentage change and cumulative sum details for the analyzed
bars.
Versatile Application 📊:
Suitable for stocks, forex, crypto, commodities, and more.
How It Works ⚡
Price Change Calculation ➗:
The indicator calculates the percentage change between the current bar's open price and the
previous bar's open price.
Cumulative Sum ➕:
It then sums these percentage changes over the last N bars (as specified by the user).
Signal Generation 🚦:
Buy Signal 🟢: When both the individual percentage change and the cumulative sum exceed
their respective buy thresholds, a green arrow and label are displayed.
Sell Signal 🔴: Conversely, if the individual change and cumulative sum fall below the sell
thresholds, a red arrow and label are shown.
How to Use 💡
Add the Indicator ➕:
Apply the indicator to your chart.
Customize Settings ⚙️:
Set a custom timeframe if desired.
Define the number of bars to sum.
Adjust the buy/sell percentage change and cumulative sum thresholds to match your trading
strategy.
Interpret Visual Cues 👀:
Monitor the chart for green or red arrows and corresponding labels that signal potential buy or
sell opportunities based on cumulative price movements.
Settings Explained 🛠️
Custom Timeframe:
Select an alternative timeframe for analysis, or leave empty to use the current chart's timeframe.
Number of Last Bars to Sum:
Determines how many bars are used to compute the cumulative percentage change.
Buy Condition - Min % Change:
The minimum individual percentage change required to consider a buy signal.
Buy Condition - Min Sum of Bars:
The minimum cumulative percentage change over the defined bars needed for a buy signal.
Sell Condition - Max % Change:
The maximum individual percentage change threshold for a sell signal.
Sell Condition - Max Sum of Bars:
The maximum cumulative percentage change over the defined bars for triggering a sell signal.
Best Use Cases 🎯
Momentum Identification 📈:
Quickly spot strong cumulative price movements and momentum shifts.
Entry/Exit Signals 🚪:
Use the visual signals to determine potential entry and exit points in your trading.
Versatile Strategy Application 🔄:
Effective for scalping, swing trading, and longer-term analysis across various markets.
UPD: uncheck labels for better performance

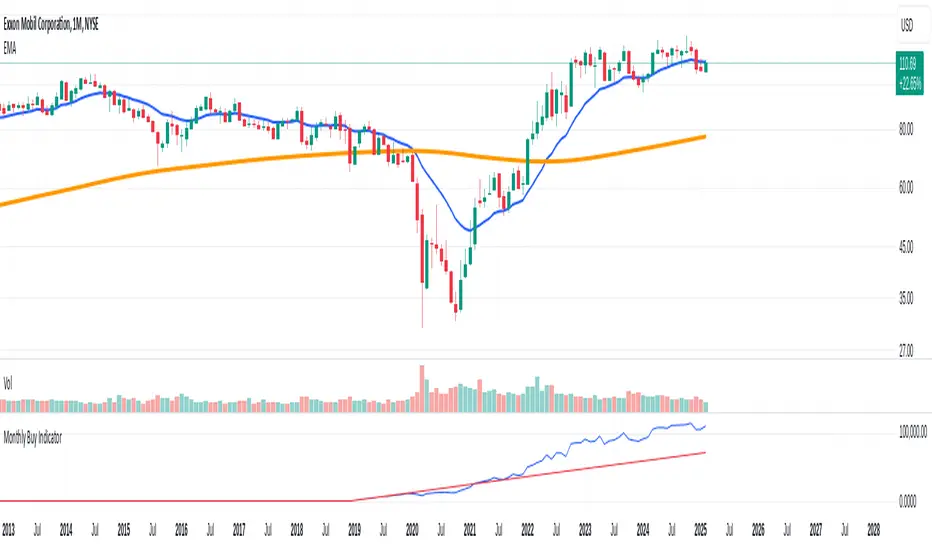
Monthly Buy IndicatorIt shows us the the total balance when buying monthly, ploting the total invested amount and total current balance along the time.
Opening the Data Window, it displays the profit (%) and the number of trades.
The "Allow Fractional Purchase" flag can be used to check the the performance of the ticker, disregarding how much the monthly amount is set vs the price of the ticker.
The trades are considering buying the available amount on the 1st candle of each month, at the Open price. The "Total Balance" considers the close price of each candle.
Multi-Indicator Signals with Selectable Options by DiGetMulti-Indicator Signals with Selectable Options
Script Overview
This Pine Script is a multi-indicator trading strategy designed to generate buy/sell signals based on combinations of popular technical indicators: RSI (Relative Strength Index) , CCI (Commodity Channel Index) , and Stochastic Oscillator . The script allows you to select which combination of signals to display, making it highly customizable and adaptable to different trading styles.
The primary goal of this script is to provide clear and actionable entry/exit points by visualizing buy/sell signals with arrows , labels , and vertical lines directly on the chart. It also includes input validation, dynamic signal plotting, and clutter-free line management to ensure a clean and professional user experience.
Key Features
1. Customizable Signal Types
You can choose from five signal types:
RSI & CCI : Combines RSI and CCI signals for confirmation.
RSI & Stochastic : Combines RSI and Stochastic signals.
CCI & Stochastic : Combines CCI and Stochastic signals.
RSI & CCI & Stochastic : Requires all three indicators to align for a signal.
All Signals : Displays individual signals from each indicator separately.
This flexibility allows you to test and use the combination that works best for your trading strategy.
2. Clear Buy/Sell Indicators
Arrows : Buy signals are marked with upward arrows (green/lime/yellow) below the candles, while sell signals are marked with downward arrows (red/fuchsia/gray) above the candles.
Labels : Each signal is accompanied by a label ("BUY" or "SELL") near the arrow for clarity.
Vertical Lines : A vertical line is drawn at the exact bar where the signal occurs, extending from the low to the high of the candle. This ensures you can pinpoint the exact entry point without ambiguity.
3. Dynamic Overbought/Oversold Levels
You can customize the overbought and oversold levels for each indicator:
RSI: Default values are 70 (overbought) and 30 (oversold).
CCI: Default values are +100 (overbought) and -100 (oversold).
Stochastic: Default values are 80 (overbought) and 20 (oversold).
These levels can be adjusted to suit your trading preferences or market conditions.
4. Input Validation
The script includes built-in validation to ensure that oversold levels are always lower than overbought levels for each indicator. If the inputs are invalid, an error message will appear, preventing incorrect configurations.
5. Clean Chart Design
To avoid clutter, the script dynamically manages vertical lines:
Only the most recent 50 buy/sell lines are displayed. Older lines are automatically deleted to keep the chart clean.
Labels and arrows are placed strategically to avoid overlapping with candles.
6. ATR-Based Offset
The vertical lines and labels are offset using the Average True Range (ATR) to ensure they don’t overlap with the price action. This makes the signals easier to see, especially during volatile market conditions.
7. Scalable and Professional
The script uses arrays to manage multiple vertical lines, ensuring scalability and performance even when many signals are generated.
It adheres to Pine Script v6 standards, ensuring compatibility and reliability.
How It Works
Indicator Calculations :
The script calculates the values of RSI, CCI, and Stochastic Oscillator based on user-defined lengths and smoothing parameters.
It then checks for crossover/crossunder conditions relative to the overbought/oversold levels to generate individual signals.
Combined Signals :
Depending on the selected signal type, the script combines the individual signals logically:
For example, a "RSI & CCI" buy signal requires both RSI and CCI to cross into their respective oversold zones simultaneously.
Signal Plotting :
When a signal is generated, the script:
Plots an arrow (upward for buy, downward for sell) at the corresponding bar.
Adds a label ("BUY" or "SELL") near the arrow for clarity.
Draws a vertical line extending from the low to the high of the candle to mark the exact entry point.
Line Management :
To prevent clutter, the script stores up to 50 vertical lines in arrays (buy_lines and sell_lines). Older lines are automatically deleted when the limit is exceeded.
Why Use This Script?
Versatility : Whether you're a scalper, swing trader, or long-term investor, this script can be tailored to your needs by selecting the appropriate signal type and adjusting the indicator parameters.
Clarity : The combination of arrows, labels, and vertical lines ensures that signals are easy to spot and interpret, even in fast-moving markets.
Customization : With adjustable overbought/oversold levels and multiple signal options, you can fine-tune the script to match your trading strategy.
Professional Design : The script avoids clutter by limiting the number of lines displayed and using ATR-based offsets for better visibility.
How to Use This Script
Add the Script to Your Chart :
Copy and paste the script into the Pine Editor in TradingView.
Save and add it to your chart.
Select Signal Type :
Use the "Signal Type" dropdown menu to choose the combination of indicators you want to use.
Adjust Parameters :
Customize the lengths of RSI, CCI, and Stochastic, as well as their overbought/oversold levels, to match your trading preferences.
Interpret Signals :
Look for green arrows and "BUY" labels for buy signals, and red arrows and "SELL" labels for sell signals.
Vertical lines will help you identify the exact bar where the signal occurred.
Tips for Traders
Backtest Thoroughly : Before using this script in live trading, backtest it on historical data to ensure it aligns with your strategy.
Combine with Other Tools : While this script provides reliable signals, consider combining it with other tools like support/resistance levels or volume analysis for additional confirmation.
Avoid Overloading the Chart : If you notice too many signals, try tightening the overbought/oversold levels or switching to a combined signal type (e.g., "RSI & CCI & Stochastic") for fewer but higher-confidence signals.

Zerg range filter credit to Kivanc turkish pinecoder for base indicator i reworked with chatgpt and some common sense
this indicator similar to the ADX but i think its better visually to keep you out of market conditions that are unfavorable.
i made original indicator to work in a 0-100 enviroment (before it was a zero middle line oscillator) and added background coloring that has a lower and higher threshold setting. i also added a smoothing moving average. this will trigger threshold levels (not the core oscillator)
above higher level would indicate trending market conditions and its purple. these are the areas where you might want to buy low period moving average bounces like 10 or 21 ema
lower band will paint indicator background blue and its cold, meaning range bound trade ideas are likely play out better. selling resistance and buying horizontal supports for example.
you are encourage to play with lookback period and change thresholds until you find something that works for your trading.
on the picture above it illustrates how i intended its usage.
it also shows divergences which was not intended but also a function.
you can also observe as the oscillator likes to coil up into a tight range (horizontal or a wedge formation) and when these break their trendlines explosive moves are incoming usually.
if you have a trading system and can generate a lot of signals but want to filter out some loser trades this could be the indicator you were looking for.
i hope this will be inline with community guidelines. my other publishing got removed unfortunately

Uptrick: Oracle Metrics +
Introduction
Uptrick: Oracle Metrics + is a multi-dimensional trading indicator designed to consolidate various technical and risk-oriented signals into one accessible framework. It allows traders to observe market volatility, identify potential reversal points, and assess numerous performance metrics, all within a single interface.
Purpose
The main goal of this indicator is to simplify a broad array of market insights. It merges trend analysis, volatility indicators, on-chart signals, and risk-performance metrics to help traders quickly evaluate the state of a market and make more informed decisions.
Features
1. Cloud Visualization
A colored cloud overlays the chart, indicating market conditions. When the cloud narrows, it can signal upcoming breakout scenarios, as volatility compresses and price movement may accelerate. In contrast, when the cloud is wide, this could hint at an extended trend that might be nearing a pullback or retracement. Observing shifts between narrow and wide phases helps anticipate shifts in momentum.
This can be seen here:
Simple Cloud Overlay
You can also use the cloud like this: when it turns purple you sell when it turns aqua color you buy. These signals are not very accurate in ranging markets but therefore they are usually better on almost all timeframes and assets in trending markets. :
Bounces of cloud. The cloud can also be used as a type of support/resistance. In the example below you can see how the trend bounces off of the cloud. For example, you could add up to your position every time it touches the cloud and then you could fully exit when the cloud turns purple or the trend breaks below the cloud:
An example of a way you could use this indicator as a confirmation is here. In the image below, a fake signal is generated, you can eliminate this signal by waiting for the cloud to turn purple in order to have confirmation for a potential downward move:
2. Bar Coloring for Volatility and System States
Traders can choose between two bar-coloring methods:
• Volatility: Bars change color intensity based on the level of current volatility relative to a historical average. This helps in spotting abrupt changes in market behavior, where bars become more pronounced when volatility is higher. You can see the volatility information in the volatility table.
• System Score: Bars receive a color gradient determined by the indicator’s final overall score. This simplifies spotting bullish, bearish, or neutral phases without needing to inspect multiple metrics separately. The closer the final score is to zero the less the color difference between bullish and bearish is.
3. Reversion Signals and Potential Reversal Alerts
Two sets of on-chart markers help in spotting sudden shifts in momentum:
• Reversion Signals marked with the letter R: These signals combine RSI thresholds, stochastic crossovers, and EMA confirmation to identify potential reversals. RSI highlights overbought (above 70) or oversold (below 30) conditions, while stochastic crossovers confirm shifts in momentum. The EMA ensures signals align with the broader trend, reducing false positives in volatile markets. Together, these components provide a reliable way to spot potential market corrections or reversals.
• Potential Reversal Signals marked with small circles: These signals detect subtle shifts in momentum using a smoothed RSI (via TEMA) and changes in its slope. When the slope turns positive or negative near key levels, it highlights early-stage reversals. This approach helps traders identify timely entry or exit opportunities by capturing potential trend changes before they fully develop.
4. Main Metrics Table
A primary dashboard shows detailed performance measures and market analytics. Next to each value, there is a bullish or bearish arrow to hint at the current direction of that metric. The table includes the following:
• Sharpe Ratio: Offers a view of risk-adjusted returns, hinting at whether rewards outweigh the variability in price.
• Sortino Ratio: A variation of risk-adjusted return focusing more on downside risk.
• Treynor Ratio: Displays returns relative to systematic risk, referencing a user-provided beta.
• Information Ratio: Shows how the instrument is outperforming or underperforming a benchmark, scaled by tracking error.
• ROC: Rate of change in price over a specified period, reflecting momentum.
• MACD Histogram: The difference between fast and slow moving average convergence, illustrating momentum shifts.
• CMF: Chaikin Money Flow, evaluating buying or selling pressure by combining price and volume.
• Ulcer Index: A measure of drawdown intensity to gauge how severe downtrends or pullbacks have been.
• Amihud Ratio: Assesses illiquidity by comparing price impact to volume.
• Market Depth Ratio: Looks at price ranges relative to volume activity, indicating how deeply the market can absorb trades.
• S2F Ratio: Incorporates the asset’s circulating supply relative to its yearly production, sometimes referenced in markets with a defined issuance schedule.
• NVT Ratio: A network value to transactions ratio, typically applied to on-chain data.
• MVRV Ratio: Compares the asset’s market value with its realized value, highlighting overall valuation conditions.
• Autocorrelation: Shows how current price movement may be echoing previous price changes.
• Alpha: Measures excess return over what might be expected from a risk-free rate plus systematic market exposure.
• Skewness: Reveals the asymmetry of the return distribution.
• Kurtosis: Looks at whether returns have heavier or lighter tails than typical distributions.
• Max Drawdown: The largest peak-to-trough drop within a lookback window, a key measure of downside risk.
• Calmar Ratio: Evaluates returns in light of drawdowns, relating performance to the severity of pullbacks.
• Omega Ratio: Considers gains versus losses around a threshold return level to measure reward-to-risk balance.
• January Performance: A snapshot of how price behaves in January over a lookback, connected to the idea of seasonality.
• Bid-Ask Spread: Reflects the percentage difference between highest and lowest price in a period, hinting at market liquidity costs.
5. Final Score Table
After analyzing individual metrics, the indicator calculates an overall score that determines if the broader environment appears bullish, bearish, or neutral. This final score then influences optional color schemes across the chart, allowing traders to see at a glance how multiple data points combine into one stance. For those who prefer a visual “gauge,” an additional grid table can be enabled, where boxes fill with varying color intensities based on the current score. The score calculation is complex and uses a similar technique to TPI. It assigns values to each metric and then divides the score by the amount of metrics. The score is then visualized in the System Generation bar coloring option according to how intense the signal is.
Grids (visualization of how much more the score needs to be a full signal.):
6. Volatility Table
A separate table focuses on how current volatility compares with an average measure. When current volatility differs significantly from historical norms, the bars become more vividly colored. If volatility nears its average, the bars are more subdued. This helps traders know when to be cautious of sudden moves or to adapt their position sizing.
Indicator Inputs
Users can tailor numerous inputs to suit the nature of each instrument:
• Risk-Free Rate (annualized rate used for risk calculations)
• Benchmark Return (expected return of the market benchmark)
• Beta (measure of systematic risk, particularly for Treynor Ratio calculations)
• Lookback Period (window of time used for many rolling calculations)
• ROC Period (time span for the rate of change calculation)
• CMF Period (window for the Chaikin Money Flow measure)
• Ulcer Index Period (depth for the Ulcer Index reading)
• Amihud Illiquidity Period (period for measuring price impact relative to volume)
• Market Depth Ratio Period (time range for examining price breadth versus volume)
• Circulating Supply (used for the stock-to-flow calculation)
• Yearly Production (helps update the stock-to-flow ratio)
• Market Cap (overall value of the instrument, often used in ratio metrics)
• Transaction Volume (on-chain or traded volume data for NVT ratio)
• Realized Value (alternative valuation data, used in MVRV calculation)
• Threshold Return for Omega (sets a custom threshold above which returns are considered favorable)
• Bar Coloring Method (choose between volatility-based or final-score-based color themes)
• Table Text Size (adjust the display size of table entries)
• Additional parameters related to internal signals (like RSI lengths or smoothing settings) can be fine-tuned for different market behaviors. It is important to customize these fields according to the characteristics of the specific asset you are trading.
Important!
Adjust the inputs according to your current asset! The inputs under the 'Vital' section have to be adjusted so that the metrics function properly. If not well adjusted to your asset, your final score will be mixed up and System Bar coloring as well! These inputs include: Circulating Supply, Yearly Production, Market Cap, Transaction Volume, and Realized Value!
Originality and Uniqueness
Uptrick: Oracle Metrics + stands out by combining complex metrics, including calculations similar to the Trend Probability Indicator (TPI), to provide a deeper analysis of market conditions. The indicator offers multiple signals tailored to different trading scenarios, allowing users to filter and customize them manually through a variety of features. This flexibility, combined with its advanced risk and trend analysis tools, makes it a versatile solution for both momentum and long-term trading strategies.
Warnings
In some scenarios, overlapping numbers or markers may crowd the chart. A practical fix for any visual overlap is removing the indicator and then reapplying it, which generally resets the tables and color overlays.
Summary
Uptrick: Oracle Metrics + merges cloud-based analytics, bar-coloring for volatility or system state, reversion alerts, and a detailed metrics dashboard into one seamless interface. This synergy of short-term signals and long-term performance metrics aims to give traders a fuller perspective on risk, trend changes, and valuation. By tuning the inputs to each asset, traders can capture more relevant data, while the color-coded approach simplifies quick decision-making in a dynamic market environment.
Disclaimer
The Uptrick: Oracle Metrics + indicator is a tool designed to assist traders in analyzing market conditions and making informed decisions. It is not a guarantee of future performance or a substitute for independent financial advice. Trading involves significant risk, and past results do not guarantee future outcomes. Users are advised to conduct their own research, consider their financial situation, and consult with a licensed financial professional if necessary. Uptrick and its affiliates are not responsible for any financial losses incurred while using this indicator. Use at your own discretion and risk.

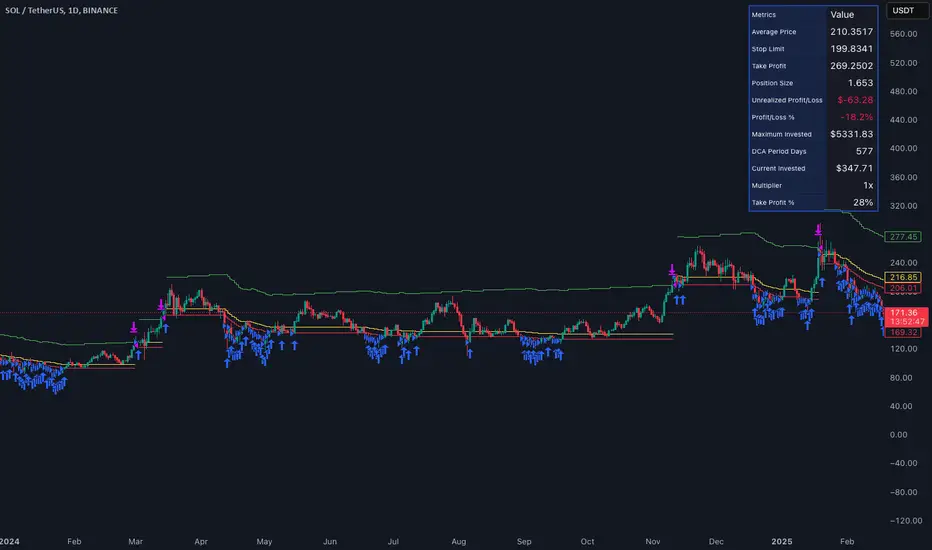
Smart DCA Invest LiteEnglish description:
📊 Smart DCA Invest – Features Overview
✅ Automated DCA strategy with dynamic profit targets, optimized risk management.
⚙️ Functionality:
🕒 Time Interval Settings
• 📅 Start Date and Time: The strategy activates only after the specified start time.
• 🔄 Auto Restart: Automatically restarts the strategy after a position is closed.
💵 Investment Amounts
• 🟢 Initial Investment Amount: The amount invested when the first position is opened.
• 🔄 Recurring Investment Amount: The amount invested periodically for subsequent purchases.
📊 Purchase Frequency
• ⏱ Interval Between Purchases: Specifies the minimum number of candles between two purchases to avoid overly frequent position expansions.
🛡️ Risk Management
• 📉 Loss Limit: The strategy halts additional purchases if the price does not drop below a predefined loss level, optimizing the average cost reduction.
• 🎯 Take Profit: A predefined profit target percentage, triggering position closure upon reaching it.
📈 Dynamic Take Profit (TP) Settings
• ⏳ TP Increase Frequency: The interval in days for dynamic TP growth.
• 📊 TP Growth Rate: The percentage by which the TP level increases at the end of each interval.
• ⚙️ Enable Dynamic TP: Allows the TP level to increase dynamically over time based on holding duration.
• 🧠 Smart Invest: Accumulates skipped purchases above the average entry or loss limit price and invests them when the price drops below the loss limit.
🎨 Visual Representation
• 📏 Average Price Line: Displays the average entry price in yellow.
• 🛑 Stop Limit Line: Displays the loss limit in red.
• ✅ Take Profit Line: Displays the dynamically updated profit target in green.
🎨 Visual Elements
• 📏 Average Price Line: Visualizes the average cost on the chart.
• 🛑 Stop Limit Line: Visualizes the loss limit level.
• ✅ Take Profit Line: Displays the TP level graphically.
• 📊 Statistics Table: Detailed data summary presented in a table at the end of the strategy.
📊 Statistics Table
• 📈 Average Price: The average entry price of the current position.
• 🛑 Stop Limit: The loss limit value.
• ✅ Take Profit: The profit target value.
• 📦 Position Size: The size of the current position.
• 💵 Max Invested Amount: The highest amount invested.
• ⏳ Longest DCA Period: The longest duration a DCA position was open.
• 💼 Current Investment: The amount currently invested.
• 🔄 Multiplier: Purchase multiplier value.
• 📊 Dynamically Adjusted TP %: The current dynamic Take Profit percentage.
- Recommended for retesting
Hungarian description:
📊 Smart DCA Invest – Funkciók Leírása
✅ Automatizált DCA stratégia dinamikus profitcélokkal, optimalizált kockázatkezeléssel.
⚙️ Működés:
🕒 Időintervallum Beállítások
• 📅 Kezdési dátum és idő: A stratégia csak a meghatározott kezdési időpont után aktiválódik.
• ⏳ Befejezési dátum és idő: A stratégia a meghatározott időpontig működik.
• 🔄 Automatikus újraindítás: Pozíciózárás után a stratégia automatikusan újraindulhat.
💵 Befektetési Összegek
• 🟢 Első befektetési összeg: Az első pozíció nyitásakor befektetett összeg.
• 🔄 Napi vásárlási összeg: Ismételt periódusonkénti vásárlások összege.
📊 Vásárlási Gyakoriság
• ⏱ Intervallum két vásárlás között: Meghatározza a minimális gyertya intervallumot két vásárlás között, elkerülve a túl gyakori pozícióbővítéseket.
🛡️ Kockázatkezelés
• 📉 Loss Limit: Ha az ár nem csökken egy meghatározott veszteségi szint alá, a stratégia nem vásárol tovább, hogy hatékonyabban csökkentse az átlagárat.
• 🎯 Take Profit: Előre meghatározott profitcél százalékos értéke, amely elérésekor a pozíció lezárul.
📈 Dinamikus Take Profit (TP) Beállítások
• ⏳ TP növelési gyakoriság: A dinamikus TP növekedésének időszaka napokban.
• 📊 TP növekedés mértéke: A TP szint százalékos növekedése az intervallum végén.
• ⚙️ Dinamikus TP engedélyezése: A TP szint dinamikusan növekszik a tartási idő függvényében.
• 🧠 Smart Invest: Kihagyott vásárlások felhalmozása (átlagos bekerülési vagy „Loss limit” feletti árfolyamnál), amelyek a „Loss limit” árszint alatt befektetésre kerülnek.
🎨 Vizuális Megjelenítés
• 📏 Átlagár vonal: Sárga színnel jelzi az átlagárat.
• 🛑 Stop Limit vonal: Piros színnel jelzi a veszteségi korlátot.
• ✅ Take Profit vonal: Zöld színnel jelzi a dinamikusan frissülő profitcélt.
🎨 Vizuális Elemek
• 📏 Átlagár vonal: Az átlagár megjelenítése a grafikonon.
• 🛑 Stop Limit vonal: A veszteségkorlátozási szint megjelenítése.
• ✅ Take Profit vonal: A Take Profit szint grafikai megjelenítése.
• 📊 Statisztikai táblázat megjelenítése: A stratégia végén részletes adatok jelennek meg egy táblázatban.
📊 Statisztikai Táblázat
• 📈 Átlagár: Az aktuális pozíció átlagos bekerülési ára.
• 🛑 Stop Limit: A veszteségkorlátozási szint értéke.
• ✅ Take Profit: A profitcél értéke.
• 📦 Pozícióméret: Az aktuális pozíció nagysága.
• 💵 Maximális befektetett összeg: A legnagyobb befektetett érték.
• ⏳ Leghosszabb DCA időszak: A leghosszabb időtartam, amíg egy DCA pozíció nyitva maradt.
• 💼 Aktuális befektetés: Az aktuálisan befektetett összeg.
• 🔄 Multiplikátor: Vásárlási szorzó érték.
• 📊 Dinamikusan beállított TP %: Az aktuálisan érvényes Take Profit százalékos értéke.
Buy Sell Indicator - MicroStrategiesOverview :
The "Buy Sell Indicator - MicroStrategies" is designed to provide traders with dynamic buy and sell signals based on an adaptive channel and supertrend approach. This script is unique as it combines standard supertrend methodology with a custom channel logic to adapt more effectively to market conditions, enhancing the identification of trend reversals.
Key Features:
Adaptive Channel Logic: Utilizes a calculated channel, defined by the highest and lowest prices over a specified period, to adjust the trend sensitivity dynamically. This helps in accurately identifying potential buy and sell zones by incorporating price volatility.
Supertrend Integration: Integrates with a modified supertrend function that uses the adaptive channel to set trend thresholds. This combination allows the script to filter out less significant movements and focus on substantial trends, minimizing false signals.
Signal Alerts: Provides visual and alert-based signals for entering (Buy) and exiting (Sell) trades, enhancing user interaction and trade execution timing.
Usefulness: This indicator is particularly useful for traders who engage in medium to long-term trading strategies. It helps in determining optimal entry and exit points, thereby aiding in risk management and profit maximization.
How It Works:
The script calculates the high and low channel limits over a user-defined length.
It then calculates a range from these limits and sets upper and lower thresholds based on the trend sensitivity input.
Buy signals are generated when the price crosses above the adaptive upper limit, suggesting an upward trend.
Sell signals are triggered when the price crosses below the adaptive lower limit, indicating a potential downward trend.
How to Use:
Apply the indicator to any chart.
Adjust the trendSensitivity, channelLength, and atrLookback parameters according to your trading preferences.
Use the buy (B) and sell (S) labels to guide your trading decisions.
Originality: This script is original in its approach by merging traditional supertrend indicators with a customized channel-based method to refine signal accuracy and responsiveness to market changes. This dual approach helps in better capitalizing on trends and avoiding sideways market phases.
Performance Claims: No unrealistic performance or profitability claims are made about this script. Traders should use this tool as part of a comprehensive trading strategy, considering risk management and market conditions. Past performance does not guarantee future results, and users should test the script in different market environments.
Disclaimer: This script does not guarantee earnings. Traders should use it at their discretion and in conjunction with other analytical tools.
Conclusion: The "Buy Sell Indicator - MicroStrategies" offers an innovative combination of trend detection methodologies tailored to enhance trading strategies through precise signal generation. Its design is focused on providing clear, actionable trading signals to assist in decision-making processes.

Volume EquilibriumThe intent behind this indicator is to provide comprehensive information relating to volume compared to multiple timeframes. This indicator allows one to see what the market 'theoretically' sees as 'fair-value' whilst also allowing one to gauge where the price of a stock is headed.
Volume Equilibrium
The main indicator finds the difference between buying volume and selling volume, under the basic presumption that more buying volume indicates greater bullish sentiment and vice versa.
Buying Volume = volume when close price is higher than open price.
Selling Volume = volume when close price is lower than open price.
Volume Balance = Cumulative Buying Volume − Cumulative Selling Volume
Volume Balance is then expressed as a percentage by dividing by total volume
This indicator is composed of three different lengths of the same indicator. Short, Mid, and Long term representations of Volume Equilibrium. The difference between the mid and long term are highlighted so to make it easy to see where volume is going relative to a longer time frame.
HOW TO USE:
At 0 ---> Equilibrium ---> Equal Buying/Selling Volume
Above 0 ---> More buying Volume
Below 0 ---> More selling Volume
Using theory, it is assumed that the price is at a 'fair-value' when the buying/selling volume is at 0. This is of course relative to the respective timeframe of your choosing. More weight given to larger timeframes.
Volume Histogram
It is a basic volume chart that represents the total volume though has highlighted bars so to indicate buying(green) and selling(red) volume. This allows one to see what the indicator is based off of.
Open-Close Oscillator(not needed)
Calculates the average open-close for a selected timeframe and then provides the current closing price relative to that average open-close. Very simply put, values below 0 indicate bearish and values above 0 generally indicate bullishness. This indicator is for a quick reference of price action relative to volume.
Another way to use this indicator, though unique, is to analyze the separate open-close lines themselves. Using the open-close bands, bullishness is defined as increasing closing prices and bearish as decreasing closing prices. So, in regard to this indicator, bear sessions can be indicated by the opening line being below the closing line and bull sessions as the opening line being above. Use the 'flip' of these lines to your advantage, they are very helpful at capturing long continuous sentiment.
This indicator is composed of great information though I still think it best to use many different indicators to help you with your trades.
NOTE: Be aware of what we are trying to analyze, Volume. This means that one should also look out for divergences to capture early indications of reversals. This indicator can be leveraged greatly.

Phase Cross Strategy with Zone### Introduction to the Strategy
Welcome to the **Phase Cross Strategy with Zone and EMA Analysis**. This strategy is designed to help traders identify potential buy and sell opportunities based on the crossover of smoothed oscillators (referred to as "phases") and exponential moving averages (EMAs). By combining these two methods, the strategy offers a versatile tool for both trend-following and short-term trading setups.
### Key Features
1. **Phase Cross Signals**:
- The strategy uses two smoothed oscillators:
- **Leading Phase**: A simple moving average (SMA) with an upward offset.
- **Lagging Phase**: An exponential moving average (EMA) with a downward offset.
- Buy and sell signals are generated when these phases cross over or under each other, visually represented on the chart with green (buy) and red (sell) labels.
2. **Phase Zone Visualization**:
- The area between the two phases is filled with a green or red zone, indicating bullish or bearish conditions:
- Green zone: Leading phase is above the lagging phase (potential uptrend).
- Red zone: Leading phase is below the lagging phase (potential downtrend).
3. **EMA Analysis**:
- Includes five commonly used EMAs (13, 26, 50, 100, and 200) for additional trend analysis.
- Crossovers of the EMA 13 and EMA 26 act as secondary buy/sell signals to confirm or enhance the phase-based signals.
4. **Customizable Parameters**:
- You can adjust the smoothing length, source (price data), and offset to fine-tune the strategy for your preferred trading style.
### What to Pay Attention To
1. **Phases and Zones**:
- Use the green/red phase zone as an overall trend guide.
- Avoid taking trades when the phases are too close or choppy, as it may indicate a ranging market.
2. **EMA Trends**:
- Align your trades with the longer-term trend shown by the EMAs. For example:
- In an uptrend (price above EMA 50 or EMA 200), prioritize buy signals.
- In a downtrend (price below EMA 50 or EMA 200), prioritize sell signals.
3. **Signal Confirmation**:
- Consider combining phase cross signals with EMA crossovers for higher-confidence trades.
- Look for confluence between the phase signals and EMA trends.
4. **Risk Management**:
- Always set stop-loss and take-profit levels to manage risk.
- Use the phase and EMA zones to estimate potential support/resistance areas for exits.
5. **Whipsaws and False Signals**:
- Be cautious in low-volatility or sideways markets, as the strategy may generate false signals.
- Use additional indicators or filters to avoid entering trades during unclear market conditions.
### How to Use
1. Add the strategy to your chart in TradingView.
2. Adjust the input settings (e.g., smoothing length, offsets) to suit your trading preferences.
3. Enable the strategy tester to evaluate its performance on historical data.
4. Combine the signals with your own analysis and risk management plan for best results.
This strategy is a versatile tool, but like any trading method, it requires proper understanding and discretion. Always backtest thoroughly and trade with discipline. Let me know if you need further assistance or adjustments to the strategy!

Liquitive Buy/Sell Dollar AveragerLiquitive Buy/Sell Dollar Averager Indicator
The "Liquitive Buy/Sell Dollar Averager" is a versatile trading tool designed for intraday and multi-timeframe analysis, combining advanced range-bound calculations, RSI normalization, volume spikes, and candle pattern recognition to identify optimal buy and sell conditions. This indicator is particularly suitable for traders employing strategies that focus on dollar-cost averaging, position scaling, and systematic buy/sell decision-making.
Key Features:
Adaptive RSI-Based Levels:
Dynamically calculates inner bounds (IB) and outer bounds (OB) using RSI and price ranges, helping to identify overbought and oversold conditions relative to the price action.
Normalizes RSI values to the price range for seamless visualization overlaid on the chart.
Volume and Candle Analysis:
Detects significant volume spikes relative to a moving average, signaling increased market activity.
Identifies spiking green/red candles to capture momentum-driven price movements.
Dynamic Support and Resistance:
Calculates and plots support and resistance levels based on recent swing highs and lows.
Median and boundary lines help visualize key price levels for decision-making.
Profitability Check:
Buy and Sell Signals:
Checks profitability thresholds based on percentage gains/losses.
Incorporates logic for "time to buy" and "time to sell" using target profit margins.
Implements average move percentage to define realistic thresholds for buy/sell actions.
Time-Based Trading Restrictions:
Configures trading logic to disallow trades after a specific time (e.g., 3:40 PM for intraday sessions).
Ensures logical entry and exit decisions are only made within active trading hours.
Color-Coded Visualization:
Background colors dynamically shift between green (bullish), red (bearish), and neutral, depending on RSI and price position relative to the inner bounds.
Opacity of the background adjusts based on normalized RSI differences to provide a visual cue of market strength.
Customizable Parameters:
Allows user input for key settings like lookback periods, RSI length, percent ranges, volume thresholds, and transparency levels, enabling flexible configuration tailored to individual strategies.
Actionable Alerts and Signals:
Plots "Open Position", "Add to Position", and "Close Position" markers directly on the chart, making it easy to follow systematic trading rules.
How It Works:
Buy Signals:
Triggered when price conditions, volume spikes, and RSI-based thresholds align with profitability metrics.
Designed for dollar-cost averaging, identifying opportunities to add to long positions or open new positions.
Sell Signals:
Evaluates profitability conditions to identify when to close or scale out of positions.
Incorporates real-time evaluation of market momentum and profitability.

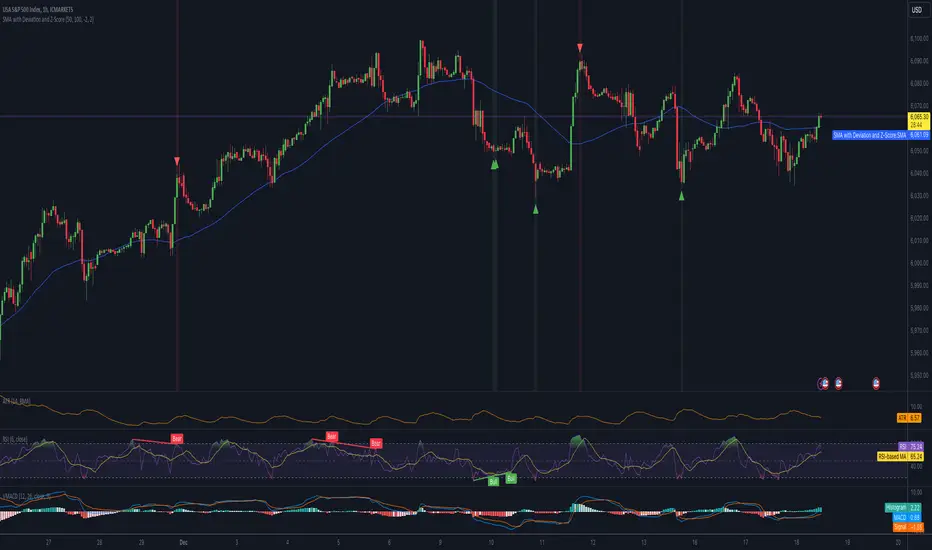
Mean Reversion IndicatorSMA with Deviation and Z-Score Indicator
Overview:
This indicator combines the Simple Moving Average (SMA) with statistical measures of price deviation to identify potential buy and sell signals based on mean reversion principles. It calculates the Z-Score, which quantifies how far the current price is from its moving average in terms of standard deviations, helping traders spot when an asset might be overbought or oversold.
Key Features:
SMA Calculation: Uses a user-defined period to compute a Simple Moving Average, providing a baseline for price movement.
Z-Score: Measures the number of standard deviations the current price is from the SMA. This is crucial for identifying extreme price movements.
Formula: Z-Score = (Current Price - SMA) / Standard Deviation
Signal Generation:
Buy Signal: Generated when the Z-Score falls below a predefined threshold, suggesting the price is significantly below its mean and potentially undervalued.
Sell Signal: Triggered when the Z-Score exceeds another threshold, indicating the price is significantly above its mean and possibly overvalued.
Visual Indicators:
SMA Line: Plotted in blue on the chart for easy reference.
Z-Score Line: Available but hidden by default, can be shown if needed for deeper analysis.
Buy/Sell Signals: Represented by green up-arrows for buy signals and red down-arrows for sell signals.
Background Color: Changes to green or red subtly to indicate buy or sell zones based on Z-Score thresholds.
Z-Score Label: Provides the numerical Z-Score for each bar, aiding in precise decision-making.
Customizable Parameters:
SMA Length: Adjust the period over which the SMA is calculated.
Lookback Period: Set the number of periods for calculating the standard deviation and Z-Score.
Buy/Sell Z-Scores: Thresholds for generating buy and sell signals can be tailored to your strategy or market conditions. FX:EURUSD FX:EURUSD
Usage Tips:
This indicator is best used in conjunction with other forms of analysis for confirmation. Mean reversion does not always hold in trending markets.
Adjust the Z-Score thresholds based on asset volatility for more or less frequent signals.
Backtest with historical data to optimize settings for your specific trading approach.
Note: While this indicator can help identify potential trading opportunities based on statistical anomalies, it does not guarantee success and should be part of a broader trading strategy that includes risk management and market context understanding.
Optimus trader Optimus Trader
Indicator Description:
The Optimus Trader indicator is designed for technical traders looking for entry and exit points in financial markets. It combines signals based on volume, moving averages, VWAP (Volume Weighted Average Price), as well as the recognition of candlestick patterns such as Pin Bar and Inside Bars. This indicator helps identify opportune moments to buy or sell based on trends, volumes, and recent liquidity zones.
Parameters and Features:
1. Simple Moving Average (MA) and VWAP:
- Optimus Trader uses a 50-period simple moving average to determine the underlying trend. It also includes VWAP for precise price analysis based on traded volumes.
- These two indicators help identify whether the market is in an uptrend or downtrend, enhancing the reliability of buy and sell signals.
2. Volume :
- To avoid false signals, a volume threshold is set using a 20-period moving average, adjusted to 1.2 times the average volume. This filters signals by considering only high-volume periods, indicating heightened market interest.
3. Candlestick Pattern Recognition:
- Pin Bar: This sought-after candlestick pattern is detected for both bullish and bearish setups. A bullish or bearish *Pin Bar* often signals a possible reversal or continuation.
- *Inside Bar*: This price compression pattern is also detected, indicating a zone of indecision before a potential movement.
4. Trend:
- An uptrend is confirmed when the price is above the MA and VWAP, while a downtrend is identified when the price is below both indicators.
5. Liquidity Zones:
- Optimus Trader includes an approximate liquidity zone detection feature. By identifying recent support and resistance levels, the indicator detects if the price is near these zones. This feature strengthens the relevance of buy or sell signals.
6. Buy and Sell Signals:
- Buy: A buy signal is generated when the indicator detects a bullish *Pin Bar* or *Inside Bar* in an uptrend with high volume, and the price is close to a liquidity zone.
- Sell: A sell signal is generated when a bearish *Pin Bar* or *Inside Bar* is detected in a downtrend with high volume, and the price is near a liquidity zone.
Signal Display:
The signals are visible directly on the chart:
- A "BUY" label in green is displayed below the bar for buy signals.
- A "SELL" label in red is displayed above the bar for sell signals.
Summary:
This indicator is intended for traders seeking precise entry and exit points by integrating trend analysis, volume, and candlestick patterns. With liquidity zones, *Optimus Trader* helps minimize false signals, providing clear and accurate alerts.
---
This description can be directly added to TradingView to help users quickly understand the features and logic of this indicator.

Future Trend Channel [ChartPrime]The Future Trend Channel indicator is a dynamic tool for identifying trends and projecting future prices based on channel formations. The indicator uses SMA (Simple Moving Average) and volatility calculations to plot channels that visually represent trends. It also detects moments of lower momentum, indicated by neutral color changes in the channels, and projects future price levels for up to 50 bars ahead.
⯁ KEY FEATURES AND HOW TO USE
⯌ Dynamic Trend Channels :
The indicator draws channels when a trend is identified. It uses a combination of SMA and volatility to determine the direction and strength of the trend. Each channel is visualized with a specific color, where green indicates an uptrend and orange represents a downtrend.
Example of channels during uptrend and downtrend:
⯌ Momentum-Based Color Shifts :
The indicator adapts its channel colors based on momentum changes. When the starting point (Y1) of a channel is higher than its ending point (Y2) during an uptrend, the channel turns neutral, indicating lower momentum and a possible ranging market. The same applies in a downtrend, where the channel turns neutral if Y1 is lower than Y2.
Example of neutral momentum channels:
⯌ Future Price Projection :
At the end of each channel, the indicator generates a projected future price based on the midpoint of the channel. By default, this projection is made 50 bars into the future, but users can adjust the number of bars to their preference.
Example of future price projection:
⯌ Diamond Signals for Valid Trends :
Lime-colored diamonds appear when an uptrend channel is confirmed, while orange diamonds indicate valid downtrend channels. These signals confirm the presence of a strong trend and help identify valid entry and exit points. Neutral channels, which indicate lower momentum, do not show diamond signals.
Example of trend confirmation signals:
⯌ Customizable Settings :
Users can adjust the channel length (how far back the trend is analyzed) and the width (which determines the channel boundaries based on volatility). The future price projection can also be customized to forecast further or fewer bars into the future.
⯁ USER INPUTS
Trend Length : Sets the number of bars used to calculate the trend channels.
Channel Width : Adjusts the width of the channels, based on volatility (ATR multiplier).
Up and Down Colors : Allows customization of the colors used for uptrend and downtrend channels.
Future Bars : Sets the number of bars used for future price projection.
⯁ CONCLUSION
The Future Trend Channel indicator is a versatile tool for identifying and trading trends. With its ability to detect momentum shifts and project future prices, it provides traders with key insights for making more informed decisions. The use of diamond signals for trend validation adds an extra layer of confirmation, helping traders act with greater confidence during volatile or trending markets.

Trend Levels [ChartPrime]The Trend Levels indicator is designed to identify key trend levels (High, Mid, and Low) during market trends, based on real-time calculations of highest, lowest, and mid-level values over a customizable length. Additionally, the indicator calculates trend strength by measuring the ratio of candles closing above or below the midline, providing a clear view of the ongoing trend dynamics and strength.
⯁ KEY FEATURES AND HOW TO USE
⯌ Trend Shift Signals :
Trend shifts, based on highest and lowest values during input length. When high is == to highest it will change trend to up when low == lowest value it will be shift to down trend.
// Calculate highest and lowest over the specified length
h = ta.highest(length)
l = ta.lowest(length)
// Determine trend direction: if the current high is the highest value, set trend to true
if h == high
trend := true
// If the current low is the lowest value, set trend to false
if l == low
trend := false
Whenever the trend changes direction (from uptrend to downtrend or vice versa), the indicator provides visual cues in the form of arrows. This gives traders clear signals to identify potential trend reversals, enabling them to adjust their strategies accordingly.
⯌ Trend Level Calculation :
As soon as a trend is detected (uptrend or downtrend), the indicator starts calculating the highest, lowest, and mid-level values over the defined period. These levels are plotted on the chart as color-coded lines for easy visualization, allowing traders to quickly spot the key levels within a trend.
⯌ Midline Retests :
Throughout the trend, the mid-level line is often retested, acting as a potential zone for pullbacks or rejections. Traders can use these retests as opportunities for entering positions or confirming trend continuation. The chart shows how price frequently interacts with the midline, helping to identify important reaction levels.
⯌ Trend Strength Calculation :
The indicator measures the trend strength by calculating the delta between the number of candles closing above and below the midline. This percentage-based delta is displayed in real-time, providing a clear indication of whether the trend is gaining or losing momentum.
⯁ USER INPUTS
Length : Specifies the lookback period for calculating the highest and lowest values, which determines the key trend levels.
Candle Counting : Measures the number of candles closing above and below the midline to calculate the trend strength delta.
⯁ CONCLUSION
The Trend Levels indicator provides traders with a powerful tool for visualizing trend dynamics, key levels of support and resistance, and real-time trend strength. By identifying midline retests, tracking candle counts, and providing trend shift signals, this indicator can help traders make well-informed decisions during market trends.

Regression Indicator [BigBeluga]Regression Indicator
Indicator Overview:
The Regression Indicator is designed to help traders identify trends and potential reversals in price movements. By calculating a regression line and a normalized regression indicator, it provides clear visual signals for market direction, aiding in making informed trading decisions. The indicator dynamically updates with the latest market data, ensuring timely and relevant signals.
Key Features:
⦾ Calculations
Regression Indicator: Calculates the linear regression coefficients (slope and intercept) and derives the normalized distance close from the regression line.
// @function regression_indicator is a Normalized Ratio of Regression Lines with close
regression_indicator(src, length) =>
sum_x = 0.0
sum_y = 0.0
sum_xy = 0.0
sum_x_sq = 0.0
distance = 0.0
// Calculate Sum
for i = 0 to length - 1 by 1
sum_x += i + 1
sum_y += src
sum_xy += (i + 1) * src
sum_x_sq += math.pow(i + 1, 2)
// Calculate linear regression coefficients
slope = (length * sum_xy - sum_x * sum_y)
/ (length * sum_x_sq - math.pow(sum_x, 2))
intercept = (sum_y - slope * sum_x) / length
// Calculate Regression Indicator
y1 = intercept + slope
distance := (close - y1)
distance_n = ta.sma((distance - ta.sma(distance, length1))
/ ta.stdev(distance, length1), 10)
⦿ Reversion Signals:
Marks potential trend reversal points.
⦿ Trend Identification:
Highlights when the regression indicator crosses above or below the zero line, signaling potential trend changes.
⦿ Color-Coded Candles:
Changes candle colors based on the regression indicator's value.
⦿ Arrow Markers:
Indicate trend directions on the chart.
⦿ User Inputs
Regression Length: Defines the period for calculating the regression line.
Normalization Length: Period used to normalize the regression indicator.
Signal Line: Length for averaging the regression indicator to generate signals.
Main Color: Color used for plotting the regression line and signals.
The Regression Indicator is a powerful tool for analyzing market trends and identifying potential reversal points. With customizable inputs and clear visual aids, it enhances the trader's ability to make data-driven decisions. The dynamic nature of the indicator ensures it remains relevant with up-to-date market information, making it a valuable addition to any trading strategy."

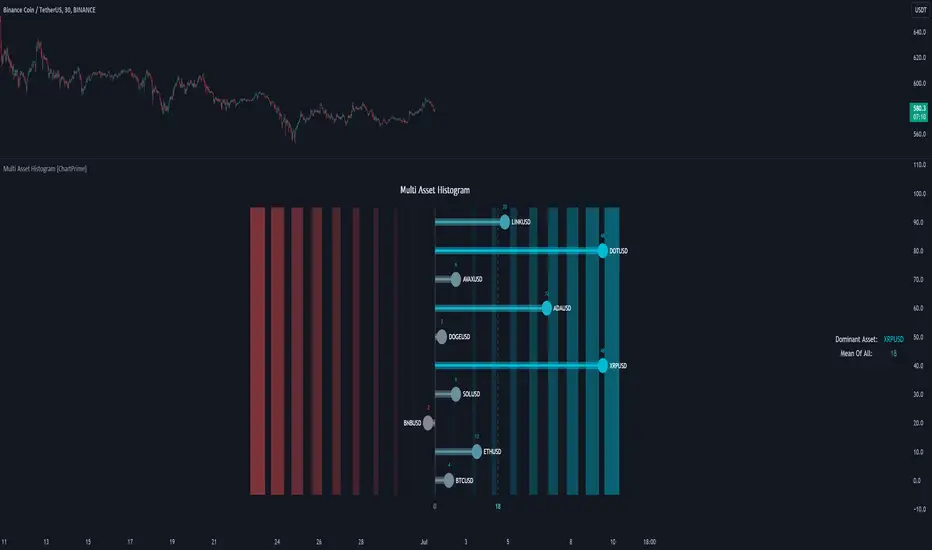
Multi Asset Histogram [ChartPrime]Multi Asset Histogram Indicator
Overview:
The "Multi Asset Histogram" indicator provides a comprehensive visualization of the performance of multiple assets relative to each other. By calculating a score for each asset and displaying it in a histogram format, this indicator helps traders quickly identify the trends, dominant asset and the average performance of the assets in the selected group.
Key Features:
◆ Multi-Asset Score Calculation:
The indicator calculates a trend score for each selected asset based on the price source (e.g., hl2).
The trend score is determined by comparing the current price to the prices over the past bars back defined by user, adding or subtracting points based on whether the current price is higher or lower than previous prices.
// Score Function
trscore(src) =>
total = 0.0
for i = 1 to 50
total += (src >= nz(src ) ? 1 : -1)
total
◆ Flexible Symbol Input:
Traders can input up to 10 different symbols (e.g., BTCUSD, ETHUSD, etc.) to be included in the histogram analysis.
◆ Dynamic Visualization:
A histogram is plotted for each asset, with bars colored based on the score, providing a clear visual representation of the relative performance.
Color gradients from red to aqua indicate the performance, with red representing negative scores and aqua representing positive scores.
◆ Adaptive Histogram Lines:
The width and placement of histogram lines adapt based on the calculated scores, ensuring clear visualization regardless of the values.
Dashed lines represent the mean score of all assets, helping traders identify the overall market trend.
◆Detailed Labels and Values:
Labels are placed on the histogram to display the exact score for each asset.
Mean value and zero line labels provide additional context for the overall performance.
◆ Visual Scaling Lines:
Zero line and mean line are clearly marked, helping traders understand the distribution and scale of scores.
Scales on the left and right of the histogram indicate the performance range.
◆ Informative Table:
A table is displayed on the chart, showing the dominant asset (the one with the highest score) and the mean score of all assets.
The table updates dynamically to reflect real-time changes in asset performance.
◆ Settings:
Length: The value of number bars back is greater or less than the current value of the source
Source: The price source to be used for score calculation (e.g., hl2).
Symbols: Up to 10 different asset symbols can be input for analysis.
Usage Notes:
This indicator is useful for traders who monitor multiple assets simultaneously and need a quick visual reference to identify the strongest and weakest performers.
The color coding and dynamic labels make it easy to interpret the relative performance and make informed trading decisions.
This indicator is designed to enhance multi-asset analysis by providing a clear, visual representation of each asset's performance relative to the others, making it easier to identify trends and dominant assets in the market.
Volume Positive & Negative Levels [ChartPrime]Volume Positive & Negative Levels
Overview:
The Volume Positive & Negative Levels indicator by ChartPrime is designed to provide traders with a clear visualization of volume activity across different price levels. By plotting volume levels as histograms, this tool helps identify significant areas of buying (positive volume) and selling (negative volume) pressure, enhancing the ability to spot potential support and resistance zones.
Key Features:
⯁ Lookback Period:
- The `lookbackPeriod` parameter, set to 500 bars, determines the range over which the volume analysis is conducted, ensuring a comprehensive view of the market’s volume activity. The maximum lookback period is 500 bars or the bars currently visible on the chart, whichever is smaller.
⯁ Dynamic Volume Calculation:
- Volume is calculated dynamically based on the price action, with positive volume indicating buying pressure (close > open) and negative volume indicating selling pressure (close < open).
⯁ Color Coding for Clarity:
- Positive Volume: Represented with a distinct color (`#ad9a2c`), making it easy to identify areas of buying interest.
- Negative Volume: Highlighted with another color (`#ad2cad`), simplifying the detection of selling pressure.
Volume Threshold and Bins:
- The indicator allows users to set a volume threshold (`volume_level`) to highlight significant volume levels, with the default set at 70.
- The number of bins (`numBins`) defines the granularity of the volume profile, with a higher number providing more detail.
⯁ Volume Profile Visualization:
- The volume profile is plotted as a histogram, with the height of each bar proportional to the volume at that price level. This visualization helps in quickly assessing the strength of volume at various price points.
⯁ Interactive Labels and Threshold Indicators:
- Labels: The indicator uses labels to mark significant volume levels, providing quick reference points for traders.
- Threshold Lines: Lines are drawn at specified volume thresholds, with colors and widths dynamically adjusted based on the volume levels.
⯁ User Inputs:
- Volume Threshold (`volume_level`): Sets the minimum volume required to highlight significant levels.
- Number of Bins (`numBins`): Determines the resolution of the volume profile.
- Line Width (`line_withd`): Specifies the width of the lines used in the visualization.
The Volume Positive & Negative Levels indicator is a powerful tool for traders looking to gain deeper insights into market dynamics. By providing a clear visual representation of volume activity across different price levels, it helps traders identify key support and resistance zones, spot trends, and make more informed trading decisions. Whether you are a day trader or a swing trader, this indicator enhances your ability to analyze volume data effectively, improving your overall trading strategy.

Higher Timeframe High & Low [ChartPrime]The Higher Timeframe High & Low Indicator plots key levels (high, low, and average price) from a higher timeframe onto the current chart, aiding traders in identifying significant support and resistance zones.
The indicator also detects and labels breakout points and can display trend directions based on these higher timeframe levels breakout points.
Key Features:
◆ Higher Timeframe Levels:
Plots the high, low, and average price from a selected higher timeframe onto the current chart.
Extends these levels into the future for better visualization.
◆ Breakout Detection:
Identifies and labels breakouts above the higher timeframe high or below the higher timeframe low.
Breakout points are clearly marked with labels indicating "High Break" or "Low Break" with timeframe mark.
If the following break out type is the same that previous, it does not marked by labels, but still marked by bar color.
◆ Trend Visualization:
Optionally displays trend direction by changing bar colors and line styles based on breakout conditions.
Trend indication helps in identifying bullish or bearish market conditions.
◆ Support and Resistance Indication:
Marks support and resistance points with '◆' symbols when the current timeframe's high or low interacts with the higher timeframe's levels.
◆ Period separation:
Background color changes to indicate period separation if enabled.
◆ Inputs:
Extension to the right of High and Low: Sets the number of bars to extend the high and low lines into the future.
Timeframe: Selects the higher timeframe (e.g., Daily) to use for plotting high and low levels.
Period Separator: Toggles the visual separator for periods.
Show Trend?: Toggles the trend visualization, changing bar colors and plot styles based on breakouts.
Show Breakout Labels?: Toggles the Breakout Labels visualization.
Indicator Logic:
Historical vs. Real-Time Bars: Adjusts values based on whether the bar is historical or real-time to ensure accurate plotting.
High and Low Prices: Retrieves the high and low prices from the selected higher timeframe.
Breakout Conditions: Determines if the current price has crossed above the higher timeframe high (high break) or below the higher timeframe low (low break).
Color and Trend Logic: Adjusts colors and checks for breakouts to avoid multiple labels and indicate trend direction.
Usage Notes:
This indicator is ideal for traders looking to integrate multi-timeframe analysis into their strategy.
The higher timeframe levels act as significant support and resistance zones, helping traders identify potential reversal or continuation points.
The breakout labels and trend visualization provide additional context for trading decisions, indicating when the price has breached key levels and is likely to continue in that direction.
This indicator enhances chart analysis by providing clear, visual cues from higher timeframe data, helping traders make more informed decisions based on a broader market perspective.

🇨🇭Advanced Fusion MetricsIndicator Overview
The "Advanced Fusion Metrics Indicator" is a comprehensive trading tool designed for TradingView that combines several technical analysis methods to assist traders in identifying potential buy and sell opportunities in financial markets.
Key Components
Moving Averages (MA): Uses two Simple Moving Averages (SMA) with periods defined by the user (default 10 and 20). The indicator generates buy signals when the shorter MA (MA 10) crosses above the longer MA (MA 20) and sell signals when it crosses below, helping to pinpoint trend reversals.
Relative Strength Index (RSI): A momentum oscillator that helps identify overbought or oversold conditions, adding a layer of confirmation to the signals generated by the moving averages.
Exponential Moving Average (EMA 50): Used to gauge the medium-term trend direction. The color of the EMA line changes based on whether the trend is up (green) or down (red), providing a visual representation of the market trend.
Average True Range (ATR): This component measures market volatility. Signals are only generated when the ATR confirms significant market movement relative to the EMA50, enhancing the reliability of the signals during volatile conditions.
How It Works
Signal Generation: The core of the indicator is based on the crossover of two SMAs. A buy signal is issued when the short-term MA crosses above the long-term MA during sufficient market volatility (confirmed by ATR). Conversely, a sell signal is triggered when the short-term MA crosses below the long-term MA under similar conditions.
Trend Confirmation: The EMA50 helps confirm the broader market trend, while the ATR ensures that the crossover signals occur during periods of meaningful price movement, filtering out noise and less significant price movements.
Use Case
For Traders: The indicator is ideal for traders who need clear, actionable signals combined with an assessment of market conditions. It’s particularly useful in markets where understanding volatility and momentum is crucial, such as in cryptocurrencies and forex.
Benefits
Comprehensive Analysis: Combines trend, momentum, and volatility analysis in one tool, providing a multifaceted approach to the markets.
Enhanced Decision-Making: By integrating multiple indicators, it reduces the likelihood of false signals and enhances decision-making confidence.
Customizable and Dynamic: Allows for easy adjustment of parameters to fit different trading styles and market conditions.
This indicator equips traders with a powerful blend of tools to analyze price movements and make informed trading decisions based on a combination of trend, momentum, and volatility insights.

TheSandyBananaTheSandyBanana is a comprehensive trading indicator designed for various asset classes. It combines multiple technical analysis tools to provide buy and sell signals, aiding traders in making informed decisions. This script is suitable for traders who prefer a combination of trend-following and momentum strategies.
Features:
RSI-Based Signals: Utilizes a modified Relative Strength Index (RSI) with an extended period of 200 bars for smoothing, providing a less reactive but more stable momentum indicator.
RSI EMA: Applies an Exponential Moving Average (EMA) with a 100-bar period to the RSI, further smoothing the RSI and aiding in the identification of longer-term momentum trends.
ATR for Volatility Analysis: Employs the Average True Range (ATR) over a 100-bar period, adjusted with a multiplier of 1. This is used to gauge market volatility and filter signals based on market dynamics.
Peak and Trough Detection: Detects peaks and troughs in the RSI EMA using refined logic and a lookback period of 33 bars, helping in pinpointing potential reversal points.
Dynamic Buy and Sell Signals: Generates buy signals when a trough is identified, and the RSI is below 50, indicating potential upward momentum. Sell signals are generated at peaks when the RSI is above 50, suggesting possible downward momentum.
333-Period EMA: Features a long-term 3333-period EMA, plotted on the chart for trend analysis and potential dynamic support or resistance levels.
Alert Conditions: Includes conditions for buy and sell alerts, making it easier for traders to be notified of potential trading opportunities.
Usage:
This indicator is best suited for traders looking for a blend of trend and momentum analysis. The extended periods used in RSI and EMA calculations make this indicator more suitable for medium to long-term trading strategies. Traders should consider combining this indicator with other forms of analysis (like fundamental analysis or additional technical indicators) for comprehensive trading strategies.
Disclaimer:
Trading involves risk. This script is provided for informational purposes only and should not be considered as financial advice. Traders should always conduct their own due diligence and use the script in a simulated environment before applying it to live trading.

IchimokuBuy Sell With Stoch RSIIchimoku Kumo Cloud Crossover Indicator
The "Ichimoku Kumo Cloud Crossover" indicator is a custom technical analysis tool designed for use in the TradingView platform. This indicator is built to assist traders in identifying potential buy and sell signals based on a combination of Ichimoku Cloud analysis, Moving Average Convergence Divergence (MACD), Exponential Moving Average (EMA), Relative Strength Index (RSI), and Stochastic RSI.
Key Components and Parameters:
Ichimoku Kumo Cloud Calculation:
The Ichimoku Kumo Cloud is calculated using the Ichimoku Cloud's Conversion Line and Base Line.
Conversion Line, Base Line, Leading Span 1, and Leading Span 2:
These are key components of the Ichimoku Cloud, and they help identify trends and potential support/resistance levels in the market.
MACD Oscillator:
The Moving Average Convergence Divergence (MACD) is used to gauge the strength and direction of the trend.
EMA 200 (Exponential Moving Average):
The EMA 200 is a long-term moving average used to identify the overall trend direction.
RSI (Relative Strength Index):
The RSI is a momentum oscillator that measures the speed and change of price movements, helping to identify overbought and oversold conditions.
Stochastic RSI (Stoch RSI):
Stoch RSI is calculated based on the RSI values and helps to identify overbought and oversold conditions in a more dynamic manner.
Signal Generation:
The indicator generates buy and sell signals based on the following criteria:
Buy Signal (Long Position):
The Conversion Line crosses above the Base Line (Ichimoku Cloud crossover).
The closing price is above the EMA 200, indicating a bullish bias.
The RSI is between 50 and 70, suggesting the potential for an uptrend.
The MACD Histogram is positive, indicating increasing bullish momentum.
The high price is at least 25% above the EMA 200.
Sell Signal (Short Position):
The Conversion Line crosses below the Base Line (Ichimoku Cloud crossover).
The closing price is below the EMA 200, indicating a bearish bias.
The RSI is between 20 and 50, suggesting the potential for a downtrend.
The MACD Histogram is negative, indicating increasing bearish momentum.
The low price is at least 25% below the EMA 200.
Stoch RSI Filter:
Additionally, a filter based on Stoch RSI slope is applied. The indicator will only open a position if the Stoch RSI is declining for short positions (sell) and rising for long positions (buy).
Visualization:
Buy signals are marked with green triangles below the bars.
Sell signals are marked with red triangles above the bars.
The Ichimoku Cloud is plotted in the background, with cloud colors changing based on whether the Conversion Line or Base Line is higher.
This indicator can be a valuable tool for traders looking to combine multiple technical analysis techniques to make informed trading decisions in the financial markets.