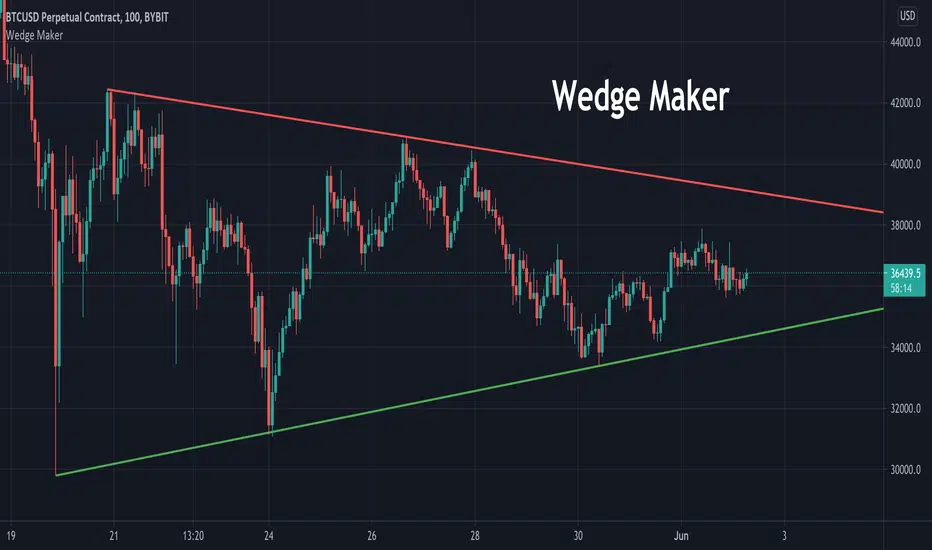
Wedge MakerThis tool is used to draw wedges. Traders can choose which pivot points to draw lines from in settings. Wedge Maker does not automatically detect current wedge and is required to be tweaked in settings.Wskaźnik Pine Script®od veryfid3232 4 K
Support and Resistance V1 This script is based on Range Support and Resistance . It works by taking the range of the day,week and month calculating them and plotting 3 layers of Support and Resistance , as soon as it gets non directional /range bound , bar color turns GRAY if its in Bullish Trend and Pink if its in Bearish Trend .. As soon as bar turns Aqua it defines BULLISH Trend and RED bar color defines Bearish Trend . This way you can easily visualize the areas of support and resistance . ----------------- Disclaimer Copyright by FaizanNawazz. The information contained in my scripts/indicators/strategies/ideas does not constitute financial advice or a solicitation to buy or sell any securities of any type. I will not accept liability for any loss or damage, including without limitation any loss of profit, which may arise directly or indirectly from the use of or reliance on such information. All investments involve risk, and the past performance of a security, industry, sector, market, financial product, trading strategy, or individual’s trading does not guarantee future results or returns. Investors are fully responsible for any investment decisions they make. Such decisions should be based solely on an evaluation of their financial circumstances, investment objectives, risk tolerance, and liquidity needs. My scripts/indicators are only for educational purposes! Happy Trading!Wskaźnik Pine Script®od FaizanNawazzZaktualizowano 13
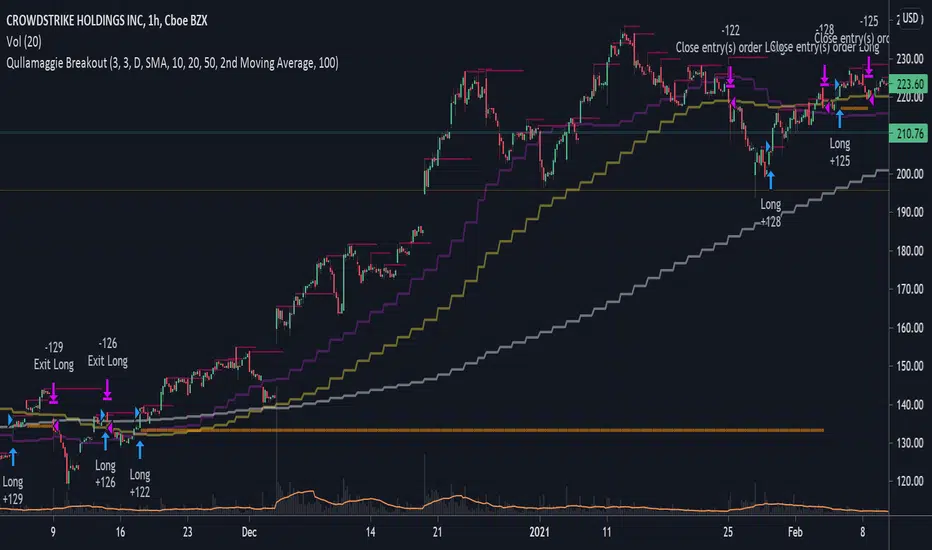
Qullamaggie BreakoutThe intent of this strategy is to buy breakouts with a tight stop on smaller timeframes in the direction of the longer term trend. Default longer term trend is the daily, but the user can choose any timeframe to use for the SMAs (which act as filters and trailing stops). Exit the trade using a trailing stop of a close below either the 10 MA or 20 MA (user choice) on that larger timeframe as the position moves in your favor (i.e. whenever position price rises above the MA). This is one area where this script could use a little work or some human intervention - when the trade is entered right in the vicinity of the moving averages, you get some whipsaw. Not sure how to avoid that at this point though if you want to look at those longer term moving averages as your exit criteria. Option of using daily ATR as a measure of finding contracting ranges and ensuring a decent risk/reward. (If the difference between the breakout point and your stop level is below a certain % of ATR, it could possibly find those consolidating periods.)Strategia Pine Script®od millerrh66672
Best Bulls Bears Volume trend Breakout V2 [badshah_e_alam]This is a intraday indicator. Only to be used on timeframe less than daily charts. This indicator purely uses volume to plot the graph. The indicator helps in conforming a breakout strategy. This indicator is advanced version of my previously developed indicator you can check this link Total volume is made up of buying volume and selling volume . Buying volume is the number of shares, contracts, or lots that were associated with green bars, and selling volume is the number that were associated with red bars. The labels on the right side are the current bar value and that days bulls /bears weightage. the first value shows the current bar volume. second value show the bulls weight in % third value show the bears weightage throughout the day ( %) The Blue plot in graph keeps the track of bulls movement in intraday( %) The Red plot in graph keeps the track of bears movement in intraday ( %) X axis is time. Y axis ranges from 100 to -100 I use 1:2 risk to reward ratio. Do your own research. **not a financial advice** Example of price increasing, volume decreasing this indicator can be used for confirming a breakout strategy with bulls or bears in action. In the current example, the buyer’s volume percentage is reducing and the price is increasing throughout the day. Hence a breakout of the trendline is confirmation of a short trade. Example of Price reducing, volume decreasing example of price moving down , bears losing the grip Example of price decreasing volume increasing Thanks to nizar9599 for giving idea to improve my previous indicator. DISCLAIMER Any and all liability for risks resulting from investment transactions or other asset dispositions carried out by the user based on information received or a market analysis is expressly excluded by me. All the information made available here is generally provided to serve as an example only, without obligation and without specific recommendations for action. It does not constitute and cannot replace investment advice. We therefore recommend that you contact your personal financial advisor before carrying out specific transactions and investments. Do your own research, This is not a financial advice. Wskaźnik Pine Script®od TJalamZaktualizowano 5656 1.6 K
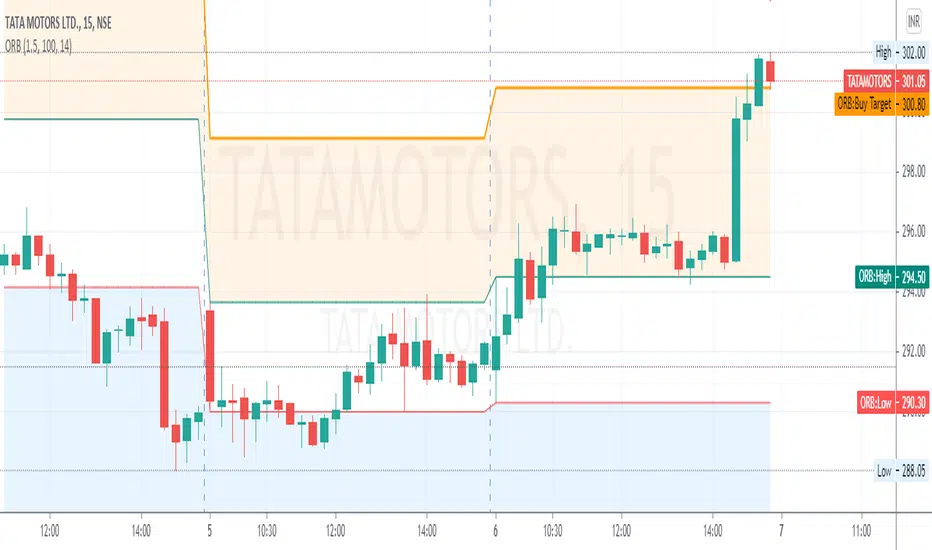
Open Range Breakout with TSLThis ORB with TSL Indicator Session Time is Indian NSE and BSE Equity Market This indicator Provide you 2 type Setup Opening Range Plot Only for Observation 1st Range Breakout = Long 2nd Range Breakout = Short How to work This Indicator? When Market is Open This Indicator automatically Plot Opening Range High and Low, if Market bullish & Candle Close above Opening Range high When This Indicator automatically Plot 1st Range High and Low if You Want to 1st Range High Plot Crossingup any Candle You can Also Add Alerts if Market Bearish & Candle Close Below Opening Range Low When This Indicator automatically Plot 2nd Range High and Low if You Want to 2nd Range Low Plot CrossingDown any Candle You can Also Add Alerts If you Have any Suggestion please mention here Thank you so much This Also Automatically start trailing SL on basis of ATR Wskaźnik Pine Script®od u_jalanZaktualizowano 2020605
Matze BreakoutShows 2 different states of breakout: Arrow = unusual volume, raising volume, positiv rate of change, standard deviation breakout Bolt = very unusual volume, very high standard deviation breakoutWskaźnik Pine Script®od derMatzeImNetzZaktualizowano 22177
ORB Current Timeframe + ATRThis is Indicator 1. Opening Range Breakout for Selected Time frame 2. You can fix your Risk Reward and also Risk Amount 3. It will calculate the Position size based on Open Range ATR and your Risk Amount 4. Display's the Daily ATR for Given Input 5. It Gives Opening ATR Percentage to take a trade or not 6. It Calculates the Target on Either Side Based on the Risk RewardWskaźnik Pine Script®od LetsBeatThis-One1195
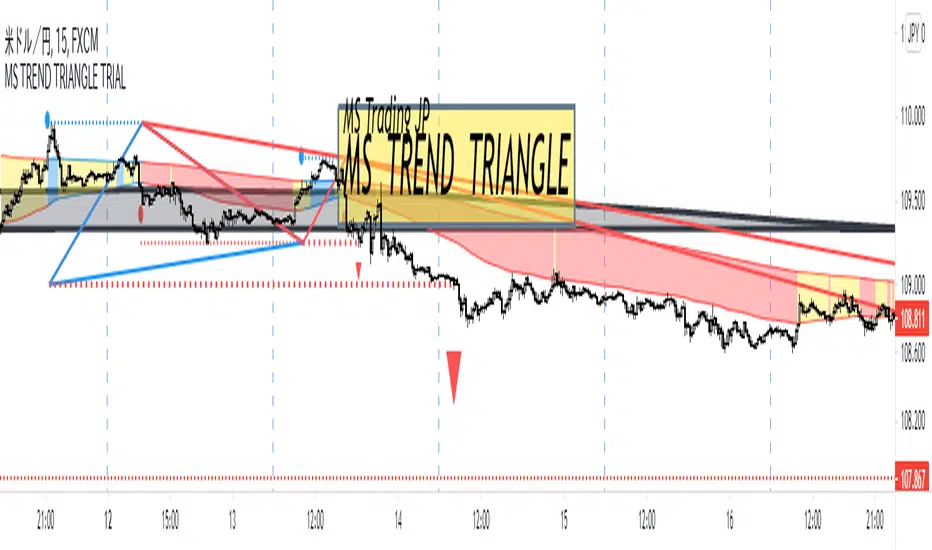
MS TREND TRIANGLE TRIAL(15M ONLY)- This is Beta Trial version for only 15m time frame. - MS TREND TRIANGLE will help analizing trend condition and trade points. - Detailed How to things will be coming later. - Recent bottom(not top) prices going up (B > C) Wskaźnik Pine Script®od MS_Trading_JP8889
MS TREND TRIANGLE TRIAL ver- This is a trial version for only 15m time frame. - MS TREND TRIANGLE can analyze price trend condition and show it as Blue and Red triangles. - Combination of other drawings, you can imagine the trade point and even loss cut point if the price goes opossite. - HOW TO and detailed information will be coming soon. (If you have any question, please leave your message.) < BASIC INFORMATION > Enjoy trading! Thank you(*^-^*) Wskaźnik Pine Script®od MS_Trading_JP9916
CCI Breakout TraderWorks well on Bitcoin or most altcoins on a 15min chart or higher. What is this exactly? This is an indicator that uses horizontal RSI + EMA lines with a CCI line on top of it to provide optimal entry and exit positions for trading. There is also a breakout indicator based on the width of Bollinger Bands. How to use: If the blue stream passes upwards on the red heading to the white - it's heading towards a good BUY signal. To be safe you wait until it passes above the white line, then BUY LONG. Another signal to buy long is when the blue stream passes above the white and green lines. Selling is essentially the opposite, if the blue stream is passing down from the green or white lines, then it's time to sell and exit your trade. If you need help knowing when to enter and exit a trade the indicator will draw a grey candle on your chart to signal it's time to exit a long trade and it will draw a purple candle when it's time to enter a long. -- Breakout alert: If you see a green vertical bar it's a warning that there is a potential breakout in price coming for whichever coin you are looking at. The price breakout could go either direction, so make sure you watch the blue stream. -- Important tips: The direction of the green/white/red lines are important - if they are heading down that means it might not be the best time to enter your trade, even if the blue stream crosses up on the red and/or white lines. The colored horizontal lines are there to let you know if the blue stream is near the bottom of those lines (anywhere from hline 15 to 50) and heading upwards, you will more likely have a longer positive trade. If the blue stream is above 60 hline and it looks like a good trade (passing up on the red and white lines), expect to have a shorter trade. I use this for swing trading various crypto currencies, once you learn how to read it, you can catch amazing uptrends really early and you can exit trades before some big drops happen.Wskaźnik Pine Script®od mmoiwgg33240
72s Strat: Backtesting Adaptive HMA+ pt.1This is a follow up to my previous publication of Adaptive HMA+ few months ago, as a mean to provide some kind of initial backtesting tools. Which can be use to explore many possible strategies, optimise its settings to better conform user's pair/tf, and hopefully able to help tweaking your general strategy. If you haven't read the study or use the indicator, kindly go here first to get the overall idea. The first strategy introduce in this backtest is one most basic already described in the study; buy/sell is when movement is there and everything is on the right side; When RSI has turned to other side, we can use it as exit point (if in profit of course, else just let it hit our TP/SL, why would we exit before profit). Also, base on RSI when we make entry, we can further differentiate type of signals. --Please check all comments in code directly where the signals , entries , and exits section are. Second additional strategy to check; is when we also use second faster Adaptive HMA+ for exit. So this is like a double orders on a signal but with different exit-rule (/more on this on snapshots below). Alternatively, you can also work the code so to only use this type of exit. There's also an additional feature which you can enable its visuals, the Distance Zone , is to help measuring price distance to our xHMA+. It's just a simple atr based envelope really, I already put the sample code in study's comment section, but better gonna update it there directly for non-coder too, after this. In this sample I use Lot for order quantity size just because that's what I use on my broker. Also what few friends use while we forward-testing it since the study is published, so we also checked/compared each profit/loss report by real number. To use default or other unit of measurement, change the entry code accordingly. If you change your order size, you should also change the commission in Properties Tab. My broker commission is 5 USD per order/lot, so in there with example order size 0.1 lot I put commission 0.5$ per order (I'll put 2.5$ for 0.5 lot, 10$ for 2 lot, and so on). Crypto usually has higher charge. --It is important that you should fill it base on your broker. SETTINGS I'm trying to keep it short. Please explore it further again. (Beginner should also first get acquaintance with terms use here.) ORDERS: Base Minimum Profit Before Exit: The number is multiplier of ongoing ATR. Means that when basic exit condition is met, algo will check whether you're already in minimum profit or not, if not, let it still run to TP or SL, or until it meets subsequent exit condition, then it will check again. Default Target Profit: Multiplier of ATR at signal. If reached before any eligible exit condition is met, exit TP. Base StopLoss Point: You can change directly in code to use other like ATR Trailing SL, fix percent SL, or whatever. In the sample, 4 options provided. Maximum StopLoss: This is like a safety-net, that if at some point your chosen SL point from input above happens to be exceeding this maximum input that you can tolerate, then this max point is the one will be use as SL. Activate 2nd order...: The additional doubling of certain buy/sell with different exits as described above. If enable, you should also set pyramiding to at least: 2. If not, it does nothing. ADAPTIVE HMA+ PERIOD Many users already have their own settings for these. So in here I only sample the default as first presented in the study. Make it to your adaptive. MARKET MOVEMENT (1) Now you can check in realtime how much slope degree is best to define your specific pair/tf is out of congestion (yellow) area. And (2) also able to check directly what ATR lengths are more suitable defining your pair's volatility. DISTANCE ZONE Distance Multiplier. Each pair/tf has its own best distance zone (in xHMA+ perspective). The zone also determine whether a signal should appear or not. (Or what type of signal, if you wanna go more detail in constructing your strategy) USAGE (Provided you already have your own comfortable settings for minimum-maximum period of Adaptive HMA+. Best if you already have backtested it manually too and/or apply as an add-on to your working strategy) 1. In our experiences, first most important to define is both elements in the Market Movement Settings . These also tend to be persistent for whole season since it's kinda describing that pair/tf overall behaviour. Don't worry if you still get a low Profit Factor here, but by tweaking you should start to see positive changes in one of Max Drawdown and Net Profit, or Percent Profitable. 2. Afterwards, find your pair/tf Distance Zone . When optimising this, what we seek is just a "not to bad" equity curves to start forming. At least Max Drawdown should lessen more. Doesn't have to be great already, but should be better, no red in Net Profit. 3. Then go manage the "Trailing Minimum Profit", TP, SL, and max SL. 4. Repeat 1,2,3. 👻 5. Manage order size, commission, and/or enable double-order (need pyramiding) if you like. Check if your equity can handle max drawdown before margin call. 6. After getting an acceptable backtest result, go to List of Trades tab and find the biggest loss or when many sequencing loss in a row happened. Click on it to go to exact point on chart, observe why the signal failed and get at least general idea how it can be prevented . The rest is yours, you should know your pair/tf more than other. You can also re-explore your minimum-maximum period for both Major and minor xHMA+. Keep in mind that all numbers in Setting are conceptually in a form of range . You don't want to get superb equity curves but actually a "fragile" , means one can easily turn it to disaster just by changing only a fraction in one/two of the setting. --- If you just wanna test the strength of the indicator alone, you can disable "Use StopLoss" temporarily while optimising settings. Using no SL might be tempting in overall result data in some cases, but NOTE: It is not recommended to not using SL, don't forget that we deliberately enter when it's in high volatility. If want to add flexibility or trading for long-term, just maximise your SL. ie.: chose SL Point>ATR only and set it maximum. (Check your max drawdown after this). I think this is quite important specially for beginners, so here's an example; Hypothetically in below scenario, because of some settings, the buy order after the loss sell signal didn't appear. Let's say if our initial capital only 1000$ using leverage and order size 0,5 lot (risky position sizing already), moreover if this happens at the beginning of your trading season, that's half of account gone already in one trade . Your max SL should've made you exit after that pumping bar. The Trailing Minimum Profit is actually look like this. Search in the code if you want to plot it. I just don't like too many lines on chart. To maximise profit we can try enabling double-order. The only added rule coded is: RSI should rising when buy and falling when sell. 2nd signal will appears above or below default buy/sell signal. (Of course it's also prone to double-loss, re-check your max drawdown after. Profit factor play its part in here for a long run). Snapshot in comparison: Two default sell signals on left closed at RSI exit, the additional sell signal closed later on when price crossover minor xHMA+. On buy side, price haven't met our minimum profit when first crossunder minor xHMA+. If later on we hit SL on this "+buy" signal, at least we already profited from default buy signal. You can also consider/treat this as multiple TP points. For longer-term trading, what you need to maximise is the Minimum Profit , so it won't exit whenever an exit condition happened, it can happen several times before reaching minimum profit. Hopefully this snapshot can explain: Notice in comparison default sell and buy signal now close in average after 3 days. What's best is when we also have confirmation from higher TF. It's like targeting higher TF by entering from smaller TF. As also mention in the study, we can still experiment via original HMA by putting same value for minimum-maximum period setting. This is experimental EU 1H with Major xHMA+: 144-144, Flat market 13, Distance multiplier 3.6, with 2nd order activated. Kiwi was a bit surprising for me. It's flat market is effectively below 6, with quite far distance zone of 3.5. Probably because I'm using big numbers in adaptive period. --- The result you see in strategy tester report below for EURUSD 15m is using just default settings you see in code, as follow: 0,1 lot for each order (which is the smallest allowed by my broker). No pyramiding. Commission: 0.5 usd per order. Slippage: 3 Opening position is only using basic strategy #1 (RSI exit). Additional exit not activated. Minimum Profit: 1. TP: 3. SL use: Half-distance zone. Max SL: 4.5. Major xHMA+: 172-233. minor xHMA+: 89-121 Distance Zone Multiplier: 2.7 RSI: Standard 14. (From our forward-testing, the difference we get from net profit is because of the spread, our entry isn't exactly at the close/open price. Not so much though, but not the same. If somebody can direct me to any example where we can code our entry via current bid/ask price, that would be awesome!) It's already a long post (sorry), think I'm gonna pause here. Check out the code :) --- DISCLAIMER: Past performance is no guarantee of future results , and so on.. you know the drill ;) Please read whole description first before using, don't take 1-2 paragraph and claim it's the whole logic, you are responsible of your own actions and understanding. Strategia Pine Script®od io72signalsZaktualizowano 5858 4.5 K
A Better Fractal (Williams)DESCRIPTION: This is a more advanced version of the classic Williams Fractal algo, using a looped barindex iterator to examine highs/lows. You may choose ideal or regular fractals, along with the amount of bars (periods) used to calculate; the minimum being 3. Oddnums only. Ideal fractals = fractals with each bar needing to be lower/higher than the preceding bar, with the midbar at the apex. Regular fractals = the typical Williams fractal, wherein each bar only has to be lower/higher than the midbar (apex) only. How to trade? Combine with other indicators and use breakout or reversal strategies, typically. Set buy/sell stops at the high/low of a fractal, for instance ... to trade the breakout when it occurs. Or, track momentum when a fractal prints and trade accordingly. Or perhaps trade with the alligator or 3 EMA. Experiment with different types of fractals to achieve the desired result, with higher period fractals obviously offering more solid indication though with higher lag. Note: A fractal does not print until n/2 (rounded down) bars after, where n = the period you chose.Wskaźnik Pine Script®od EclipsePhage1166
Compressed Volume Levels [DepthHouse]Compressed Volume Levels closely analyzes peak volume along with price action to detect critical levels. The compression levels generated are often an early indication of possible tops, bottoms, or even a future support or resistance levels. Warning: Since this is a volume based indicator results will vary based on the asset and volume of the exchange. The factor & lookback at which it detects these levels can be set by the user. The lower the factor the more levels that will generate. Built in Alerts (must be set up by user): Verified Support and Resistance once a level is confirmed. Upward and Downwards Compression alerts; earliest signal possible for major volume coming in. To gain access to this indicator please follow the link below. Feel free to message me with any questions directly here on TradingView.Wskaźnik Pine Script®od oh921313141
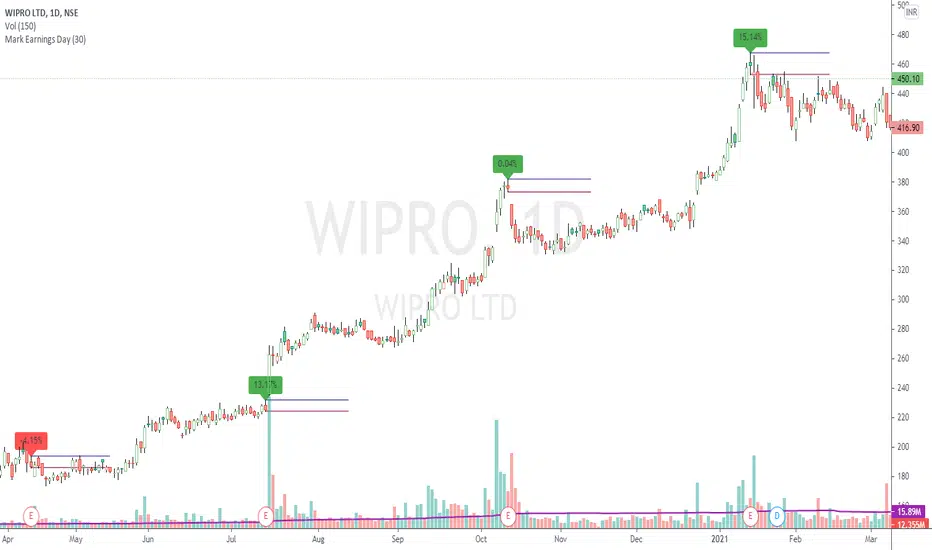
Mark Earnings DayThe idea for today is to plot high / low prices on the Earnings day. (use only on Daily timeframe) And as we all know, most of the times, price is unidirectional after the earnings are declared. A target of 1:2 or even 1:5 can be easily achieved in these cases, within few days. Green label indicates, reported earnings are higher than estimated. Red indicates the other way. But 1, this does not necessarily indicate the trend direction. But 2, a breakout / breakdown of this day's candle mostly does. The other serving as a Stop Loss. Optionally, the scripts can also plot splits and dividends on the charts. The difference between this indicator and readily available default markings on the chart is, these figures are directly available on the chart itself, that saves multiple clicks.Wskaźnik Pine Script®od SushilKothawade77262
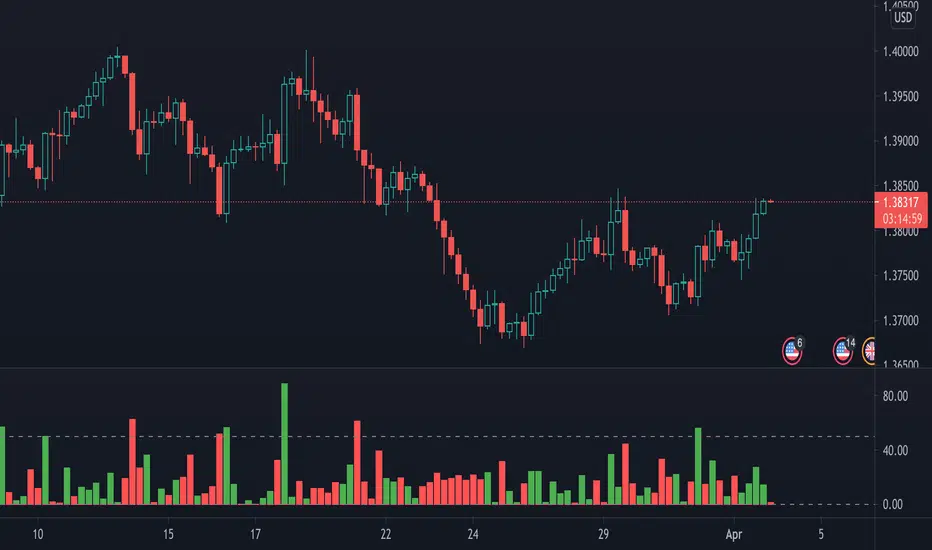
Volume Positive Negative (VPN) [LevelUp]The idea and calculations for the Volume Positive Negative (VPN) indicator were created by Markos Katsanos. Markos wrote about the indicator in the article Detecting High-Volume Breakouts, published in Technical Analysis of Stocks & Commodities April, 2021 (Vol. 39, Issue 5). The goal of the VPN indicator is to detect breakouts using only volume. The basic idea is to compare volume on up days versus volume on down days. The indicator can oscillate between the range of -100 and 100. Values between 0 and 20 are generally considered bullish, negative are bearish. When the plotted VPN crosses over what Markos refers to as the critical value, that may indicate a high volume breakout. The critical value can be adjusted between 0 to 20, 10 is the default, Volume Positive Negative Calculation (VPN) VPN = (VP - VN) / MAV / Period * 100 VP - sum of positive volume VN - sum of negative volume MAV - moving average of volume Volume is considered positive when the average price is higher than the previous day's price by more than .1 of the ATR (average true range). Wskaźnik Pine Script®od LevelUpToolsZaktualizowano 2828 1.7 K
Trend ResumptionWe again keep it really simple. This indicator just plots the combination of RGRR and GRGG candlesticks. (R = Red / Bearish, G = Green / Bullish) When either pattern occurs, trade the combined high and combined low of recent 2 RR or recent 2 GG candles. I.e., Buy above GG's high with SL at GG's low. Sell below RR's low with SL at RR's high. Refer the shared chart for example. The signals were plotted on both the sides, and wherever triggered - gave rewards. Only 1 at 05-Apr, 10:50 a.m. did not trigger, but that must then be ignored. Do not hurry to enter the trade, wait for breakout / breakdown above combined high / low.Wskaźnik Pine Script®od SushilKothawade1616448
Trend Surfers - Premium Breakout + AlertsTrend Surfers - Premium Breakout Strategy with Alerts I am happy today to release the first free Trend Surfers complete Breakout Strategy! The strategy includes: Entry for Long and Short Stoploss Position Size Exit Signal Risk Management Feature How the strategy works This is a Trend Following strategy. The strategy will have drawdowns, but they will be way smaller than what you would go through with buy and old. As a Trend Following strategy, we will buy on strength, when a breakout occurs. And sell on weakness. The strategy includes a FIX Stoploss determined by an ATR multiple and a trailing Stoploss/Takeprofit also determined by an ATR multiple. You can also manage your risk by entering the maximum % you are willing to risk on every trade. Additionally, there is an option to enter how many pairs you will be trading with the strategy. This will change your position size in order to make sure that you have enough funds to trade all your favorite pairs. Use the strategy with alerts This strategy is alert-ready. All you have to do is: Go on a pair you would like to trade Create an alert Select the strategy as a Trigger Wait for new orders to be sent to you Every Entry (Long/Short) will include: Market Entry (Enter position NOW!) Stoploss price Position Size Leverage * If you do not wish to use leverage, you can multiply the Position Size by the Leverage. But doing that, you might end up with a position greater than your equity. Trading on Futures is better in order to have accurate risk management. Exit signals: When you receive an exit signal, you need to close the position ASAP. If you want to keep your results as close as possible to the backtest results, you need to execute quickly and follow what the strategy is telling you. Do not try to outsmart the strategy Leave your emotion out of trading! If you trust the strategy, you will have way better returns than if you try to outsmart it. Follow each signal you receive even if it doesn't seem logical at the moment. Become a machine that executes. Don't look at fundamentals. Follow the trend! Trust the strategy! I hope you enjoy it!Strategia Pine Script®od TrendSurfersSignalsZaktualizowano 2525 2.2 K
MM Session Open AlgoThe MM Session Open Algo is a strategy to catch the opening breakout of a security displays the current session with background color Entry, Stop Loss Based on Atr, and two Take Profit levels Kill zone entries for New york and London session provides valid signal for entry once price crosses entry line and set "opening session price" to determine what signal you are looking for. based on time frame shows the Daily,Weekly,Monthly high and low average daily range and comes with trend filter. Directions are Simple when price crosses and closes above entry line. you get in with the set inputs of Tp and Sl or you can set buy/sell stops with the price provided for you and ride the wave of the direction it goes with he Tp and Sl provided Link below or PM us for access to this indicator Happy TradingWskaźnik Pine Script®od MoneyMovesInvestments1163
Pips Breakout CandlePips Breakout Candle measures price changes in pips. This indicator can be used to identify major price moves! The indicator comes with a sentiment line which is the sum of the Up versus Down price changes. It gives a good understanding of the current trend and identifies divergences. Set alerts for major price moves! Identify the trend! Identify divergence! Wskaźnik Pine Script®od ProValueTrader22360
Break of structure (BOS) forex StrategyPlease read all Details before using this indicator This strategy is based on taking position after the break of a Previous High/Low swing happens (fixed time frame), the break of structure happens because of the swing happens then we go long or short respectively in this strategy. I will be discussing the setting details through which you can make it work on different forex pairs. Does it work on other pairs? Yes, I have found similar back test results on other USD pairs. Does it works on smaller time frame? Yes it does work on smaller time frame , you have to understand the below concepts used and try different settings. For the user the most important thing is to understand the settings of the indicator so that they can optimize the setting and get the best results: This indicator contains the following IMPORTANT setting: i. Fixed trading session for long trades (long position can be taken in that period of time only) ii. Fixed trading session for short trades (Short position can be taken in that period of time only) The concept behind restricting the time to go long or short is because in forex the particular pair move in a particular direction depending upon the currency and time zones. This strategy works on different forex pairs, you need to find the best settings. I will be providing the best settings which works for this strategy and different pairs. 2. Choose Previous High/Low Timeframe This is the most important option where you have to choose the timeframe for which you want H/L by default it is set to “D”. This timeframe H/L reference will be taken for taking trading decisions. 3.Setting for back test selection date range you can check the beck test of a particular time range. 4.You can check Long and Short positions performance separately, by unchecking the “Go_long” option it will remove all long positions from back test. Vice versa for “Go_short option” 5.Internal Bar Strength IBS is simply an indicator where you buy on weakness and sell on strength, the cornerstone of any mean-reverting strategy. It oscillates from zero to one and measures the relative position of the closing price relative to the High and Low. IBS = (Close – Low) / (High – Low) In the input setting the you can disable enable the IBS option from the strategy. 6. Parkinson volatility Parkinson volatility is a volatility measure that uses the stock’s high and low price of the day (can be changed in the setting, instead of day it can be set to any bar length) The main difference between regular volatility and Parkinson volatility is that the latter uses high and low prices for a day, rather than only the closing price. In the setting you have three option i. Enter Volatility Threshold If the Parkinson volatility value is greater than the the threshold value then it lets the trade happen. ii.Set the high/low bar time frame for calculating Parkinson volatility. ( Set 60m by default) Formula used as below: high_=security(syminfo.ticker, input("60"), high) low_=security(syminfo.ticker, input("60"), low) hourlyRangeSquared = pow((log(high_) - log(low_)), 2) dailyParkinsonVol = sqrt(sum(hourlyRangeSquared, 24) / (4 * log(2))) 7. "Enter no of contract size" This setting helps you to set the contract size , by default it is set to 100000. 8. “Zigzag Filter Length” this setting is for SWING H/L Lookback. With the help of this I have ploted Swing Support and Resistance. 9.Futrther confirmation of trade is done through the RSI criteria. In this I have provided four kind of RSI confirmation you can test all by selecting any one of the four. i. filter trade on the basis of BB of RSI (as shown in the image) ii. filter trade on the basis of RSI Levels (RSI>50 for long, vice versa for short) iii. filter trade by rsi>basis of BB of RSI(for long) & rsi<50(for short) iv. filter trade by rsi>50(long) & rsi< basis of BB of RSI(short) SELECT ONLY ONE OF THE ABOVE IN SETTING. 10.For Exiting the trade I have used the trailing SL you can change it in setting. You can exit the trade using two targets (two take profit) using different size for exiting the trade. If you want to take only on target then you have to make QANTITY of shares for 1st Exit as 100. Then you will exit all your position in the first target. A big thanks to kodify.net there articles are very helpful kodify.net Thanks to Mickey for providing assistance. Thanks to stack overflow community for clearing the doubts. Trading view official documentation on V4 of pine script also helped me. Strategia Pine Script®od TJalamZaktualizowano 125125350
Pivot Points AlgoThis is a Pivot Points Algo (PPA). PPA uses an adaptive pivot algorithm that adapts to different market situations based on various factors. PPA also includes depth filtering to make it more precise at its signal decision. ======= Signal Types ====== Main Signal of BUY and SELL shown by buy/sell labels. Mini Signals of BUY and SELL shown by buy/sell arrows and shows additional breakouts after the Main Signal occurred. Optional reversal signals show a possible reversal in trend (small triangle). ======= Alerts ======= Main Signals alerts - Alerts when a main Buy or Sell is triggered (Shown as Labels). Combo Alerts - Alerts when main or mini signals of Buy and Sell are triggered (Shown as Arrows). ======= Assets and Time frames ======= Can be used on various assets, stocks, forex, crypto and works great for day trading as well as swing trading and long term investing. PPA is designed to adjust to any time frame! ======= General info ======= The purpose of this indicator is to signal possible breakouts with a high rate of success. PPA has been extensively tested and fine tuned to provide traders and investors with a valuable tool for timing long and short entries. However, no system is 100% perfect, and it is good practice to have a plan in place and use stop losses or other tools to mitigate unforeseen risk. Also, note, I don't hide what PPA is doing as opposed to some other commercial indicators on the market. You can view pivot lines and pivot bands and so on. The magic is the inner system itself which works for you to pinpoint the best entrance possible, I recommend confirming your own methods to make sure you want to take the trade. To subscribe to Pivot Points Algo service see “Author's instructions” below. For any question you can PM me. Happy and profitable trading! Wskaźnik Pine Script®od dman103Zaktualizowano 177177653
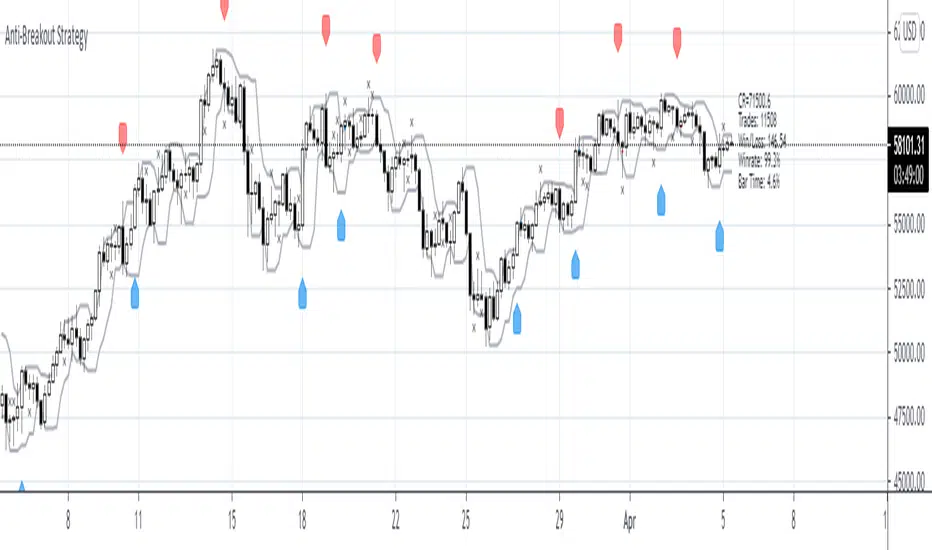
Anti-Breakout StrategyAnti-Breakout Strategy Description: This is a contrarian entry strategy for trading false breakouts. The high/low of the breakout bar is used for the entry in the opposite direction. To reduce repainting set ptype variable to OHL3.Wskaźnik Pine Script®od capissimoZaktualizowano 3535 1.3 K
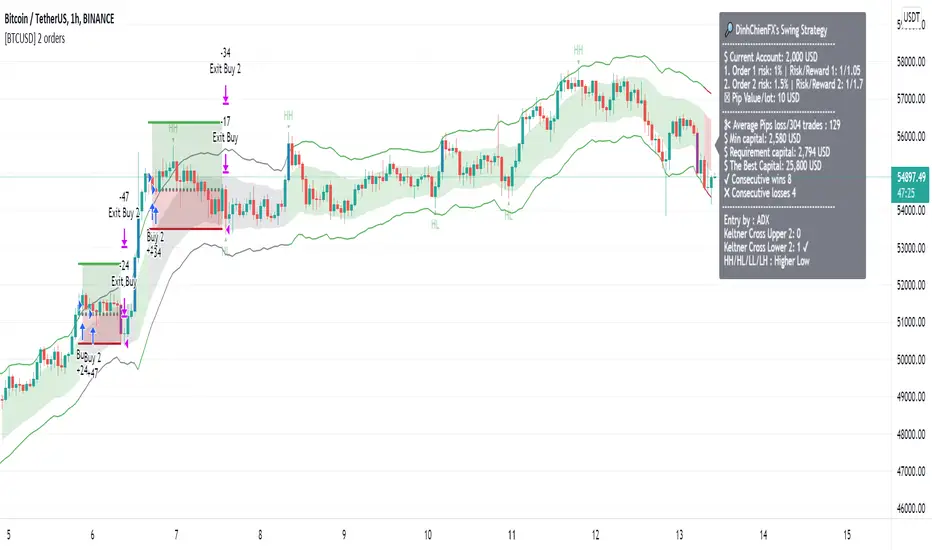
[BTCUSD] DinhChienFX [2 orders]* Historical statistics from 2018: * Strategy will enter 2 orders, Order 2 will appear only when there is Order 1: - Percent profitable of 1st order: 64.76%. - Percent profitable of 2nd order: 49.86%. - Average percent profitable: 57.31%. - 14 consecutive wins. - 4 consecutive losses. Order 1: risk / reward ratio 1/1 used to determine if this rule is effective or not? Order 2: Appears when there is order 1, Use take-profit and take-loss level of order 1 at Fibonacci 75%. . * 1st Order conditions: - Buy: When the ADX index cuts up to 45, check earlier if the closing price has cut up and is above the Upper 2 line, enter the Buy order. - Sell: when the ADX indicator cuts up to 45, check before that if the closing price has cut down and is above Lower 2 then enter a Sell order. * How to enter Order 2: When order 1 appears, there are always Stoploss and Takeprofit levels. Draw Fibonacci from take-profit and take-loss prices, Fibonacci retracement level = 75% ---------------- 1. Trend identification: - Channel Keltner: ... Uptrend: when the closing candlestick cuts up and is above the Keltner channel, the Upper Line 2 ... Down trend: when the candle closes and falls above the Keltner Line Lower 2 2. Rules of entry: - Channel Keltner: ... Buy: Candlestick closing price cuts up and above the Keltner Upper 2. ... Sell: The closing price of the candle cuts down and is lower than the Keltner Below 2. ADX indicator: ... Buy: The ADX value crossed to 45 and the close of the candle was higher than Keltner Upper 2. ... Sell: ADX value cuts to 45 and the close of the candle is lower than Keltner Below 2. 3. Stoploss and Profit = atr (20) * 2.Strategia Pine Script®od dinhchienZaktualizowano 1115