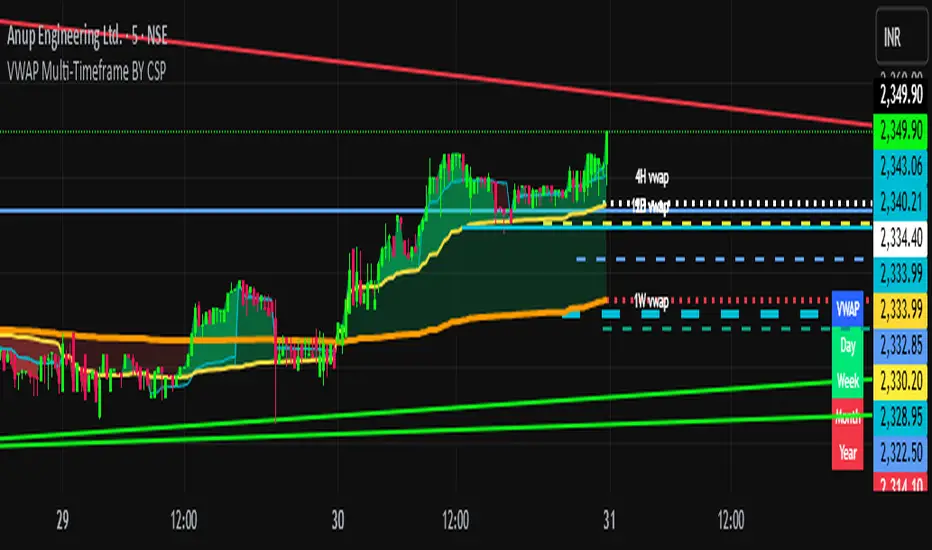
MARA + IREN / BTC Divergence Monitor (v6, fixed)This indicator tracks the relative performance of two major Bitcoin miners — MARA (Marathon Digital Holdings) and IREN (Irene Energy) against Bitcoin (BTC). It calculates smoothed ratios (Miner Price ÷ BTC Price) for each miner and automatically detects divergences and convergences between them.
Wskaźniki rozpiętości rynku

Addikro_V1📌 Description – Trend+Entry+Risk Indicator
This indicator combines statistically proven trading concepts into a complete trading framework:
✅ Trend Filter (EMA200)
All trades follow the higher-timeframe trend. Trend direction is clearly visualized.
✅ Entry Signals (you can choose):
EMA Crossover (EMA50 crossing EMA200) — classic trend-following entry
Breakout of recent highs/lows (20-bar range) — optionally only valid after a pullback to EMA50
✅ ATR-Based Risk Management:
Dynamic Stop Loss (SL) and Take Profit (TP1/TP2) levels using ATR
The last entry is saved — SL/TP lines stay visible on the chart
Optional position size suggestion based on % risk of account
✅ Smart Filters for Higher Accuracy:
RSI filter: e.g., only long if RSI > 50
Volume filter: signal only if volume is above SMA × multiplier
✅ Fixed Chart HUD (Table Overlay):
Displays live information anchored to the chart (does not move with candles)
Shows: Trend direction, entry mode, RSI, ATR, SL/TP multiplier, position size suggestion
Position can be set: top-left / top-right / bottom-left / bottom-right
✅ Signals & Alerts:
Visual arrows on the chart for long/short signals
Custom alert conditions included (works with mobile, email, webhook, bots)
🎯 Why this indicator works
It follows the same logic used by many successful systematic and hedge fund strategies:
Trend direction + statistically solid entries + strict risk management → no repainting, no guessing, no emotion.

Jitendra Volume Pro / Fixed RangeHello All,
This script calculates and shows Volume Profile for the fixed range. Recently we have box.new() feature in Pine Language and it's used in this script as an example. Thanks to Pine Team and Tradingview!..
Sell/Buy volumes are calculated approximately!.
Options:
"Number of Bars" : Number of the bars that volume profile will be calculated/shown
"Row Size" : Number of the Rows
"Value Area Volume %" : the percent for Value Area
and there are other options for coloring and POC line style
Enjoy!
Jitendra Sankpal
Bull Run Galaxy
2.11.2025
Cipher B Free | WaveTrend (v6)Uh.. I call this.. Mona Lisa kek. Tried creating my own version of Cipher B with Grok. Feel free to tweak to your heart's content

On Balance VolumeThis indicator provides an implementation of the classic On Balance Volume (OBV) momentum indicator, enhanced with a built-in divergence detection engine.
Key Features:
Full Divergence Suite (Class A, B, C): The primary feature is the integrated divergence engine. It automatically detects and plots all three major types of divergences:
Regular (A): Signals potential trend reversals.
Hidden (B): Signals potential trend continuations.
Exaggerated (C): Signals weakness at double tops/bottoms.
Divergence Filtering and Visualization:
Price Tolerance Filter: Divergence detection is enhanced with a percentage-based price tolerance (pivPrcTol) to filter out insignificant market noise, leading to more robust signals.
Persistent Visualization: Divergence markers are plotted for the entire duration of the signal and are visually anchored to the OBV level of the confirming pivot.
Note on Confirmation (Lag): Divergence signals rely on a pivot confirmation method to ensure they do not repaint.
The Start of a- divergence is only detected after the confirming pivot is fully formed (a delay based on Pivot Right Bars).
The End of a divergence is detected either instantly (if the signal is invalidated by price action) or with a delay (when a new, non-divergent pivot is confirmed).
Multi-Timeframe (MTF) Capability:
MTF OBV Line: The OBV line itself can be calculated on a higher timeframe, with standard options to handle gaps (Fill Gaps) and prevent repainting (Wait for...).
Limitation: The Divergence detection engine (pivDiv) is disabled if a timeframe other than the chart's timeframe is selected. Divergences are only calculated on the active chart timeframe.
Integrated Alerts: Includes 12 comprehensive alerts that trigger on the start and end of all 6 divergence types (e.g., "Regular Bullish Started", "Regular Bullish Ended").
DISCLAIMER
For Informational/Educational Use Only: This indicator is provided for informational and educational purposes only. It does not constitute financial, investment, or trading advice, nor is it a recommendation to buy or sell any asset.
Use at Your Own Risk: All trading decisions you make based on the information or signals generated by this indicator are made solely at your own risk.
No Guarantee of Performance: Past performance is not an indicator of future results. The author makes no guarantee regarding the accuracy of the signals or future profitability.
No Liability: The author shall not be held liable for any financial losses or damages incurred directly or indirectly from the use of this indicator.
Signals Are Not Recommendations: The alerts and visual signals (e.g., crossovers) generated by this tool are not direct recommendations to buy or sell. They are technical observations for your own analysis and consideration.

Money Volume • Buyers vs Sellers — @tgambinoxThis indicator estimates the total amount of money traded (Volume × Price)
and splits it between buyers and sellers based on each candle’s behavior.
It displays green bars for buyers and orange bars for sellers, allowing you to see
which side of the market is concentrating the capital.
Useful for detecting flow imbalances, buying/selling pressure,
and confirming price moves alongside total monetary volume (blue line).

Smart Money vs Retail (COT Flow) 0213Smart Money vs Retail (COT Flow) 0213
Smart Money vs Retail (COT Flow) 0213
Smart Money vs Retail (COT Flow) 0213
Trend Break + MSB + Fibo Zone [v1.0] dnmSure! Here’s the English translation of your text:
---
Swings are determined based on the HH/LL structure.
If the candle close breaks the swing level, the MSB (Market Structure Break) is confirmed.
After the MSB, the last swing high/low is used to calculate the Fibonacci 0.5 and 0.618 levels.
On the chart, the 0.5–0.618 range is displayed as a colored box.
A green box appears for a bullish break, and a red box appears for a bearish break.

Indicador Técnico Avanzado sbuscamos entradas para poder comprar y vender papeles de una correcta manera

Trend scalping ROVTradingOnly trading with bullish or bearish trend. Working fine at m5 and m15 time frame

AG_STRATEGY📈 AG_STRATEGY — Smart Money System + Sessions + PDH/PDL
AG_STRATEGY is an advanced Smart Money Concepts (SMC) toolkit built for traders who follow market structure, liquidity and institutional timing.
It combines real-time market structure, session ranges, liquidity levels, and daily institutional levels — all in one clean, professional interface.
✅ Key Features
🧠 Smart Money Concepts Engine
Automatic detection of:
BOS (Break of Structure)
CHoCH (Change of Character)
Dual structure system: Swing & Internal
Historical / Present display modes
Optional structural candle coloring
🎯 Liquidity & Market Structure
Equal Highs (EQH) and Equal Lows (EQL)
Marks strong/weak highs & lows
Real-time swing confirmation
Clear visual labels + smart positioning
⚡ Fair Value Gaps (FVG)
Automatic bullish & bearish FVGs
Higher-timeframe compatible
Extendable boxes
Auto-filtering to remove noise
🕓 Institutional Sessions
Asia
London
New York
Includes:
High/Low of each session
Automatic range plotting
Session background shading
London & NY Open markers
📌 PDH/PDL + Higher-Timeframe Levels
PDH / PDL (Previous Day High/Low)
Dynamic confirmation ✓ when liquidity is swept
Multi-timeframe level support:
Daily
Weekly
Monthly
Line style options: solid / dashed / dotted
🔔 Built-in Alerts
Internal & swing BOS / CHoCH
Equal Highs / Equal Lows
Bullish / Bearish FVG detected
🎛 Fully Adjustable Interface
Colored or Monochrome visual mode
Custom label sizes
Extend levels automatically
Session timezone settings
Clean, modular toggles for each component
🎯 Designed For Traders Who
Follow institutional order flow
Enter on BOS/CHoCH + FVG + Liquidity sweeps
Trade London & New York sessions
Want structure and liquidity clearly mapped
Prefer clean charts with full control
💡 Why AG_STRATEGY Stands Out
✔ Professional SMC engine
✔ Real-time swing & internal structure
✔ Session-based liquidity tracking
✔ Non-cluttered chart — high clarity
✔ Supports institutional trading workflows

ma+ko Arrowsma+ko ARROWS is a clean Supertrend-based indicator that generates precise BUY and SELL arrows without repainting after candle close.

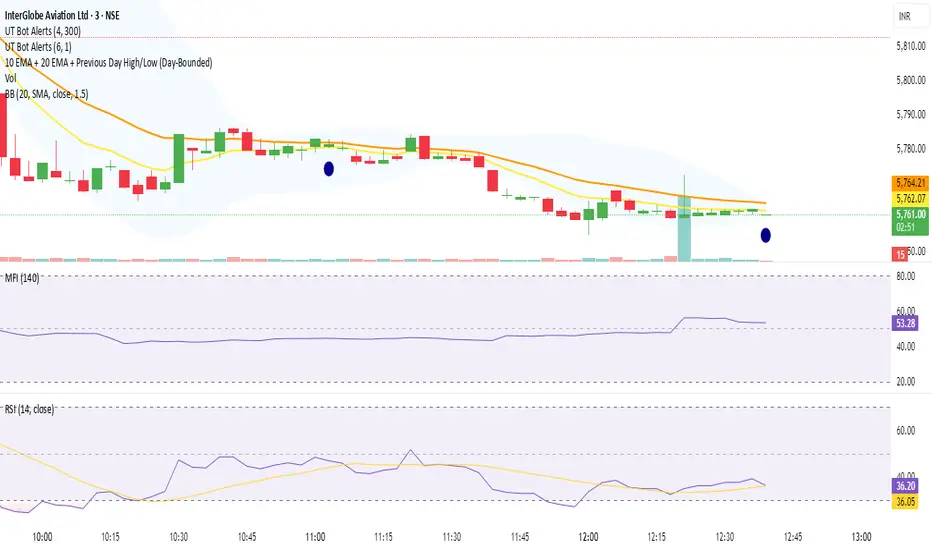
10 EMA + 20 EMA + Previous Day High/Low (Day-Bounded)it gives the reand and also plot the day's lowest volume.it is very helpful in reversals

XAUUSD Multi-Timeframe Supertrend Alert v2**Indicator Overview: XAUUSD Multi-Timeframe Supertrend Alert v2**
**Core Components:**
1. **Multi-Timeframe Supertrend System**
- Two Supertrend indicators (ST1 & ST2) with customizable timeframes
- ST1 typically set to Daily, ST2 to Weekly as main trend
- Visualized with distinct colors and background fills
2. **Customizable SMA**
- Adjustable period and timeframe
- Plotted as blue line for additional trend reference
3. **Neutral Zone System**
- Creates a neutral line offset from ST1 by customizable tick distance
- Yellow dashed line that adjusts based on ST1 trend direction
- **Alert Conditions:**
- **Test Buy Zone**: Both ST1 & ST2 in uptrend AND price enters neutral zone above ST1
- **Test Sell Zone**: Both ST1 & ST2 in downtrend AND price enters neutral zone below ST1
4. **Distance Lines from ST2**
- Upper/lower lines at customizable tick distance from ST2
- Purple dashed lines with touch alerts
**Trading Signals:**
- **Bullish Signal**: Price above ST2 but below ST1 (potential buy)
- **Bearish Signal**: Price below ST2 but above ST1 (potential sell)
- **Neutral Zone Alerts**: Price enters defined zone when both trends align
- **Line Touch Alerts**: Price touches distance lines from ST2
**Alert System:**
- Limited to 3 consecutive alerts per signal type
- Visual markers (triangles, diamonds, circles)
- Background coloring for signal zones
- Separate alert conditions for each signal type
**Visual Features:**
- Candles colored green/red based on signals
- Clear trend visualization with colored backgrounds
- Real-time alert markers without information table clutter
This indicator provides multi-timeframe trend analysis with precise entry zone detection and comprehensive alert system for XAUUSD trading. SAM89 M15, ST1 (5:10) M5, ST2 ( 1,5:20) H1, Test Buy Sell 7000, Line 15000

EMA6 or SMA6 Touch AlertThis script monitors the market and notifies you whenever the price touches either the 6-period EMA or the 6-period SMA.
It helps identify potential pullbacks, reaction points, or entry zones, as price interaction with these moving averages often signals short-term market shifts.
What the script does:
Calculates the EMA 6 and SMA 6
Detects if price touches either moving average within the candle
Plots both lines on the chart for visibility
Allows you to set alerts to receive automatic notifications
Best suited for:
Scalping
Day Trading
Pullback Entries
Short-term trend reactions
ASTER Key Levels & Alerts (Improved)TradingView Script Description
Title: ASTER Key Levels & Alerts (Improved)
Description:
Enhance your trading strategy with the "ASTER Key Levels & Alerts" indicator, designed for precision and decision-making on the Aster chart (e.g., ASTS). This Pine Script v6 tool overlays customizable key levels and zones to identify optimal entry, exit, and stop-loss points, complete with real-time alerts.Key Features:
Customizable Levels: Adjust add zones (Light & Main), breakout, stop, and take-profit (TP1-TP3

ATRThis script displays the Average True Range (ATR) value and the ATR as a percentage of the current closing price directly on the main chart as a clean table, with no lines or plots. It allows users to easily monitor both absolute volatility and its relative magnitude, making comparisons across different assets intuitive. The display position is customizable, offering flexibility for personal chart layouts. Ideal for traders seeking quick volatility insights, risk management guidance, or portfolio-wide comparisons.
Relative Volume (Multi-TF, D, W, M)Relative Volume (Multi-TF, Candle-Matched Colors)
This indicator measures Relative Volume (RVOL) — the ratio of current volume to average historical volume — across any higher timeframe (Daily, Weekly, or Monthly) and displays it as color-coded columns that match the candle colors of the chart you’re viewing.
RVOL reveals how active today’s market participation is compared to its typical rhythm.
RVOL = 1.0 → normal volume
>1.5 → rising interest
>2.0–3.0 → strong institutional participation
>5.0 → climax or exhaustion levels
Features
Works on any chart timeframe while computing RVOL from your chosen higher timeframe (e.g., show Daily RVOL while trading on a 5-minute chart).
Column colors automatically match your chart’s candle colors (green/red/neutral).
Adjustable lookback period (len) and selectable source timeframe (D, W, or M).
Pre-drawn horizontal guide levels at 1.0, 1.2, 1.5, 2, 3, and 5 for quick interpretation.
Compatible with all chart types, including Heikin Ashi or custom color schemes.
Typical Use
Swing trading:
Look for quiet bases where RVOL stays 0.4–0.9, then expansion ≥2 on breakout days.
Confirm follow-through when green days keep RVOL ≥1.2–1.5 and red pullbacks stay below 1.0.
Day trading:
Watch intraday RVOL (on 1–5m charts) for bursts ≥2 that sustain for several bars — this signals crowd engagement and valid momentum.
Interpretation Summary
RVOL Value Meaning Typical Action
0.4–0.9 Quiet base / low interest Watch for setup
1.0 Normal activity Neutral
1.2–1.5 Valid participation Early confirmation
2–3 Strong expansion Momentum / breakout
≥5 Climax / exhaustion Take profits or avoid new entries
Author’s note:
RVOL isn’t directional; it tells how many players are active, not who’s winning. Combine it with structure (levels, VWAP, or trend) to see when the market crowd truly commits.

Fib Time Projections aFib Time Projections aFib Time Projections aFib Time Projections aFib Time Projections a
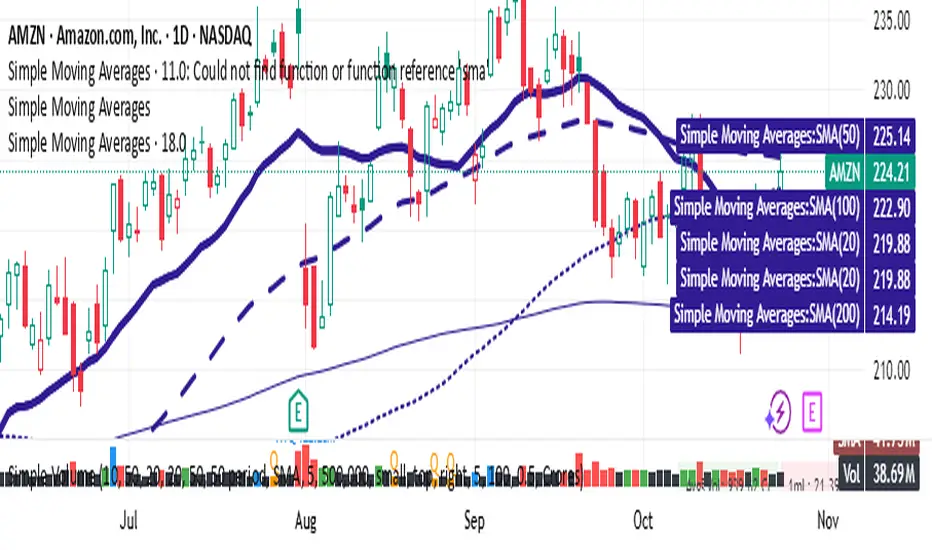
Simple Moving AveragesIn Pine Script v6, the standard method for plotting indicators is still the plot function, and it should be recognized. However, if you are getting an "Undeclared identifier 'plot'" error, double-check these points:
Make sure your script is still using indicator() (not study()) at the top.
The script must not use indentation or syntax errors that break context.
Confirm Pine Script version is set correctly with //@version=6.
Here is a fully corrected Pine Script v6 template for your moving averages scenario using