Cracking Cryptocurrency - Bottom FeederThe Bottom Feeder
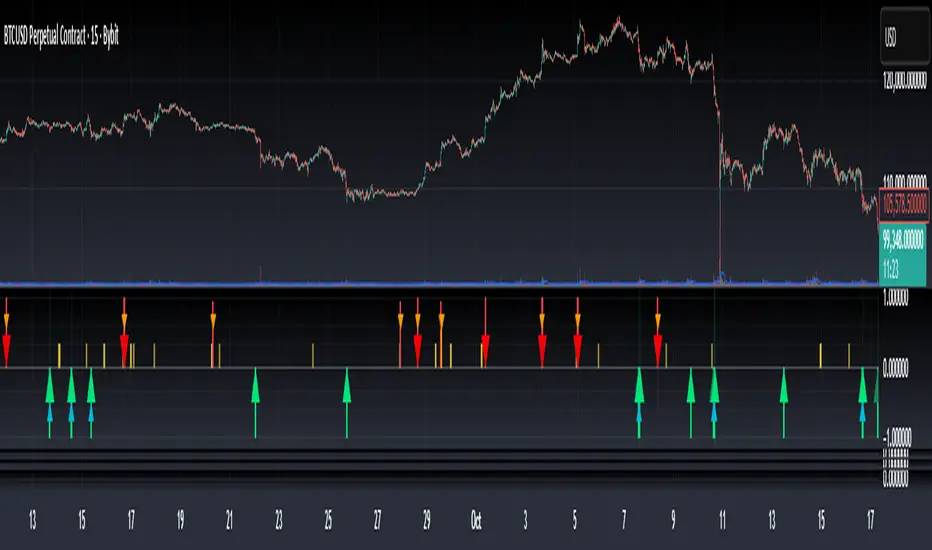
The Bottom Feeder is designed to algorithmically detect significantly oversold conditions in price that represent profitable buying opportunities. Combining this with it’s unique Stop and Target System, the Bottom Feeder is designed to return consistent return with minimal draw down. Whether used as a Market Bottom Detector or as a system for executing safe, profitable mean reversion trades, the Bottom Feeder is a powerful tool in any trader’s arsenal.
Bottom Feeder was designed to be used on BTCUSD , however it is also effective on other USD/USDT pairs. One will have to check the individual pair they wish to trade with the Strategy Tester to simulate performance.
Options
Let’s go through the input options one by one, so that you are able to comfortably navigate all that this indicator has to offer. The link below will display a picture of the layout of the settings for your convenience.
For the sake of simplicity, let’s note now that all settings marked **Conservative Mode** will not work in Aggressive Mode.
Mode: Determines how aggressively Bottom Feeder generates a buy signal. In Conservative Mode, trades can only be opened once per candle and the stop and target will update as new signals appear. In Aggressive Mode, a separate trade is opened each time Bottom Feeder signals, which may be multiple times within one Daily candle.
Plot Target and Stop Loss: Toggles on/off the visualized take profit and stop losses on the chart.
**Conservative Mode** TP Multiplier: This is an input box, it requires a float value. That is, it can accept either a whole number integer or a number with a decimal. This number will determine your Take Profit target. It will take whatever number is entered into this box and multiply the Average True Range against it to determine your Take Profit.
**Conservative Mode** SL Multiplier: See above - this will modify your Stop Loss Value.
**Conservative Mode** Average or Median True Range: This is a drop-down option, the two options are Average True Range or Median True Range. If Average True Range is selected, then this indicator will use the Average True Range calculation, that is, the average of a historical set of True Range values to determine the Average True Range value for Target and Stop Loss calculation. If Median True Range is selected, it will not take an average and will instead take the Median value of your historical look back period.
**Conservative Mode** True Range Length: This is an input that requires an integer. This will represent your historical look back period for Average/Median True Range calculation.
**Conservative Mode** True Range Smoothing: This is a drop-down with the following options: Exponential Moving Average ( EMA ), Simple Moving Average ( SMA ), Weighted Moving Average ( WMA ), Relative Moving Average (RMA). This will determine the smoothing type for calculating the Average True Range if it is selected. Note: if Median True Range is selected above, this option will not have any effect as there is no smoothing for a Median value.
**Conservative Mode** Custom True Range Value?: This is a true/false option that is false by default. If enabled, it will override the Average/Median True Range calculation in favor of a users custom True Range value to be input below.
**Conservative Mode** Custom True Range Value: This is an input box that requires a float value. If Custom True Range is enabled this is where a user will input their desired custom True Range value for Target and Stop Loss calculation.
Stop and Target Description
Because Bottom Feeder is designed only to scalp the various market bottoms that can appear over time in the market and not to identify trends or to trade ranges, it’s imperative that the indicator notify us not just to when to enter our trades, but when to exit! In the service of that, CC Bottom Feeder has a built in Stop and Target system that tracks and displays the stop loss and take profit levels of each individual open trade, whether in Aggressive or Conservative Mode.
Conservative Mode Targeting: In Conservative Mode, Bottom Feeder signals are aggregated into a compound trade. The signal will appear as a green label pointing up below a candle, and will appear upon a candle close. If Bottom Feeder then generates another signal the stop loss and target price will be updated. The process will continue until the aggregated trade completes in either direction. On a trade with multiple signals, a larger position is slowly entered into upon each buy signal.
Aggressive Mode Targeting: In Aggressive Mode, Bottom Feeder signals are individually displayed as they are generated, regardless of how many signals are generated on any single candle. If Bottom Feeder continues to signal, each individual open trade will have their own stop loss and target that will be displayed on the chart until the individual trade completes in either direction. As opposed to a large compound position, aggressive mode represents a higher number of independent signals with their own stop and target levels.
Stop losses and targets are designed to be hard, not soft. That is, they are intended to be stop market orders, not mental stop losses. If price wicks through the target or stop, it will activate.
Bottomfinder

Cracking Cryptocurrency - Bottom Feeder Strategy TesterBottom Feeder - Strategy Tester
The Bottom Feeder is designed to algorithmically detect significantly oversold conditions in price that represent profitable buying opportunities. Combining this with it’s unique Stop and Target System, the Bottom Feeder is designed to return consistent return with minimal draw down. Whether used as a Market Bottom Detector or as a system for executing safe, profitable mean reversion trades, the Bottom Feeder is a powerful tool in any trader’s arsenal.
Bottom Feeder was designed to be used on BTCUSD, however it is also effective on other USD/USDT pairs. One will have to check the individual pair they wish to trade with the Strategy Tester to simulate performance.
Strategy displayed is from 2018-2021 on **Conservative Mode** with Percent of Equity (30%) enabled.
Options
Let’s go through the input options one by one, so that you are able to comfortably navigate all that this indicator has to offer. The link below will display a picture of the layout of the settings for your convenience.
For the sake of simplicity, let’s note now that all settings marked **Conservative Mode** will not work in Aggressive Mode.
Mode : Determines how aggressively Bottom Feeder generates a buy signal. In Conservative Mode, trades can only be opened once per candle and the stop and target will update as new signals appear. In Aggressive Mode, a separate trade is opened each time Bottom Feeder signals, which may be multiple times within one Daily candle.
Position Sizing Strategy : Determines what Risk Management system you will deploy when trading Bottom Feeder. Your options are “Percent of Equity” and “Distance to Stop Loss”. If Percent of Equity is selected, a trade size will be equal to a percentage of your equity, pursuant to the value in the ‘Percent of Equity’ box. If Distance to Stop Loss is selected, then your Position Size will be determined based off the distance to your stop loss and the value in the ‘Risk Percentage’ box.
Percent Of Equity : Determines what percentage of your equity will be allocated to each trade when ‘Position Sizing Strategy’ is enabled.
Risk Percentage : Determines the size of each trade if ‘Distance to Stop Loss’ strategy is enabled. This value reflects what percent of your account you will lose per trade if the trade hits your stop loss.
Plot Target and Stop Loss : Toggles on/off the visualized take profit and stop losses on the chart.
**Conservative Mode** TP Multiplier : This is an input box, it requires a float value. That is, it can accept either a whole number integer or a number with a decimal. This number will determine your Take Profit target. It will take whatever number is entered into this box and multiply the Average True Range against it to determine your Take Profit.
**Conservative Mode** SL Multiplier : See above - this will modify your Stop Loss Value.
**Conservative Mode** Average or Median True Range : This is a drop-down option, the two options are Average True Range or Median True Range. If Average True Range is selected, then this indicator will use the Average True Range calculation, that is, the average of a historical set of True Range values to determine the Average True Range value for Target and Stop Loss calculation. If Median True Range is selected, it will not take an average and will instead take the Median value of your historical look back period.
**Conservative Mode** True Range Length : This is an input that requires an integer. This will represent your historical lookback period for Average/Median True Range calculation.
**Conservative Mode** True Range Smoothing : This is a drop-down with the following options: Exponential Moving Average ( EMA ), Simple Moving Average ( SMA ), Weighted Moving Average ( WMA ), Relative Moving Average (RMA). This will determine the smoothing type for calculating the Average True Range if it is selected. Note: if Median True Range is selected above, this option will not have any effect as there is no smoothing for a Median value.
**Conservative Mode** Custom True Range Value? : This is a true/false option that is false by default. If enabled, it will override the Average/Median True Range calculation in favor of a users custom True Range value to be input below.
**Conservative Mode** Custom True Range Value : This is an input box that requires a float value. If Custom True Range is enabled this is where a user will input their desired custom True Range value for Target and Stop Loss calculation.
From Month/Day/Year to Month/Day/Year : This sets the Time Frame of your backtest for the Bottom Feeder Strategy. It will run FROM the date selected TO the date selected.
Stop and Target Description
Because Bottom Feeder is designed only to scalp the various market bottoms that can appear over time in the market and not to identify trends or to trade ranges, it’s imperative that the indicator notify us not just to when to enter our trades, but when to exit! In the service of that, CC Bottom Feeder has a built in Stop and Target system that tracks and displays the stop loss and take profit levels of each individual open trade, whether in Aggressive or Conservative Mode.
Conservative Mode Targeting: In Conservative Mode, Bottom Feeder signals are aggregated into a compound trade. The signal will appear as a green label pointing up below a candle, and will appear upon a candle close. If Bottom Feeder then generates another signal the stop loss and target price will be updated. The process will continue until the aggregated trade completes in either direction. On a trade with multiple signals, a larger position is slowly entered into upon each buy signal.
Aggressive Mode Targeting: In Aggressive Mode, Bottom Feeder signals are individually displayed as they are generated, regardless of how many signals are generated on any single candle. If Bottom Feeder continues to signal, each individual open trade will have their own stop loss and target that will be displayed on the chart until the individual trade completes in either direction. As opposed to a large compound position, aggressive mode represents a higher number of independent signals with their own stop and target levels.
Stop losses and targets are designed to be hard, not soft. That is, they are intended to be stop market orders, not mental stop losses. If price wicks through the target or stop, it will activate.

Noro's BottomSensivity v0.6 strategy + rsi + AlarmThe original indicator is Noro's BottomSensivity v0.6
I simply turned noro's bottom sensibility 6.0 indicator, which I consider a great tool to find market bottom, into a strategy.
I also added an additional RSI filter with inputs that can be set by the user for entry and exit from the market.
I have tried to insert an alarm so that I can be notified when this particular purchase condition is formed.
I also tried to insert an additional filter that would allow me to make further pyramid purchases only after a certain percentage of drawdown from the first entry so as to reduce the average purchase price but I was not able ... if someone could implement this I would appreciate it.
Well..this is the first time that I try to program / modify a strategy / indicator, there are certainly some gross errors (as in my English too), please forgive me, I will appreciate the corrections that more experienced users will want to make.
I wish you all a good day, pfjons

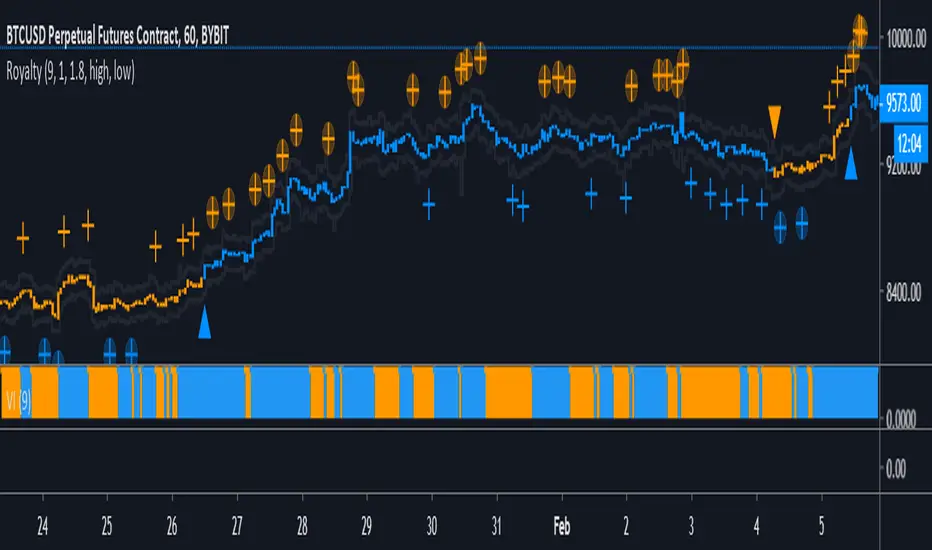
Project Royalty BETAThis indicator is designed to be used in confluence with the PROJECT WINDFALL BETA.
Trend analysis combined with top and bottom signals. This indicator is aimed at minimizing risk by trading with the trend.
Color Definitions:
Blue candle coloring shows a bullish trend
Orange candle coloring shows a bearish trend
Signals:
Blue Triangle - Trend reversal (bearish to bullish)
Blue Cross - Local bottom while in a bullish trend
Blue Cross w/ Circle - Local bottom while in a bearish trend
Orange Triangle - Trend reversal (bullish to bearish)
Orange Cross - Local top while in a bearish trend
Orange Cross w/ Circle - Local bottom while in a bullish trend
Trading Strategy:
TRADE WITH THE TREND
While the trend is bullish (blue) ONLY LONG.
Long trend reversal signals (blue triangle).
Long bottom signals (blue cross) and then take profits on top signals (orange cross w/ circle). DO NOT short top signals while in a bullish trend.
While the trend is bearish (orange) ONLY SHORT.
Short trend reversal signals (orange triangle).
Short top signals (orange cross) and then take profits on bottom signals (blue cross w/ circle). DO NOT long top signals while in a bearish trend.
Stop Loss/Take Profit Bands:
Stop Loss and Take Profit Bands are provided to encourage the setting of both a SL and a TP (methods to minimize risk). When entering a long, set a SL at the SL band value of the signal candle (defaulted to 1%). Set a TP at the TP band value of the signal candle (defaulted to 1.8%). Default percentages are under the assumption of 10x trading leverage.
Ideal Settings:
It's advised to turn off candle borders and to change candle colors to match the colors used in the indicator (default blue and orange).
IMPORTANT:
This indicator is specifically tuned for BTCUSD and is most effective on the 1 HOUR time frame. Be warned when trading any other instrument with this oscillator.
NVT Dynamic Colored with Signals [aamonkey]NVT Dynamic
This is the dynamic version of my " Bitcoin Network Value to Transactions " indicator.
The dynamic NVT indicator is based on the Network Value to Transactions.
Definition:
NVT = Network Value / Daily Transaction Volume
Advantages:
Because BTC is a very young asset, it can be a good idea to have relatively high and low NVT values that change over time.
Signals:
When the NVT turns green = buy opportunity
NVT turns red = sell opportunity

Iconik Trading Suite: Price Action AlertsDisplays signals for Iconik MACD bullish and bearish crosses (including front running signals) along with tops and bottoms.
DM for a PowerPoint describing this indicator and the rest of Iconik in detail.
Iconik Trading Suite Indicator List:
ITS-OSC: Oscillators (v2)
ITS-PAA: Price Action Alerts (v2)
ITS-ASR: Auto Support/Resistance
-> Daily (v2)
-> 3 Day (v2)
-> Weekly (v2)
ITS-4TFC: 4 Time Frame Confirmation (v1)
ITS-DIV: Divergence Seeker (v1)

Bitcoin Network Value to Transactions [aamonkey]Cryptoassets have been quite turbulent in the past few weeks.
At times like this, it is especially important to look at the fundamental foundations of cryptoassets.
This indicator is based on the Network Value to Transactions , or NVT .
Definition:
NVT = Network Value / Daily Transaction Volume
Because this indicator is pulling the Daily Transaction Volume for BTC it can only be used for BTC and the daily timeframe.

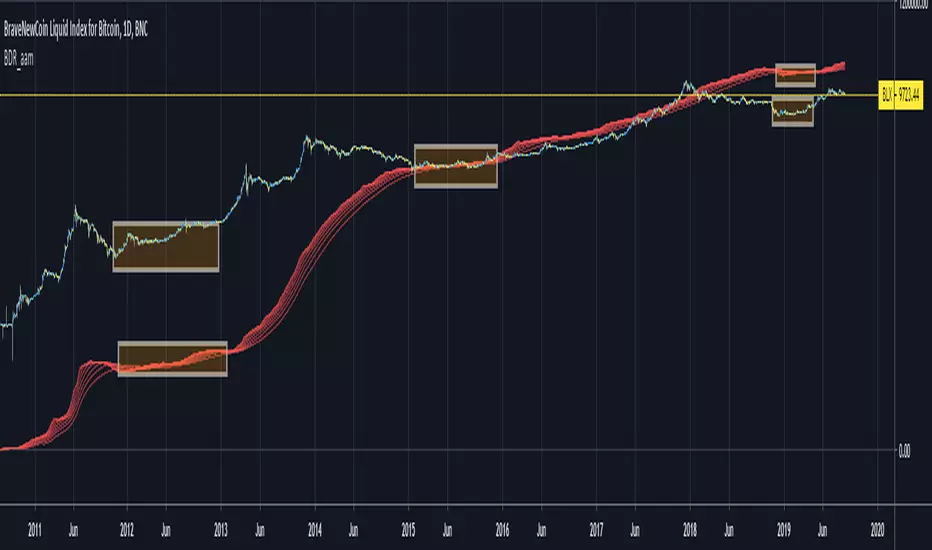
Bitcoin Difficulty Ribbon [aamonkey]This is another tool to find big cycle bottoms that is very unknown yet effective.
The Difficulty Ribbon speaks to the impact of miner selling pressure on Bitcoin`s price action.
When network difficulty reduces its rate of climb, miners are going out of business, leaving only the strong miners who proportionally need to sell less of their coins to remain operational, this leads to less sell pressure and more room for bullish price action.
The best times to buy Bitcoin are zones where the ribbon compresses.
The ribbon consists of simple moving averages of Bitcoin network difficulty so the rate of change of difficulty can be easily seen.
RSI Top & Bottom Warning [aamonkey]An enhancement of my RSI Bottom Indicator.
This one finds you Tops & Bottoms.
This indicator uses the RSI and prints you top & bottom warnings directly on the price chart.
The other special thing about this is that the RSI pulls the data from the weekly chart no matter on what timeframe you are on.
The preferred timeframe can, of course, be changed in the settings as well as any thresholds for tops and bottoms.
The default settings are very good for btc, but be free to try and test this indicator with different settings on different charts.

RSI Bottom [aamonkey]This is a modified RSI that prints a bottom signal directly on your price chart.
It pulls the data (in the default settings) from the weekly chart no matter on what timeframe you are on.
You can adjust the timeframe and threshold.
Default settings work best for big BTC cycles.

TOP & BOTTOM Cycle [aamonkey]Works best on BTC and only on the daily timeframe!
This is a TOP / BOTTOM indicator for big market cycles.
These tops and bottoms are based on the difference between the 200MA on the daily and the price.

Sar-MA SystemThis Script uses Parabolic SAR (developed by Welles Wilder) and some Moving Averages to calculate BUY/SELL and Close Buy/Close Sell points. Additionally the script adds Stop Loss line that is calculated by using Average True Range (ATR).
Basically, script checks the Parabolic SAR and gets confirmation from moving averages or parabolic sar of the higher time frame.
You will not be in a position all the time because if there is no comfirmation then you need to wait for it. For example after closing BUY position, if no confirmation from MAs or higher time frame SAR then there will not be short position, or vice versa.
if you use it please comment.
If you find this script useful, please consider a donation
BTC: 16XRqyS3Vgh1knAU1tCcruqhUrVm4QWWmR

Double Bottom Pattern IdentifierHello friends,
This script is a powerful, non-repainting detector for the classic Double Bottom pattern — one of the most widely recognized bullish reversal setups. The indicator automatically identifies and tracks developing 'W'-shaped formations in real time, confirming valid entries once the neckline is broken and providing complete trade management features. No manual configuration is needed — it works right out of the box.
🛠 How It Works
It uses advanced techniques involving pivot point analysis and does not rely on other indicators, ensuring robustness and adaptability across different market conditions. When a potential Double Bottom is detected, the indicator marks the pattern points, draws the neckline, and waits for confirmation.
Once confirmed, it generates a 'Long' signal with calculated Take Profit (TP) and Stop Loss (SL) levels.
The script also includes a statistics table summarizing performance metrics — such as the number of patterns, trade results, bar distances, and bottom differences — all dynamically updated on your chart.
🔥 Key Features
Pine Script V6 — optimized logic and performance
Works right out of the box — no setup required
Non-repainting detection
Fully visualized structure — points, neckline, TP, and SL plotted automatically
Multiple TP/SL modes: R/R ratio, ATR-based, percent, points, pips, ticks, or bottom-to-neckline distance
Trailing Stop Loss support
Interactive statistics table with pattern count, trade outcomes, profit ratio, and structural measurements
Smart alert system
Customizable alert messages with placeholders (price, ticker, timeframe, etc.)
Clean, updated UI with improved layout and organization
If you'd like access or have any questions, feel free to reach out to me directly via DM.
👋 Good luck and happy trading!
Płatny skrypt

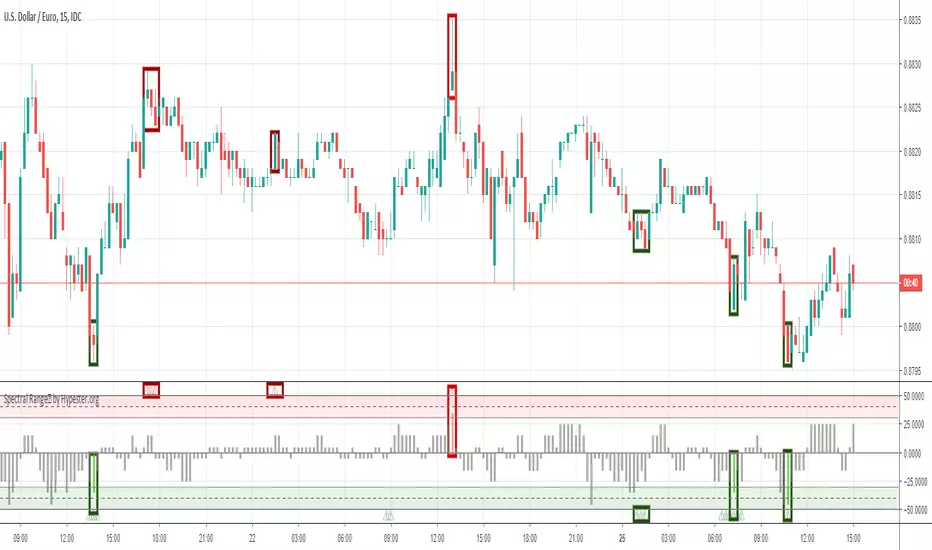
Spectral Range™ by HypesterThe Hypester team strikes again!
Picking tops & bottoms is a real art for any retail trader. It's just like scoring the perfect goal when you get the maximum profit from your trades. It's the difference between an excellent trade and just another trade in your system. It's that last edge you start to seek once you found your profitable strategy.
That's what the Spectral Range™ algorithm does for you - it shows you where all the likely tops/bottoms are . It mixes the famous machine learning Spectro™ technology with cutting edge statistical anomaly detection.
Since all the hard math is done for you, it's deploy and trade. Spectral Range™ will easily tell you when the range of the movement is far out of the normal, healthy and expected movement.
The height of the bar will tell you how aggressive is the anomaly and consequently its correction, plus an extra layer of confirmation with the little warning signs that should be used together for a more conservative approach.
It's really that simple, what are you waiting for?

Bitcoin Long/Short Ratio V2 + Bottom AlertVersion 2 of my Bitcoin Long/Short Ratio with the addition of a bottom alert (column = red). Enjoy :)

Bottom & Top Finder v3.0Bottom & Top Finder v3.0 is a proprietary multi-component oscillator designed to identify potential market reversals and extreme price conditions. The indicator analyzes momentum, volatility, and price behavior to generate bullish and bearish signals with strength classification.
█ OVERVIEW
Each signal is classified into three strength levels (Weak, Medium, Strong) allowing traders to prioritize high-conviction setups.
Signal Classification:
• Strong signals (±1.0): High conviction setups with multiple confirmations
• Medium signals (±0.6): Moderate conviction with key component alignment
• Weak signals (±0.33): Early warnings or preliminary indications
█ KEY FEATURES
Smart Signal Management
The indicator includes an intelligent system that allows signal sequences to complete naturally while preventing excessive noise. Unlike traditional cooldown systems that block all signals during a cooldown period, this implementation allows consecutive signals during a "run" and only applies cooldown after the signal run ends. This ensures complete multi-bar patterns are captured while preventing rapid flip-flopping.
Advanced Filtering System
Three optional filters allow adaptation to different market conditions:
• Volume Confirmation Filter: Validates signals against recent volume activity across a configurable lookback period. Checks if any bar in the lookback window exceeded average volume by the specified multiplier.
• Trend Alignment Filter: Four operational modes including With Trend, Counter Trend, Statistical Distance, or Off. The anomaly mode uses calculations to identify signals only at statistical extremes rather than simple directional bias.
• Signal Type Selection: Enable or disable weak, medium, and strong signals independently based on your trading style and risk tolerance.
Comprehensive Alert System
Ten distinct alert conditions cover every use case. Alerts include price level and timestamp, and are ready for webhook integration with automated trading systems.
█ HOW TO USE
Basic Setup
1 — Add "Bottom & Top Finder v3.0" to your chart in a separate indicator pane
2 — Optionally add "Bottom & Top Finder v3.0 - Chart Labels" for on-chart visual markers
3 — Configure lookback periods (defaults work well for most timeframes)
4 — Enable or disable signal strengths based on your trading style
5 — Apply filters as needed to reduce noise in your specific market
Signal Interpretation
Histogram magnitude indicates signal conviction. Multiple signal types can fire simultaneously and are aggregated into the composite score.
Alert Configuration
Set up alerts through TradingView's standard alert system using the built-in alert conditions. Choose from individual signal types (for specific setups) or aggregate alerts (for broader monitoring).
Recommended Approach
• Combine indicator signals with price action and support/resistance analysis
• Use strong signals for entries, weaker signals for early warnings or exits
• Enable filters when trading liquid markets with reliable volume data
• Adjust cooldown period based on timeframe: lower for active trading, higher for swing setups
• Start with default settings and adjust based on backtesting results
█ SETTINGS
Lookback Settings
• Main Lookback Period: Primary calculation period for most components (default: 21). Lower values increase sensitivity, higher values smooth signals.
• Range Lookback: Extended lookback for range high/low analysis (default: 50). Affects extreme condition detection.
Signal Settings
• Enable Weak Signals: Toggle weak signal detection (default: on)
• Enable Medium Signals: Toggle medium signal detection (default: on)
• Enable Strong Signals: Toggle strong signal detection (default: on)
Filter Settings
• Enable Volume Filter: Require volume confirmation (default: off)
• Volume Lookback: Period to check for volume spikes (default: 30)
• Volume Spike Multiplier: Threshold above average volume (default: 1.3x)
• Trend Filter Mode: Off, With Trend, Counter Trend, or Anomaly (default: off)
• Trend SMA Period: Moving average period for trend calculations (default: 50)
• Anomaly Threshold: Minimum statistical deviation for anomaly mode (default: 1.5)
Display Settings
• Show Composite Histogram: Toggle main histogram display (default: on)
• Show Signal Bars: Toggle triangle markers in indicator pane (default: on)
• Show RSI Reference: Overlay normalized RSI for context (default: off)
█ TIMEFRAME CONSIDERATIONS
The indicator works on any timeframe from 1-minute to monthly charts. However, optimal performance requires timeframe-appropriate configuration:
Shorter Timeframes (1m-15m)
Consider reducing main lookback period for increased responsiveness. Volume filter may be less reliable in some markets during low-liquidity sessions.
Medium Timeframes (1H-4H)
Default lookback periods are optimized for these timeframes. Volume and trend filters provide good noise reduction.
Longer Timeframes (1D+)
Consider increasing lookback periods for smoother signals. Filters are highly effective at these timeframes.
█ BEST PRACTICES
Risk Management
This indicator is a technical analysis tool designed to identify potential reversal zones and does not guarantee profitable trades. Users should:
• Understand that signals indicate potential setup zones, not guaranteed outcomes
• Employ proper position sizing and risk management on every trade
• Combine indicator signals with their own analysis and trading strategy
• Paper trade and backtest thoroughly before live implementation
• Never risk more than they can afford to lose
Signal Context
Indicator signals should be evaluated within broader market structure. Consider:
• Proximity to key support and resistance levels
• Overall trend direction and strength
• Market volatility and liquidity conditions
• Confluence with other technical indicators or patterns
• Fundamental factors that may override technical signals
█ NOTES
• All signals use confirmed bar data and do not repaint
• The cooldown system tracks top and bottom signals independently
• Multiple signal types can fire simultaneously; the composite score aggregates them
• Anomaly mode measures standard deviation magnitude, not just directional bias
• Volume filter checks any bar in the lookback period, not just the current bar
• Strong signals require more confirmations than medium or weak signals
Bottom Finder 2.2Release 2.2
Bottom Finder is an automated cryptocurrency signals and analysis tool which uses a complex algorithm involving multiple indicators, trends, and cross-overs including proprietary formulas developed in-house to predict the bottom price of cryptocurrencies. It also works well on stocks, gold, oil and forex!
Future updates will be included onto this script.
Tip #1: In a bear market, the Half height (fuchsia colored) signals should be ignored by the risk averse trader. In a bull market feel free to buy on both the signals.
Tip #2: In a bear market, use a smaller percent gain instead of TSSL to set your exit targets. In a bull do the opposite, using TSSL (or method of your choice) to exit.

Bottom Finder 2.1Release 2.1 Final!
Bottom Finder is an automated cryptocurrency signals and analysis tool which uses a complex algorithm involving multiple indicators, trends, and cross-overs including proprietary formulas developed in-house to predict the bottom price of cryptocurrencies. It also works well on stocks, gold, oil and forex!

BF bear1Bottom Finder newest version. Found bottom of Golem 2 days before pump and listing at Bithumb.

Bottom finder v8.1.1New version of Bottom Finder with additional confirmations to improve reliability in finding the bottom.

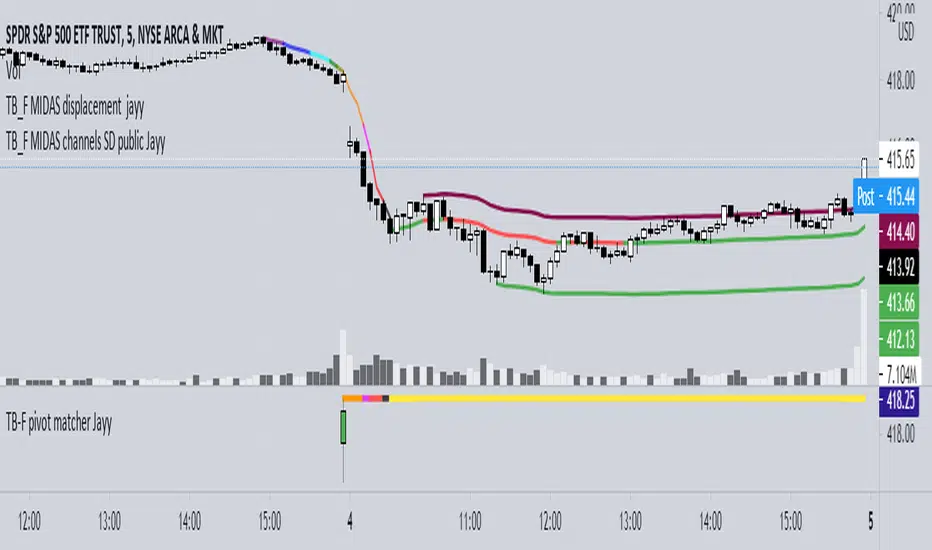
Topfinder Bottomfinder pivot matcher Midas- jayyMidas Technical Analysis: A VWAP Approach to Trading and Investing in Today’s Markets by
Andrew Coles, David G. Hawkins Copyright © 2011 by Andrew Coles and David G. Hawkins.
Appendix C: TradeStation Code for the MIDAS Topfinder/Bottomfinder Curves ported to tradingview
This code is used to assist in adjusting D volume to intersect pivot candle at a pivot candle when using this script: Top Bottom Finder Public version- Jayy found here:
The "n" number entered into the TB-F script is the topfinder/bottomfinder starting point or anchor
Be sure to enter the correct number in the "Topfinder bottomfinder initiation/anchor candle: 1 for CANDLE low - top finder, 2 for CANDLE high - bottom finder, 3 for CANDLE MIDPOINT (hl2) dialogue box
The location of the match point of the pivot candle is extremely important in the: "Match to PIVOT CANDLE: use 1 for CANDLE low, 2 for midtail of the candle below the BODY, 3 for candle BODY low, 4 for CANDLE HIGH, 5 for midpoint of candletail above body, 6 for candle BODY high". Do not
confuse body high with candle high. The body low will either be the candle open or close. The body high will be either the open or close.
If you expect a trend up the pivot candle is likely the low of the pivot candle ie 1 (2 and 3 are alternatives).
In a trend down the high of the pivot candle is often selected ie 4 (5 or 6 are alternatives)
If the candle body is aqua increase D volume if it is orange reduce D volume. Adjust iteratively until the candle body turns yellow. That will mean that the TB-F line passes through the pivot candle at the selected point.
Jayy

Top Bottom Finder Public version- Jayy This script plots a 6 algos from the Coles/Hawkins "Midas Technical Analysis" book:
Top finder / Bottom Finder (Levine Algo by Bob English)* - onlinelibrary.wiley.com
MIDAS VWAP Gen-1) -
MIDAS VWAP average and deltas
VWAP (Gen-1) using a date or a bar n number can be initiated at bar 0 - useful for a new IPO
Standard Deviation of MIDAS VWAP
MIDAS Displacement Channels (Coles) - edmond.mires.co
An%20Anchored%20VWAP%20Channel%20For%20Congested%20Markets.pdf
* for better results with topfinder and bottomfinder use the companion TB-F Matcher script.
See wiki for a synopsis: en.wikipedia.org
Relevant info can be found in: Midas Technical Analysis: A VWAP Approach to Trading and Investing in Today’s Markets by
Andrew Coles, David G. Hawkins Copyright © 2011 by Andrew Coles and David G. Hawkins.
Appendix C: TradeStation Code for the MIDAS Topfinder/Bottomfinder Curves ported to Tradingview
This script requires a working understanding of "Midas Technical Analysis" Google "Midas Technical Analysis" and a variety of information will appear.
To find fit the curve as described in the Midas book a companion script is required that will after a few manual iterative inputs guide you to the appropriate D value for the for input into this program ( see the TB-F Matcher script). You might also try the Midas average and Deltas as described in the book. I have added the 2nd, 3rd and 4th multiples of Delta.
The advantage is that there is no curve fitting. You still need to select a starting point for Midas or the topfinder bottomfinder (TB_F)
or the VWAP.
////////////////////////////////////////////////////////////////////////////////////////////////////////////////////////////
See the notes in the script below
Cheers Jayy