4x Bollinger Bands EMA SMA VWAPUltimate Bollinger Bands that you can configure manually in many ways.
-Turn on and off all bands.
-Auto settings for different time frame
-Squeezed
-EMA SMA VWAP
-2 Color themes
...
The Best Bollinger Band
Wstęgi Bolingera (BB)

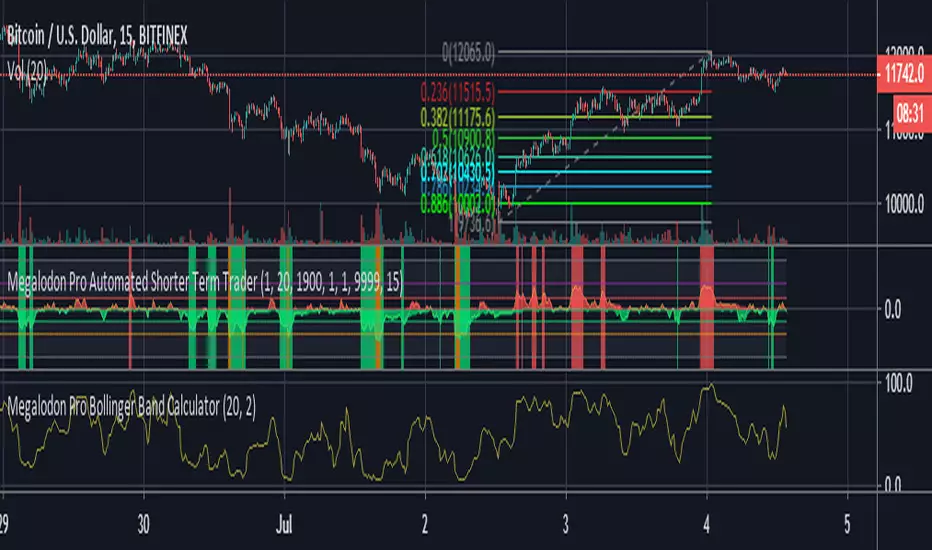
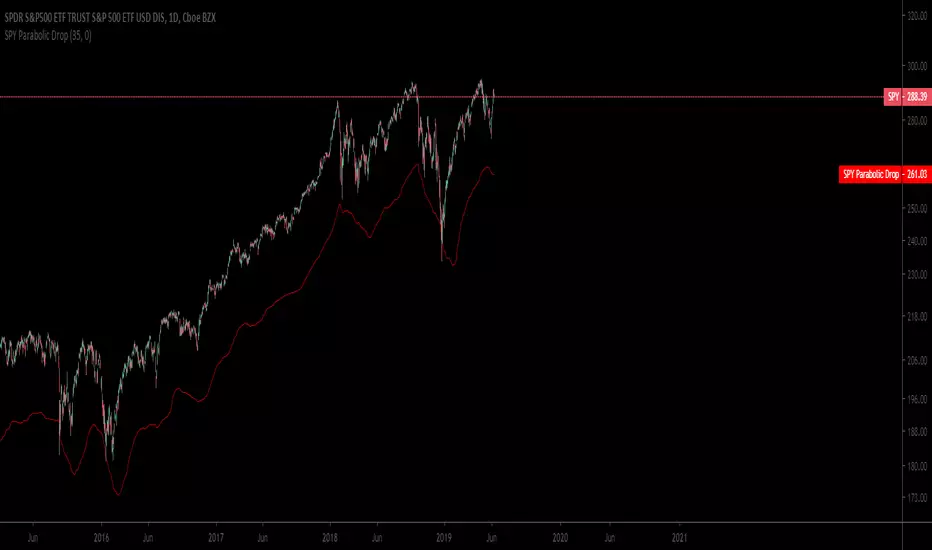
Megalodon Pro Bollinger Band CalculatorHow to use?
It ranges between 0-100. 0 is oversold, 100 is overbought.
It could be a really beneficial tool for timing your day trades in lower time frames.
It is designed for 1 minutes - 15 minutes - 30 minutes - 60 minutes - 240 minutes - 1 Day time frames.

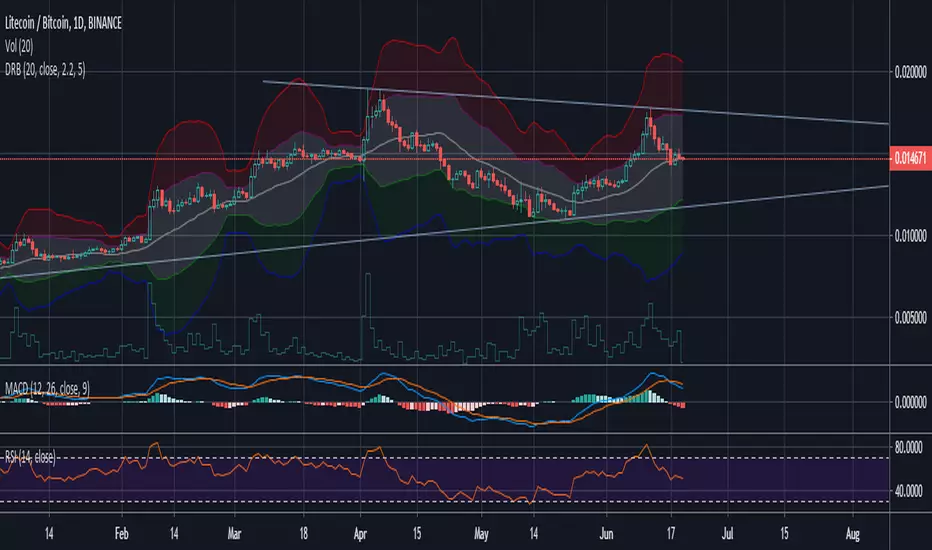
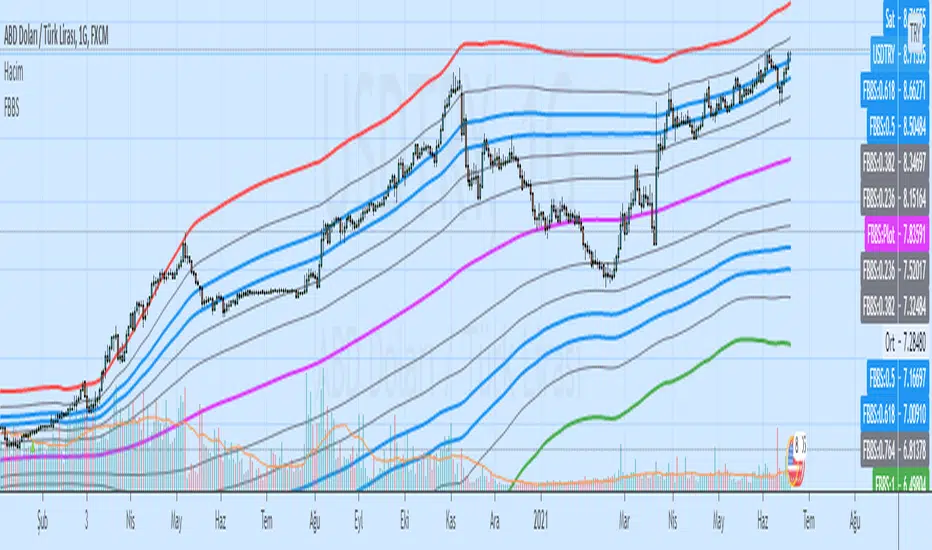
Additional Bollinger Bands & Moving AveragesConsidering the most recent strategy updates to volatility theory trading by DadShark, I have put together (mostly for myself but I am happy to share it if you can find it useful) this even simpler indicator that allows you to activate 4 Bollinger Bands and up to 4 different Moving Averages at the same time.
In this version, there are no multi-frame indicators because this is supposed to be used mostly for short term trading and very limited values that you can edit.
Just plug in the Longest Over Expanded Period (LOXP) in the 1st BB value and all the rest will be calculated accordingly:
- main BB for the LOXP;
- 3rd standard deviation of the LOXP;
- 1/10th of the LOXP for "virtual CCI" entries/exits (so you don't have to adjust CCI values either);
- 3rd standard deviation of the 1/10th of the LOXP to manage your position risk.


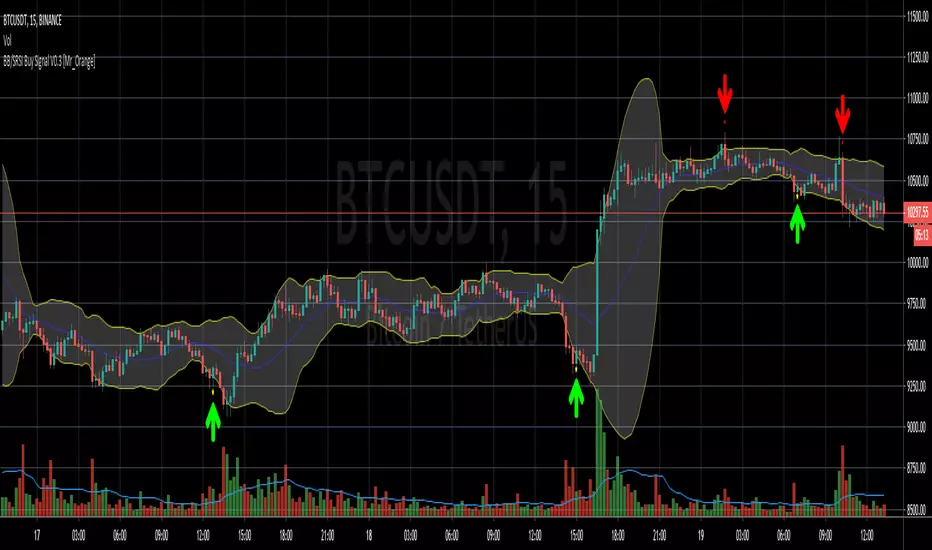
Bollinger Bands/Stoch RSI Buy Signal V0.1 [Mr_Orange]
This my second published script, so if there are tips or questions, please let me know.
The goal of the script is to recognise a reversal pattern from bearish to bullish sentiment on a 3m and 5m timeframe. I want my trade entries to be "mechanically chosen" and not emotionally. I have not yet found a Bollinger and Stochastic RSI indicator which did what I wanted it to do, I've yet to find one of those, so I decided to study pine scripts and make one myself that works the way I want, and because I've written it myself, I understand how it works.
It is purely designed for lower timeframes and normal candles, please do not use it Heikin or Renko. Other timeframes I have not studied. At the moment I only included a Buy alert. I have not yet decided on a Sell signal/alert.
Thanks for checking it out! If you think it is worth something:
- BTC: 1NrG3Sy2VW8u4wWHucj1CQjKQ6hXYwbSyX

linear and Bollingers Bands and Fibonacci ratios This model give us the following
1 .linear regression channel
2.dynamic upper and lower fibs
3. upper and lower bollinger bands
each specific to the time frame that you use
So by using all 3 in one indicator it easy to see ressistance and support level

EMAx4 + BollingerEl script contiene medias moviles mas bandas de bollinger .para no ocupar tantos indicadores

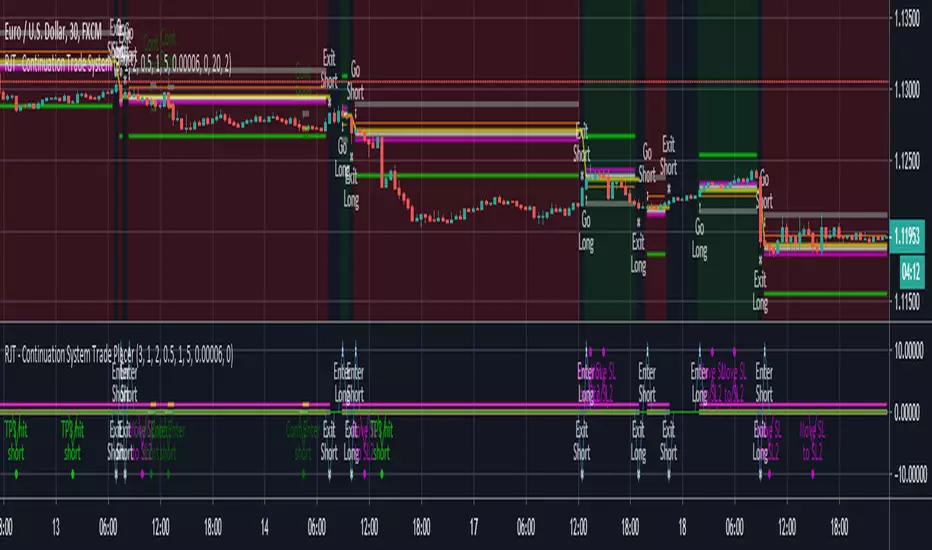
RJT CONTINUATION TRADE STRATEGY - TRADE ENTRY INDICATORThis indicator is used to trade the RJT Continuation Trade Strategy . The fundamental idea behind this strategy is that a trend will continue. Initial entries are placed along with take profit targets and stop losses, then additional entries are placed when pull backs are identified.
This indicator highlights when to place Trade Entries - both long and short, as well as Take Profits and Stop Losses, below the price chart.
This is most powerful when combined with the RJT Continuation Trade Strategy - Trade Overview Indicator
Dynamic Range BandsBased off of bollinger bands, used to find ranged loose buy/sell areas. Pair with other indicators.

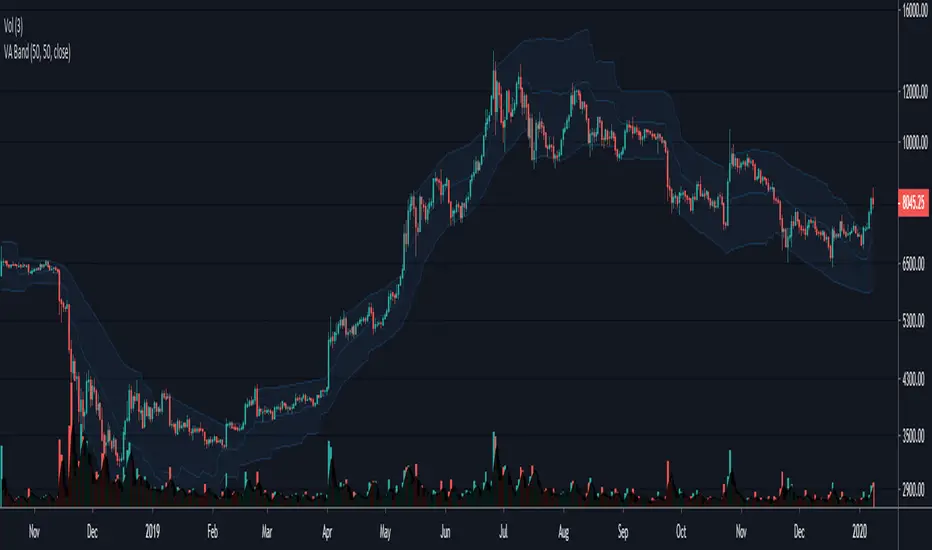
Volatility Adjusted Bands - JD This indicator gives a likely trading range based on the volatility of the past x amount of bars, measured against a certain moving average.
The indicator can be used as an alternative for BBands.
It gives approx. the same "trend-side" lines (upper line in uptrend, lower line in down trend) as the Bollinger Bands, but the opposite line follows closer on price,
Instead of "flying out" to the other direction like in BBands.
As a comparison, the BBands for the same length (50 period) are added on the chart.
JD.
#NotTradingAdvice #DYOR
I build these indicators for myself and provide them open source, to use for free to use and improve upon,
as I believe the best way to learn is toghether.
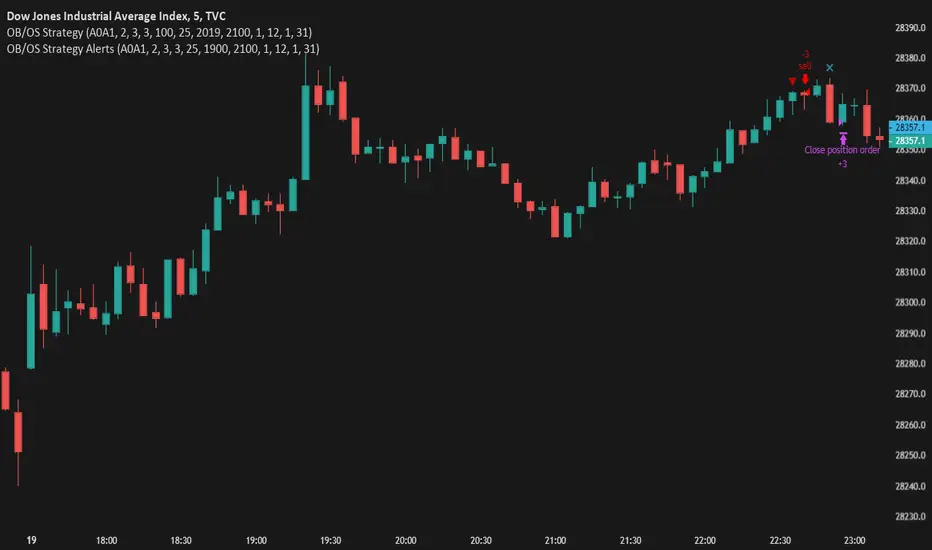
Waddah Attar Explosion V2 [SHK]Hey everyone
I have modified Waddah Attar Explosion indicator to work in low price markets like crypto as well as any other market. So now the DeadZone line is based on ATR instead of a fixed number. Nothing more changed and all credits goes to it's MT4 developer and LazyBear (Main Script Link) .
Hope you enjoy!
Read the main description below...
- - - - - - - - - - - - - - - - - - - - - - - - - - - - - - - - - - - - - - -
This is a port of a famous MT4 indicator. This indicator uses MACD/BB to track trend direction and strength. Author suggests using this indicator on 30mins.
Explanation from the indicator developer:
"Various components of the indicator are:
Dead Zone Line: Works as a filter for weak signals. Do not trade when the red or green histogram is below it.
Histograms:
- Red histogram shows the current down trend.
- Green histogram shows the current up trend.
- Sienna line shows the explosion in price up or down.
Signal for ENTER_BUY: All the following conditions must be met.
- Green histo is raising.
- Green histo above Explosion line.
- Explosion line raising.
- Both green histo and Explosion line above DeadZone line.
Signal for EXIT_BUY: Exit when green histo crosses below Explosion line.
Signal for ENTER_SELL: All the following conditions must be met.
- Red histo is raising.
- Red histo above Explosion line.
- Explosion line raising.
- Both red histo and Explosion line above DeadZone line.
Signal for EXIT_SELL: Exit when red histo crosses below Explosion line.
All of the parameters are configurable via options page. You may have to tune it for your instrument.

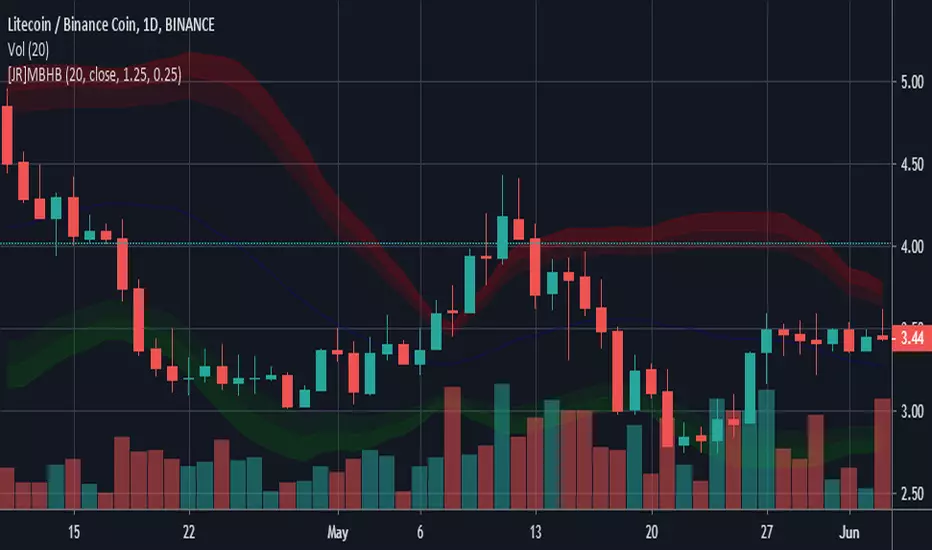
[feeble] TrenderEver wondered which way the price is trending??!
feeble Trender BETA™ shows the trend based on middle crossings in different timeframes, volume weighting and volatility(std Deviations)
--The indicator displays the same on any timeframe
--Select a FROM and TO period
--Use DuPLiCaToR to make 12 copies - use values between 0.8-1.2
--Coloured bands go purple when price is below the volume-weighted mIdBaNd!

[feeble] TrenderEver wondered which way the price is trending?!
feeble Trender™ **BETA** shows the trend based on middle crossings in different timeframes, volume weighting and volatility (std Deviations)
--The indicator displays the same on any timeframe.
--Select a FROM and TO period
--Use DuPLiCaToR to make 12 copies - use values between 0.8-1.2
--Coloured bands go purple when price is below the volume-weighted mIdBaNd!
--Shows the trend on a few different scales!!

Noro's Connors modified - with arrows and alertsThis is a study for providing alerts to this strategy
SuperSpecial_Buy_And_Sell Indicator (Crypto,Forex,Stocks)This indicator can be used on Crypto coins, Forex and Stocks. Don't work as expected in volatile market where there are sudden dips or lifts.
Please trade with care and after reading other indicators in conjunction with this.
Disclaimer: Please use the indicator at your own risk, the publisher don't take any responsibility for your loss.

Bollinger Bands + Moving AveragesBollinger Bands + 3 MAs(EMA)
Exponential Moving Averages (EMA) 13, 62 & 200 (default values)
Bollingers Band (BB) 20 (default value)
Values can be amended based on your trading strategy.
