BTC Price to Hash scoreGrowing btc hashrate are associated with increasing btc price.
During speculative phase price growth is disproportionate to the hashrate.
On the opposite when the price fall to much in comparison to the hashrate, bitcoin could be undervalued.
This indicator identified 3 of 4 major tops and a lot of optimal buy opportunities.
Value under 0 signal overbought situations, value above 5.6 signal extremely oversold situations.
BIO
Bitcoin (Kryptowaluta)

DeLorean-V4 Long/ShortThis study aims to follow the trend of the asset, in longer times it is quite correct, but it can also be used in shorter time to be able to follow the trend of the asset.
Using the Bollinger Bands indicator, to get a better idea of volatility .
This indicator shows me the best trend in the cryptocurrency scenario, but it was very positive, also showing the trend in the "traditional" market.
Configured alerts for Long / Short.
Enjoy!
----------------PT-BR-----------
Este estudo visa acompanhar a tendência do ativo, em tempos maiores é bem assertivo, mas podendo também ser usado em menores tempo para poder acompanhar a tendência do ativo.
Usando o indicador Bollinger Bands , para ter uma ideia melhor da volatilidade.
Este indicador me mostra a tendência melhor no cenário de criptomoedas, mas foi bem assertivo também mostrando a tendência no mercado "tradicional".
Configurado alertas para Long/Short.
Enjoy!

Fibonacci EMAs / Trend and Chopzone identifier Implementation from the highly recommended course "Pinescript Indicator Development" on Udemy
www.udemy.com
This indicator is mostly to show some techniques in Pinescript rather than be useful for trading, however it does nicely identify trend and chop zones (sideways) on the 1-hour or 4-hour chart.
What it does:
- Has three EMAs at varying length and plots these on the chart
- Computes when the EMAs are in bullish configuration (EMA short > Medium > long)
- Computes when EMAs are in bearish configuration (EMA short < Medium < long)
- When the EMAs are crossed there is a chop zone (sideways)
- Colours the background of the chart as Green (bullish), Red (bearish) or Orange (sideways chop zone)
- Also predicts the value of the three EMA's three points into the future using linear regression (showed as dots on the chart)

KAMA Strategy - Kaufman's Adaptive Moving AverageThis strategy combines Kaufman's Adaptive Moving Average for entry with optional KAMA, PSAR, and Trailing ATR stops for exits.
Kaufman's Adaptive Moving Average is, in my opinion, a gem among the plethora of indicators. It is underrated considering it offers a solution that intuitively makes a lot of sense. When I first read about it, it was a real 'aha!' moment. Look at the top, pink line. Notice how during trending times it follows the trend quickly and closely, but during choppy, non-trending periods, the KAMA stays absolutely flat? Interesting! To trade with it, we simply follow the direction the KAMA is pointing. Is it up? Go long. Is it down? Go short. Is it flat? Hold on.
How does it manage to quickly follow real trends like a fast EMA but ignore choppy conditions that would whipsaw a fast EMA back and forth? It analyses whether recent price moves are significant relative to recent noise and then adapts the length of the EMA window accordingly. If price movement is big compared to the recent noise, the EMA window gets smaller. If price movement is relatively small or average compared to the recent noise, the EMA window gets bigger. In practice it means:
The KAMA would be flat if a 20 point upwards move occurred during a period that has had, on average, regular 20 point moves BUT
the KAMA would point up if a 20 point move occurred during a period that has, on average, had moves of only around 5 points.
In other words, it's a slow EMA during choppy flat / quiet flat periods, and a fast EMA as soon as significant volatility occurs. Perfect!
-----
The Strategy
The strategy is more than just a KAMA indicator. It contains:
KAMA exit (optional)
ATR trailing stop loss exit (optional)
PSAR stop loss exit (optional)
KAMA filter for entry and exits
All features are adjustable in the strategy settings
The Technical Details:
Check out the strategy's 'Inputs' panel. The buy and sell signals are based on the 'KAMA 1' there.
KAMA 1: Length -- 14 is the default. This is the length of the window the KAMA looks back over. In this instance, it c
KAMA 1: Fast KAMA Length -- 2 is the default. This is the tightest the EMA length is allowed to get. It will tend towards this length when volatility is high.
KAMA 1: Slow KAMA Length -- 20 is the default. This is the biggest the EMA length is allowed to get. It will tend towards this length when volatility is low.
KAMA Filter
The strategy buys when the KAMA begins to point up and sells when the KAMA points down. Generally, the KAMA is very good at filtering out the noise itself - it will go flat during noisy/choppy periods. But to add another layer of safety, its author, Perry Kaufman, proposed a KAMA filter. It works by taking the standard deviation of returns over the length of the the 'KAMA 1: Length' I mentioned above and multiplying it by an 'Entry Filter' (1 by default) and 'Exit Filter' (0.5 by default). The entry condition to go long is that the KAMA is pointing up and and it moved up more than 1 x St. Dev. of Returns. The exit condition is when the KAMA is pointing down and it moved down by more than 0.5 x St. Dev. of Returns.
Thanks
Thanks to ChuckBanger, cheatcountry, millerrh, and racer8 for parts of the code. I was able to build upon their good work.
-----
I hope this strategy is helpful to you.
Do you have any thoughts, ideas, or questions? Let me know in the comments or send me a message! I'd be glad to help you out.
If you need an indicator or strategy to be built or customised for you, let me know! I'll be glad to help and it'll probably be cheaper than you think!

X Exchange BTC Cash Flow Index (Multi-Exchange)Custom Cash flow Index (Similar to MFI) indicator based on BTC World Volume across all exchanges.
Volume Data based on "BTC WORLD VOLUME" by Phil Ledru
How it works:
Use this indicator like to see momentum changes in Price and Volume across all exchanges for Bitcoin.
When momentum is positive, indicator will turn Blue.
When momentum is slowing down and price is declining, indicator will turn Red.
Like your usual RSI, OB & OS levels are 80 & 20.
What to watch out for:
- Watch out for Bullish and bearish divergences in Volume
- Wedges, Head and shoulders and other formations.
Enjoy!

Mayfair Crypto Strength IndexWorking on the basis of a currency strength index - expresses the index value of a currency. For economists, it is often calculated as purchasing power. while for financial traders, it can be described as an indicator, reflecting many factors related to the currency; for example, fundamental data, overall economic performance or in Crypto terms the strength of the company/asset itself.
In the base version;
BTC is the thicker Orange level.
ETH - the Green
XRP - Blue
The concept then is similar to a stochastic indicator or RSI - 20% oversold regio & 80% overbought. The zero line can be used as Bullush or Bearish.
We wanted to create something that shows the correlation between the top cryptocurrencies as we are often asked about breaking down one or the other.
This is not a buy me now or sell me then indicator - just there to assist and compare assets easily.
Please feel free to like and follow.
Disclaimer
This idea does not constitute as financial advice. It is for educational purposes only, our principle trader has over 20 years’ experience in stocks, ETF’s, and Forex. Hence each trade setup might have different hold times, entry or exit conditions, and will vary from the post/idea shared here. You can use the information from this post to make your own trading plan for the instrument discussed. Trading carries a risk; a high percentage of retail traders lose money. Please keep this in mind when entering any trade. Stay safe.

Bitcoin Bulls and Bears by @dbtrBitcoin 🔥 Bulls & Bears 🔥
v1.0
This free-of-charge BTC market analysis indicator helps you better understand what's going with Bitcoin from a high-level perspective. At a glance, it will give you an immediate understanding of Bitcoin’s historic price channel dating back to 2011, past and current market cycles, as well as current key support levels.
Usage
Use this indicator with any BTCUSD pairs , ideally with a long price history (such as BNC:BLX )
We recommend to use this indicator in log mode, combined with Weekly or Monthly timeframe.
Features
🕵🏻♂️ Historic price channel curve since 2011
🚨 Bull & bear market cycles (dynamic)
🔥 All-time highs (dynamic)
🌟 Weekly support (dynamic, based on 20 SMA )
💪 Long-term support (channel bottom)
🔝 Potential future price targets (dynamic)
❎ Overbought RSI coloring
📏 Log/non-log support
🌚 Dark mode support
Remarks
With exception of the price channel curve, anything in this indicator is calculated dynamically , including bull/bear market cycles (based on a tweaked 20SMA), ATHs, and so on. As a result, historic market cycles may not be 100% accurately reflected and may also differ slightly in between various time-frames (closest result: Monthly). The indicator may even consider periods of heavy ups/downs as their own market cycles, even though they weren’t. Due to its dynamic nature, this indicator can however adapt to the future and helps you quickly identify potential changes in market structure, even if the indicator is no longer updated.
On top of that bullmarket cycles (colored in green) feature an ingrained RSI: the darker the green color, the more the RSI is overbought and close to a correction (darkest color in the chart = 90 Weekly RSI). In comparison with past bull cycles, it helps you easily spot potential reversal zones.
Thanks
Thanks to @quantadelic and @mabonyi which both have worked on the BTC "growth zones" indicator including the price channel, of which I have used parts of the code as well as the actual price channel data.
Follow me
Follow me here on TradingView to be notified as soon as new free and premium indicators and trading strategies are published. Inquire me for any other requests.
Enjoy & happy trading!

Bitcoin Bulls & Bears @dbtr
Bitcoin Bulls & Bears
The "Bitcoin Bulls & Bears" indicator helps you better understand Bitcoin with a high-level view on Bitcoin’s historic price channel, past and current market cycles, as well as current key support levels.
Usage
Use this indicator with any BTCUSD pairs , ideally with a long price history (such as BNC:BLX )
We recommend to use this indicator in log mode, combined with Weekly or Monthly timeframe.
Features
🕵🏻♂️ Historic price channel curve since 2011
🚨 Bull & bear market cycles (dynamic)
🔥 All-time highs (dynamic)
🌟 Weekly support (dynamic, based on 20 SMA)
💪 Long-term support (channel bottom)
🔝 Potential future price targets (dynamic)
📏 Log/non-log support
🌚 Dark mode support
Remarks
Except for the historic price channel curve, all of this indicator is calculated dynamically , including bull/bear market cycles (based on a tweaked 20SMA). Due to this, the historic market cycles may not be 100% accurate and may also differ slightly between time-frames. It may also consider short times of ups/downs to be their own market cycles, even though they weren’t. This dynamic nature allows this indicator to adapt to the future and quickly help you identify changes in market structure.
On top of the that, the bullmarket cycles (green background) feature an ingrained RSI information: the darker the green, the more the RSI is overbought and close to a correction. In combination with past bull cycles, it is easier to spot potential reversal zones.
Thanks
Thanks to @quantadelic and @mabonyi for their pre-work on the price channel information, which I have taken over here

[astropark] Trend Skywalker V1 [strategy]Dear Followers,
today another awesome Swing and Scalping Trading Strategy indicator: Trend Skywalker !
It shows a trend cloud that reacts very fast to price action, so it's perfect for trending markets: it helps a lot to find out
when a trend is going to end and a new is going to start
when to enter again within a trending market
where to put your stoploss
In this example below you can see the three points above:
In fact in a trending market it will highlight that:
price consolidation within the could is a trend weakening signal , so you can easily spot when a trend is going to end and a new is going to start
bullish/bearish trend cloud retests are nice opportunity to re-enter within a trending market, especially if cloud is thick
where to put your stoploss ( below the cloud and/or recent low in a buy scenario , above the cloud and/or recent high in a sell scenario )
This strategy/indicator has the following options:
change analysis window (the lower, the more reactive; the higher, the less reactive)
enable/disable signals on chart
enable/disable "more confirmations" signals filter
enable/disable bars and background coloring based on trend
enable/disable an automatic Trailing Stop strategy option (Automatic Stops)
enable/disable a peak profit tracker (the max percentage profit labels)
enable/disable highlights of trend cloud retests
enable/disable highlights of trend cloud price breakouts
Here below some examples how the indicator works on many markets and timeframe.
ETH/USD 4h
EUR/USD 15m
LTC/BTC 1h
This strategy only trigger 1 buy (where to start a long trade) or 1 sell (for short trade).
Keep in mind that proper risk management and money management strategies are very important to manage your trades (DM me if you need any clarification on these points).
This script will let you backtest the strategy performance over the backtesting period you set in input (it may be a lower period, depending on tradingview candles limitation related to your account).
The one for setting alarms can be found by searching for the astropark's "Trend Skywalker" and then choosing the indicator with "alarms" suffix in the name.
Strategy results are calculated on the time window from February 2018 to now, so about 3 years, using 10000$ as initial capital and working at 1x leverage (so no leverage at all! If you like to use leverage, be sure to use a safe option, like 2x or 3x at most in order to have liquidation price very far).
This is not the "Holy Grail", so use proper money and risk management strategies.
This is a premium indicator , so send me a private message in order to get access to this script.

Ark Crypto HeatlineThis is the 'on chart' indicator. See also "Ark Crypto Heatband" indicator for a side-by-side BTC view, without a re-scaled line.
The crypto landscape is largely dominated by BTC and characterised by cyclical stages with varying degrees of mean reversion.
To understand what stage of the cycle we are currently experiencing, it is useful to examine to what degree the current price has extended beyond the long term average that BTC has established. This is true even when analysing other crypto assets as BTC is the dominant force in the crypto asset class.
This indicator uses the 1400 period daily SMA , which is broadly the 200 period weekly SMA. This can be configured, but historically has represented a baseline to which BTC commonly returns.
The graph plots current price in terms of multiples of this long term average. Traditionally, at multiples beyond 10, BTC is considered overextended with a higher likelihood of trending towards the mean thereafter. Colors indicate the extent of price extension.
Where the indicator is applied to non BTCUSD pairs, a smoothed conversion is applied, seeking to superimpose the BTC long period SMA onto the current chart.
The indicator specifically references BTC by default on all charts, as it is designed to use BTC as general purpose indication of where crypto as a whole currently sits. Accordingly the indicator is only to be used on crypto charts.
For best results on BTC, using BNC:BLX will give the longest historical view.

Ark Crypto HeatbandThe crypto landscape is largely dominated by BTC and characterised by cyclical stages with varying degrees of mean reversion.
To understand what stage of the cycle we are currently experiencing, it is useful to examine to what degree the current BTC price has extended beyond a long term average. This is true even when analysing other crypto assets and helpful to view side by side.
This indicator uses the 1400 period daily SMA, which is broadly the 200 period weekly SMA. This can be configured, but historically has represented a baseline to which BTC commonly returns.
The graph plots current price in terms of multiples of this long term average. Traditionally, at multiples beyond 10, BTC is considered overextended with a higher likelihood of trending towards the mean thereafter. Colors indicate the extend of price extension.
The indicator specifically references BTC by default on all charts as it is designed to use BTC as general purpose indication of where crypto as a whole currently sits. Accordingly the indicator is only to be used on crypto charts.

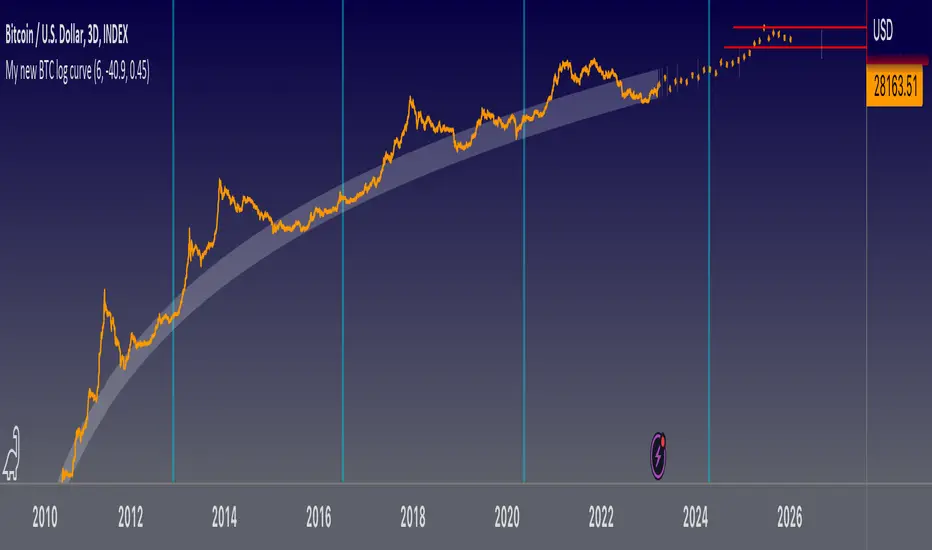
My new BTC log curveThis is my new logarithmic regression curve to the USD/BTC price chart. It is based on a new, very simple equation: y = (e^b)*(x^a), where x is number of days since the Genesis block, a and b are parameters set by the user. Also included is an upper regression curve that is fit to the peaks of each Bitcoin cycle; no fundamental analysis went into making these lines, they are merely fits to the data, so it should not be expected that they can be used to predict tops and bottoms. The upper regression curve is the product of the support curve (lower curve) and two other factors: a constant, and an exponential decay. The constant and the decay factors are parameters that can be set by the user.
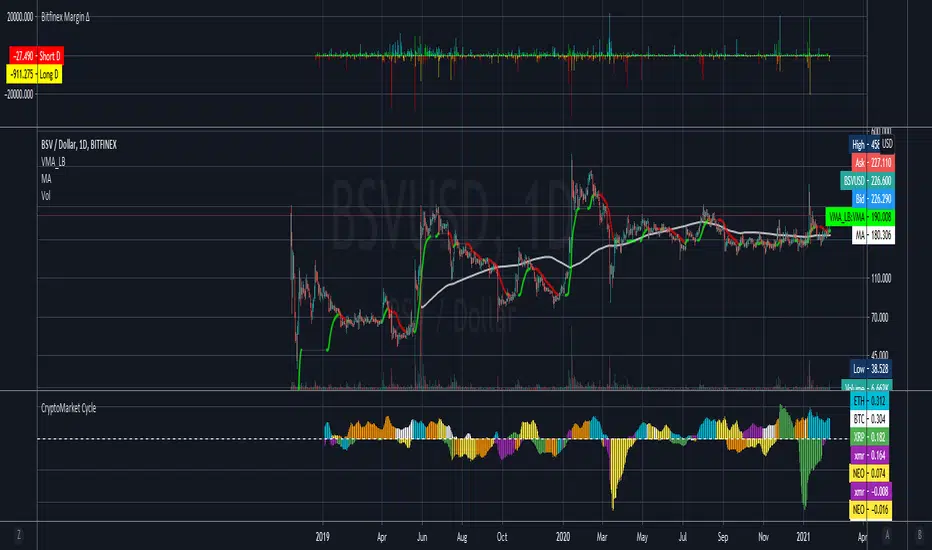
Total Volume BTC - Dollar [Sobhm]
Do you want an indicator that shows the total volume in Bitcoin vs Dollar?!
The BTCUSD - BTCUSDT - BTCUSDC total volume is covered by the "Total Volume BTC - Dollar " indicator.
You can see the differences between simple volume and the collected volume using "Total Volume BTC - Dollar ".
The volume of the following pairs are collected:
'BITMEX:XBTUSD'
'BINANCE:BTCUSDT'
'BINANCE:BTCUSDTPERP'
'BITSTAMP:BTCUSD'
'COINBASE:BTCUSD'
'BITFINEX:BTCUSD'
'BYBIT:BTCUSD'
'GEMINI:BTCUSD'
'OANDA:BTCUSD'
'FTX:BTCUSD'
'FX:BTCUSD'
'HUOBI:BTCUSDT'
'BYBIT:BTCUSDT'
'COINBASE:BTCUSDC'
'BITSTAMP:BTCUSDC'
'POLONIEX:BTCUSDC'
'KUCOIN:BTCUSDC'
'HITBTC:BTCUSDC'
The timeframe is adjustable based on minutes.

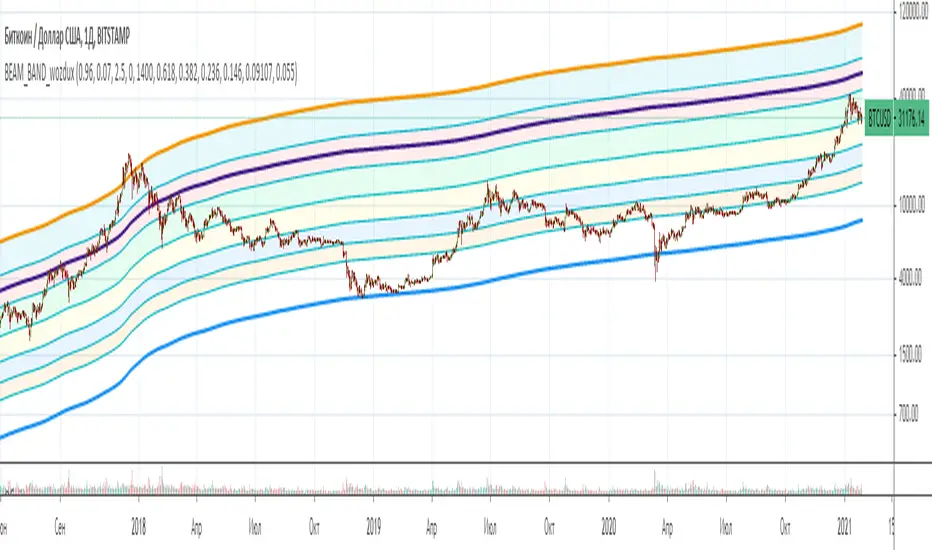
BEAM_BAND_wozdux.2021_1[wozdux]The indicator, which tracks the cycles of Bitcoin.
The corridor between the upper and lower levels is marked by the fibonacci levels. Additional fibonacci levels become support or resistance levels as the price moves.
Top level-determines the width of the channel.
Bottom level-defines the main bottom line.
The number of bars is the value of the bitcoin cycle. This is an empirical selected value. for other amount of cryptocoins, it is necessary to pick apart.
The formula for calculating this indicator is taken from the article THE BEAM INDICATOR. In addition, I extended this indicator with fibonacci levels in order to segment the price movement between the levels of the BAEM channel.
///////////////////////////////////////////
Индикатор, отслеживающий циклы Биткоина. Коридор между верхним и нижним уровнем размечен уровнями фибоначчи.
Дополнительные уровни фибоначчи становятся уровнями поддержки или сопротивления в процессе движения цены.
Уровень верха - определяет ширину канала.
Уровень низа - определяет основную нижнюю линию.
Цикл количество баров - это величина цикла биткоина. Это эмпирическая подобранная величина, для других криптомонет её нужно подбирать отдельно.
Формула для вычисления данного индикатора взята из статьи THE BEAM INDICATOR. Кроме того, я расширила этот индикатор уровнями фибоначчи для того, чтобы сегменты движения цены между уровнями канала BAEM.
trendOne [Strategy]BITSTAMP:BTCUSD
trendOne
(strategy-tester)
It is not recommended to use this script for generating alerts. Use "trendOne Alerts" instead.
This script combines all our previous trend-based scripts (Bows, Autopilot, Trend Indicator, Price Deviation, etc) in only one script .
To calculate the trend we use:
Volume Weight
Average True Range
Bows calculations
Trends smoothed with alma() function.
For more accuracy on the signals and to filter unwanted signals we layered slower time-frames in the background and added breaking support & resistance rules.
Inputs
Sensitivity
Integer input. Sets the sensitivity for signals generated up and down. Higher values will generate less signals on chart, and vice-versa.
Enjoy!
Disclaimer:
Back-tests do not guarantee performance on the future. Even if a trading setup is profitable in historical data, it could be unprofitable in the future.
To get access to this and other scripts check links below.

trendOne [Alerts]BITSTAMP:BTCUSD
trendOne
(alerts)
This script combines all our previous trend-based scripts (Bows, Autopilot, Trend Indicator, Price Deviation, etc) in only one script .
To calculate the trend we use:
Volume Weight
Average True Range
Bows calculations
Trends smoothed with alma() function.
For more accuracy on the signals and to filter unwanted signals we layered slower time-frames in the background and added breaking support & resistance rules.
Inputs
Sensitivity
Integer input. Sets the sensitivity for signals generated up and down. Higher values will generate less signals on chart, and vice-versa.
Enjoy!
To get access to this and other scripts check links below.

Bullmarket Support BandThis Indicator displays a Bull Market Support Band for Bitcoin and Ethereum . If the bands cross and the price falls below them it usually means (at least by historical data) that the Bull Market ist coming to an end.
Use in weekly timeframe!

PROFIT MAKER |Crypto|ETH|BTC|YFI - SignalThis is the version with alerts of this strategy:
Description:
This is a trend-following strategy that works very well for many Crypto assets in the usd or usdt pair
It can be used for both futures and spot!
Some of the assets in which this strategy is proven are
Asset Exchange TF
BINANCE:ADAUSDT Binance 45m
BINANCE:BTCUSDT Binance 1h
BINANCE:YFIUSDT Binance 30m
BINANCE:DOTUSDT Binance 45m
BINANCE:ETHUSDT Binance 30m
BINANCE:LINKUSDT Binance 45m
BINANCE:DOGEUSDT Binance 1h
And many others..
What is this strategy based on?
It is a combination of various parameters, including
-RSI: The relative strength index ( RSI ) is a momentum indicator used in technical analysis that measures
the magnitude of recent price changes to evaluate overbought or oversold conditions in the price of a stock or other asset.
-MACD: Moving average convergence divergence ( MACD ) is a trend-following momentum indicator that shows
the relationship between two moving averages of a security’s price.
-ADX: ADX is used to quantify trend strength. ADX calculations are based on a moving average of price range expansion over a given period of time.
-DMI: DMI is a moving average of range expansion over a given period (the default is 14 days). The positive directional
movement indicator ( +DMI ) measures how strongly price moves upward; the negative directional movement indicator ( -DMI )
measures how strongly price moves downward. The two lines reflect the respective strength of the bulls versus the bears.
Included:
Different forms of Take profit, included:
Take profit on squeeze candles
Take profit based on Risk-Benefit (RR)
Take profit a pre-determined %.
Different forms of Stop Loss, including
ATR-based stop loss
Trail stop loss (with option to use a trigger)
Stop loss a pre-determined %.
For access you can send a message or consult in my social networks.
Links in my tradingview signature (below).
Examples:
The default configuration works very well for most pairs.
You just have to look for which time frame goes better with each one.
Recommended to try with 30m, 45m and 1 hour.

SmoothOps v1 - StrategyThe purpose of this script was to fine tune an indicator on BTCUSDT. I think the results speak for themselves.
This is a script that uses the MACD to predict future price movement. The original MACD signal lags too much for my taste so I went searching for something that could give signals sooner. I decided a smooth macd would help filter out noise and grabbing the highest values and lowest values over the past number of bars. I spent several days backtesting different settings and combinations of signals to arrive at what you see now. This strategy has been fine tuned for BTC/USDT on Binance, so I suggest you only use it for that. Any other coin/pair and exchange will need a new backtest since the data will be different. This is not a generalized indicator like everything else. It's specifically good at one thing: prediction BTCUSDT on Binance.
Use this in combination with the Study version so you can visually see what is happening when you change settings.
How to use:
Use only on BTCUSDT Binance
Set the preset to the timeframe you want. I HIGHLY suggest only using the 1h timeframe. It gives the best profit over time
Set the preset to custom if you want to try using your own settings.
You can change the source input if you want. ohlc4 usually works best for 1h
Change the date range if you want to do a specific timeframe.
Change the stop loss % if you want, but I didn't find much of a difference when using it on 1h

Price in BitcoinHi folks,
This script simply converts the price of assets from USD to bitcoin and displays that price in a separate chart. Currently, only assets quoted in USD will work but I will add more currencies in the future.
Use:
1. Make sure the asset you're viewing is quoted in USD or USX. To check, hover over the symbol on the top left part of the chart, click the "More" ellipsis and select "Symbol Info". The currency will be among the info displayed.
2. Apply the script and view the chart at your own risk.
Math:
price(btc) = (x/usd) / (btc/usd)
Cheers!
Jared

PROFIT MAKER |Crypto|ETH|BTC|YFIThis is a trend-following strategy that works very well for many Crypto assets in the usd or usdt pair
It can be used for both futures and spot!
Some of the assets in which this strategy is proven are
Asset Exchange TF
BINANCE:ADAUSDT Binance 45m
BINANCE:BTCUSDT Binance 1h
BINANCE:YFIUSDT Binance 30m
BINANCE:DOTUSDT Binance 45m
BINANCE:ETHUSDT Binance 30m
BINANCE:LINKUSDT Binance 45m
BINANCE:DOGEUSDT Binance 1h
And many others..
BINANCE:BTCUSDT
BINANCE:LINKUSDT
What is this strategy based on?
It is a combination of various parameters, including
-RSI: The relative strength index (RSI) is a momentum indicator used in technical analysis that measures
the magnitude of recent price changes to evaluate overbought or oversold conditions in the price of a stock or other asset.
-MACD: Moving average convergence divergence (MACD) is a trend-following momentum indicator that shows
the relationship between two moving averages of a security’s price.
-ADX: ADX is used to quantify trend strength. ADX calculations are based on a moving average of price range expansion over a given period of time.
-DMI: DMI is a moving average of range expansion over a given period (the default is 14 days). The positive directional
movement indicator (+DMI) measures how strongly price moves upward; the negative directional movement indicator (-DMI)
measures how strongly price moves downward. The two lines reflect the respective strength of the bulls versus the bears.
Included:
Different forms of Take profit, included:
Take profit on squeeze candles
Take profit based on Risk-Benefit (RR)
Take profit a pre-determined %.
Different forms of Stop Loss, including
ATR-based stop loss
Trail stop loss (with option to use a trigger)
Stop loss a pre-determined %.
**All trades include 0.1% of fees + slippage
** The statistics displayed are for the year 01-01-2020 and the period from 2021 to the date of publication (14-01-2020)
For access you can send a message or consult in my social networks.
Links in my tradingview signature (below).

Bitcoin: Confidence BandsPurpose of this Script
This script is designed to show regions of positive and negative overextension for Bitcoin, where price is expected to either reverse long-term or at least shorter-term, using custom price loops. The idea is that one can be highly confident that Bitcoin's price stays within the Confidence Bands, especially when looking at weekly closes. It might be wise to reduce exposure to Bitcoin when price gets very near to the red band, and vice versa for an approach of the blue band. Of course this constitutes no financial advice, and one should always consider all available information for making trading decisions.
Settings
This indicator should only be used:
- with the default inputs (but of course feel free to play around a bit for testing purposes)
- on the weekly (W) time frame
- and for the BraveNewCoin Liquid Index for Bitcoin (BNC:BLX).
Otherwise the intended functionality cannot be guaranteed.
Access
For access please contact me via DM on TradingView or on Twitter (linked on my TradingView profile and in my signature).
