Month of Year Performance█ OVERVIEW
The Month of Year Performance indicator is designed to visualize and compare the cumulative percentage change for each month of the year. By aggregating monthly returns, it helps uncover seasonal trends and potential anomalies in financial markets.
In financial analysis, a calendar based anomaly refers to recurring patterns or tendencies associated with specific time periods, such as days of the week. By calculating the cumulative percentage change for each month (January through December) and displaying the results both graphically and in a summary table, this indicator helps identify whether certain months
consistently outperform others.
█ FEATURES
Customisable time window via Time Settings.
Calculates cumulative percentage change for each month (January to December) separately.
Built-in error check to ensure the indicator is applied on a Monthly timeframe.
Distinct visual representation for each month using unique colours.
Customisable table settings including location and font size.
Displays a performance summary table with metrics such as performance, average return, % positive, and count.
█ HOW TO USE
Add the indicator to a chart set to a Monthly timeframe.
Select your desired Start Time and End Time in the Time Settings.
Toggle the performance table on or off in the Table Settings.
Adjust the table’s location and font size as needed.
View the cumulative monthly performance plotted in distinct colours.
Colour Scheme:
January: Blue
February: Red
March: Green
April: Orange
May: Purple
June: Fuchsia
July: Teal
August: Yellow
September: Navy
October: Lime
November: Maroon
December: Aqua
Behaviour

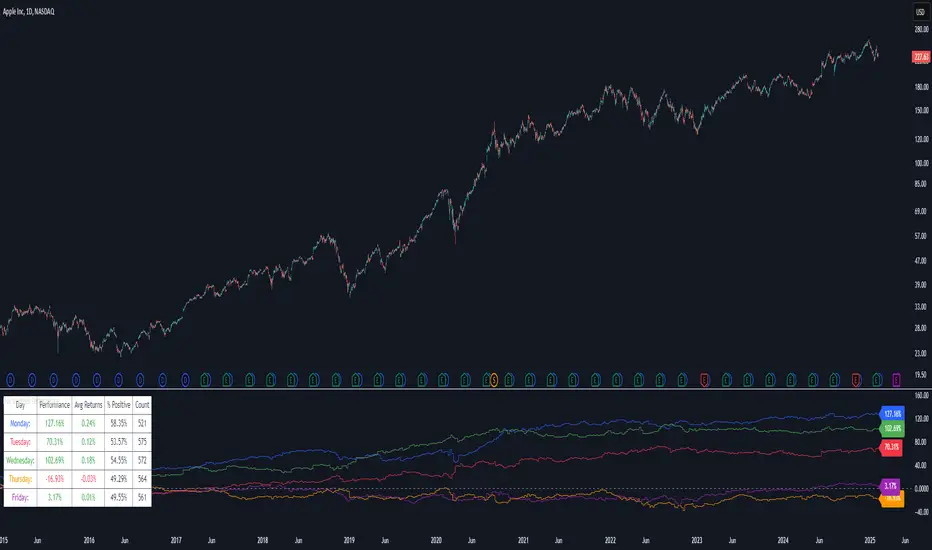
Day of Week Performance█ OVERVIEW
The Day of Week Performance indicator is designed to visualise and compare the cumulative percentage change for each day of the week. This indicator explores one of the many calendar based anomalies in financial markets.
In financial analysis, a calendar based anomaly refers to recurring patterns or tendencies associated with specific time periods, such as days of the week. By calculating the cumulative percentage change for each day (Monday through Friday) and displaying the results both graphically and in a summary table, this indicator helps identify whether certain days consistently outperform others.
█ FEATURES
Customisable time window via Time Settings.
Calculates cumulative percentage change for each day (Monday to Friday) separately.
Option to use Sunday instead of Friday for CFDs and Futures analysis.
Distinct visual representation for each day using unique colours.
Customisable table settings including position and font size.
Built-in error checks to ensure the indicator is applied on a Daily timeframe.
█ HOW TO USE
Add the indicator to a chart set to a Daily timeframe.
Select your desired Start Time and End Time in the Time Settings.
Toggle the performance table on or off in the Table Settings.
Adjust the table’s location and font size as needed.
Use the "Use Sunday instead of Friday" option if your market requires it.
View the cumulative performance plotted in distinct colours.
Colour Scheme:
Monday: Blue
Tuesday: Red
Wednesday: Green
Thursday: Orange
Friday: Purple
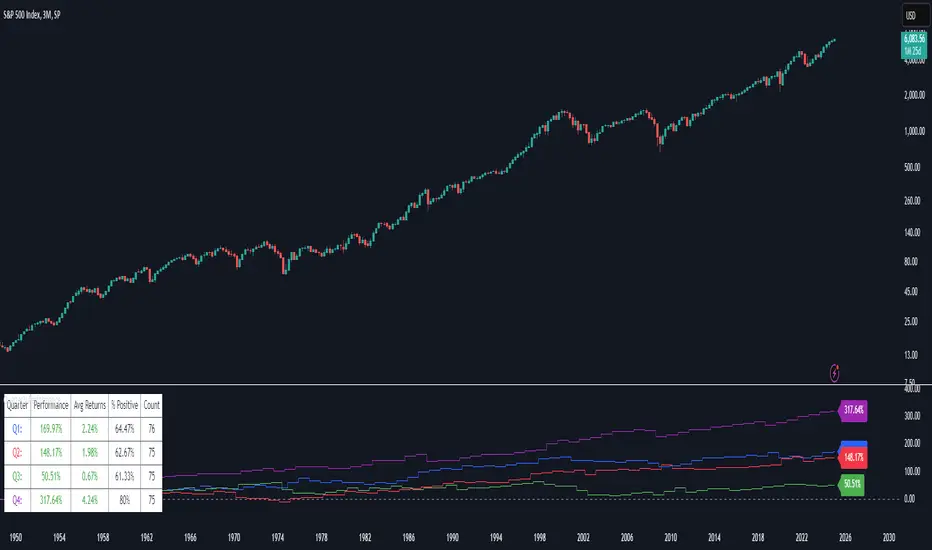
Quarterly Performance█ OVERVIEW
The Quarterly Performance indicator is designed to visualise and compare the performance of different Quarters of the year. This indicator explores one of the many calendar based anomalies that exist in financial markets.
In the context of financial analysis, a calendar based anomaly refers to patterns or tendencies that are linked to specific time periods, such as days of the week, weeks of the month, or months of the year. This indicator helps explore whether such a calendar based anomaly exists between quarters.
By calculating cumulative quarterly performance and counting the number of quarters with positive returns, it provides a clear snapshot of whether one set of quarters tends to outperform the others, potentially highlighting a calendar based anomaly if a significant difference is observed.
█ FEATURES
Customisable time window through input settings.
Tracks cumulative returns for each quarter separately.
Easily adjust table settings like position and font size via input options.
Clear visual distinction between quarterly performance using different colours.
Built-in error checks to ensure the indicator is applied to the correct timeframe.
█ HOW TO USE
Add the indicator to a chart with a 3 Month (Quarterly) timeframe.
Choose your start and end dates in the Time Settings.
Enable or disable the performance table in the Table Settings as needed.
View the cumulative performance, with Q1 in blue, Q2 in red, Q3 in green and Q4 in purple.
Even vs Odd Days Performance█ OVERVIEW
The Even vs Odd Days Performance indicator is designed to visualise and compare the performance of even-numbered days versus odd-numbered days. This indicator explores one of the many calendar based anomalies that exist in financial markets.
In the context of financial analysis, a calendar based anomaly refers to patterns or tendencies that are linked to specific time periods, such as days of the week, weeks of the month, or months of the year. This indicator helps explore whether such a calendar based anomaly exists between even and odd days.
By calculating cumulative daily performance and counting the number of days with positive returns, it provides a clear snapshot of whether one set of days tends to outperform the other, potentially highlighting a calendar based anomaly if a significant difference is observed.
█ FEATURES
Customisable time window through input settings.
Tracks cumulative returns for even and odd days separately.
Easily adjust table settings like position and font size via input options.
Clear visual distinction between even and odd day performance using different colours.
Built-in error checks to ensure the indicator is applied to the correct timeframe.
█ HOW TO USE
Add the indicator to a chart with a Daily timeframe.
Choose your start and end dates in the Time Settings.
Enable or disable the performance table in the Table Settings as needed.
View the cumulative performance, with even days in green and odd days in red.
