Weis Wave With Speed Index SignalsWeis Wave with Speed Index Signals
The Concept
This indicator has been created to try to quantify "Change in Behavior" concept and provide buy and sell based on this concept. What is Change in Behavior? Price is moving at speed rate based on the trading volume direction (buyers and sellers) until there is imbalance of Supply/Demand. An algorithm has been created to identify this change of Supply/Demand behavior producing a number called "Speed Index". Abnormal Speed Index notes this change in behavior when compared with previous Speed Index numbers of the same pair and in the same timeframe. Speed Index is a relevant number and it's use is to be compared with previous Speed Index numbers and not as an absolute number. Based on Speed Index Behavior of recent waves, price and price wave structure buy and sell signals are available called Plutus.
What it does
This indicator draws a waveline of price waves swings. Up swing is when price goes up and down swing is when price goes down. It adds the volume of each bar within the wave swing, it measures the distance in pips of each swing and measure the numbers of bars of each swing. Furthermore, it creates the Speed Index of each swing, the average Speed Index of x selectable wave swings back as well as the average of Speed Index of the x up swings back and the average of the down swing. The indicator is also able to designate a Fast wave which means large pip move with small volume with the letter "F" displayed next to Speed Index and a Slow wave which small pip move with small volume with the letter "S". Finally based on price, Speed Index history and structure it creates eight buy/sell signals called Plutus.
Information available for display all selectable
For each wave swing: Total Volume, Pip Distance, Number of Bars or Total Volume + Pips or Total Volume + Pip Distance+Total Number of Bars
For each wave swing: Speed Index or Total Volume + Speed Index or Speed Index + Average Speed Index or Speed Index+(F or S).
Plutus buy and sell signals when criteria of price location, speed index comparison (abnormal speed index) and wave price structure have been met.
How it does it
This indicator draws a wave-line of price waves swings. Wave Sensitivity can be adjusted by AutoSensitivity parameter (min value =2 and max value=11). The larger the number the more sensitive it is, which means more wave swings will be created. All calculations are based on each wave swing. The code calculates all the above mentioned on the "Information available for Display" section. Based on price, Speed Index history, Speed Index ratio and structure Plutus buy and sell signals are created. The default value of Speed Index ratio is 2. Decreasing Speed Index ratio will create more signals while increasing it will create less signals.
Note: last wave re-paints and no information is displayed on the forming wave, but the whole trading methodology is based on reading previous waves information.
Technical Information
Speed Index
High Speed Index number means a slow wave "S" = Abnormal Speed (high volume small pip move)
Low Speed Index number means a fast wave "F" =Anormal Speed (small volume large pip move)
Normal Speed Index number (are the more frequent numbers seen in the chart which means that the market agrees with the move).
Plutus Signals
PL - Plutus Long, this is when the price will follow in the same direction of the wave with the High Speed Index. When signal is generated we enter when price close breaks the previous two wave structure Resistance Level
PS - Plutus Short, same as above, this is when the price will follow in the same direction of the wave with the High Speed Index. When signal is generated, we enter when price close breaks the previous two wave structure Support Level
PRL - Plutus Reversal Long, this is when the price will go in the opposite direction of the wave with the High Speed Index.
PRS - Plutus Reversal Short, same as above, this is when the price will go in the opposite direction of the wave with the High Speed Index.
PFL - Plutus Fake Long, this when price will do a fast break of the previous down swing bottom and then comes back within the previous swing range (fake break)
PFL - Plutus Fake Short, this when price will do a fast break of the previous up swing top and then comes back within the previous swing range (fake break)
WU - Wyckoff Upthrust plutus (short signal)- this is when the last two swings resemble(are) Wyckoff's UpThrust pattern price swings. This resemblance together with Speed Index criteria and price break of structure create this signal.
WS - Wyckoff Spring plutus(long signal)- this is when the last two swings resemble(are) Wyckoff's pattern price swings. This resemblance together with Speed Index criteria and price break of structure create this signal.
How to use it
Draw Support/Resistance and Fib - usually supply and demand imbalance happens at his level
First and most important of all adjust AutoSesnsitivity to get your swings correct, meaning that are catching the tops and bottoms of each price wave swing.
Monitor Speed Index behavior. Be alerted from Abnormal Speed Index number. You can also set using the Extreme Threshold parameter that provide you an alert if the current Speed Index is above or below average Speed Index of x waves back and also meets the min and max bar criteria. For example if we would like to be alerted for a an Abnormal Speed Index of a Slow wave of at 3 bars then we have set the Min Slow Bar parameter to 3, the Extreme Threshold parameter to 0.5 (50%) and the Avg Waves back to 8 then an alert will be produced if the wave before the forming has at least 3 bars and the Speed Index of the wave is 50% higher than the Average Speed Index calculated from 8 waves back. For a Fast wave we can set the Min Fast Bars to 1, Extreme Threshold to 50% and Avg Waves back to 8 which means that we will get an alert if the wave before the forming one has at least 1 bar and it's Speed Index is at least 50% less than the Speed Index Average of 8 waves back.
Plutus signals provide buy and sell entries after specific criteria have been met. These signals have a higher success rate when price is exiting a range or when price is leaving from Support/Resistance or Fib. Consider Plutus signals invalid within a range unless is the exit of the range (Range Break)
What makes it unique
The ability to identify, quantify and be alerted of the Change in Behavior of waves swings when compared with recent previous wave swings making it easier for the trader to be notified about Supply / Demand imbalance. Furthermore, another unique point of this indicator is the Plutus signals providing buy and sell entries. Plutus entries take into consideration this Abnormal Behavior, the wave swings structure and price location.
Example Trades
Wyckoff Up- rust formation strategy- Reading the chart
1. We have broken a Resistance Level with a Fast Speed Index of 0.7F
2. Abnormal Speed Index of 2.3 provides the alert for abnormal Speed Index behavior. There is not a high Speed Index like that in all the up wave swings which automatic makes it abnormal Supply Demand imbalance.
3. WU - Wyckoff Up-trust plutus signal has been created, which means Short.
4. PRS - Plutus Reversal Short also created at the same location which makes the Short even a higher probability trade
5. Entry: We enter Short on the close of the bar
Exit from Range Strategy - Reading the chart
1. We are in a Ranging environment
2. PS and PRS are invalid signals because according to the rules mentioned previously we do not trade any signals created within the range when the price does not break the range.
3. PRL - Plutus Reversal Long which means that price will move in the opposite direction of the High Speed Index (the 2.2) is a valid signal since price breaks the top of the range
4. Entry Long after breaking the top of the range
PRL after Support hit Strategy and Exit from Range Strategy - Reading the chart
In this we have two different strategies available. The first one is Plutus Reversal Long signal after hitting support and the second on an Exit from Range.
The Story:
1. We have hit support (double bottom)
2. Speed Index 2.2 at the bottom is on the High side, not too extreme but on the high side.
3. A PRL long signal is generated which means that price will move in the opposite direction of the 2.2 Speed Index
4. Entry Long on the close of the bar- This trade has provided 482 pips of profit
5. Price goes into Range
6. Classic textbook strategy Exit from Range with Plutus. We get a PL Plutus Long signal which means price will follow the directions of the high Speed Index wave and in this case is the 2.7 wave
7. Entry Long after the range break. This trade provided 384 pips up to now.
Avwap

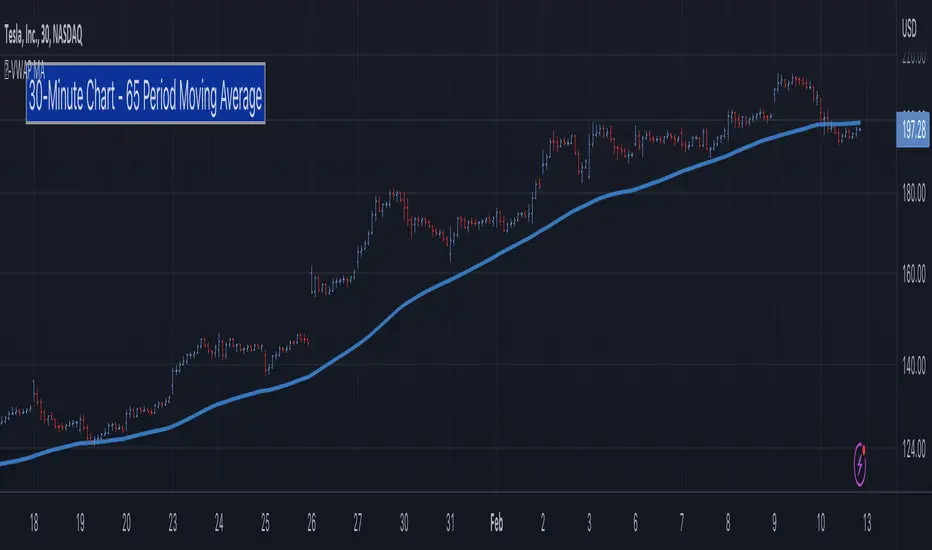
5-Day Moving Average - Intraday [LevelUp]In collaboration with Brian Shannon, author of two best-selling books on technical analysis, we've put together an indicator that manages the moving average period based on the chart timeframe.
When using AVWAP as described by Brian, we look for stocks where the trend of the 50-SMA is higher. In that scenario, we look to shorter timeframes (intraday charts) to see if the price action is setting up for a low risk trade. We do this by making sure the shorter timeframe(s) align with the longer. As we look at various timeframes, we need to make sure the moving average is consistent across the timeframes, which is done via the 5-day moving average as outlined below.
The 5-Day Moving Average (5-DMA)
Brian explains it best, from his article 5 Day Moving Average posted on his blog:
"If you want to see a five DAY moving average on a chart with 10 minute candles, you have to consider how many 10 minute periods of trading there are in the trading day. The US equities markets are open from 9:30- 4:00 each day, which is 6.5 hours per trading day. In each hour of trading, there are 6-10 minute periods, so during the regular session for equities, the market is open for 390 minutes or 39-10 minute periods per day. If we are to get a five day moving average, we would take the 39-10 minute periods the market is open each day and then multiply that by five days. 39 x 5 = 195. So a 5 DAY moving average is represented by a 195 PERIOD moving average when looking at a 10 minute timeframe."
Here are the supported timeframes and their 5-DMA equivalents:
1-minute 1950
2-minutes 975
3-minutes 650
5-minutes 390
6-minutes 325
10-minutes 195
13-minutes 150
15-minutes 130
26-minutes 75
30-minutes 65
39-minutes 50
65-minutes 30
78-minutes 25
130-minutes 15
195-minutes 10
More Information About Anchored VWAP (AVWAP)
Brian goes into great detail about multiple timeframe analysis and AVWAP in both of his books:
▪ Maximum Trading Gains With Anchored VWAP
▪ Technical Analysis Using Multiple Timeframes
Acknowledgements
Many thanks to Brian Shannon for sharing his expertise on Anchored VWAP and providing feedback and suggestions during the development of the indicator.
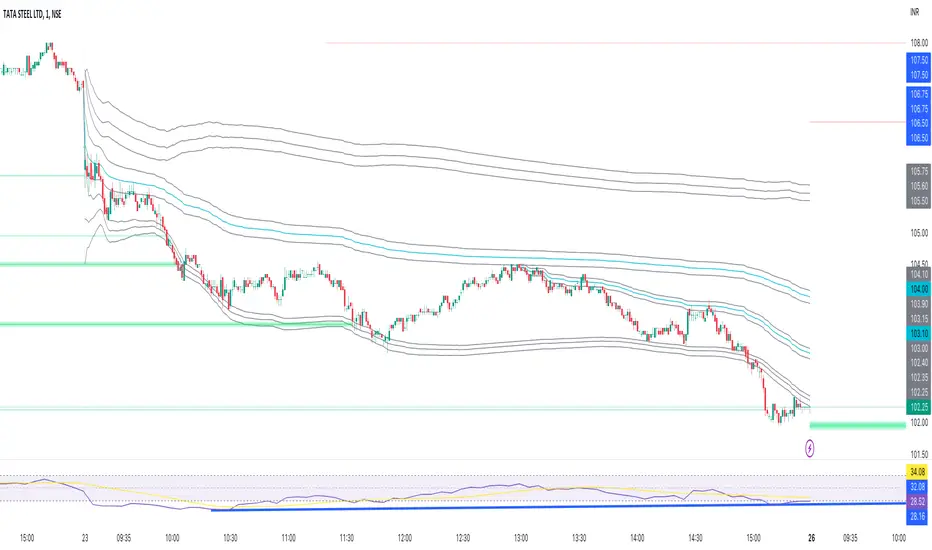
Anchored VWAP BandSimple script to anchor vwap to a drag and drop spot on the chart and display it as a band instead of a line.
the AVAP Band displays:
1. The AVWAP using High as the source
2. The AVWAP using OHLC4 as the source
3. The AVWAP using Low as the source
This is just a different way of visualising VWAP from an anchored point in time (Band vs Line)
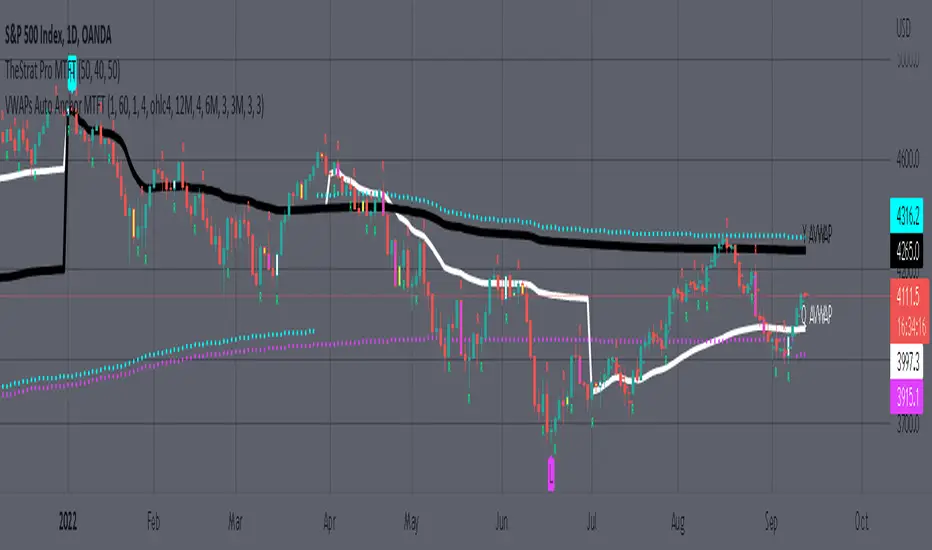
MTFT VWAPs Auto AnchoredMulti Time Frame Tools
Multi Time Frame Tools (MTFT) is a suite of scripts aimed to establish a standard timeframe-based color scheme. This can be utilized to overlay different timeframes calculations/values over a single timeframe. As one example, this would allow to observe the 5-month moving average, 5-week moving average, and 5-day moving average overlaid over each other. This would allow to study a chart, get accustomed to the color scheme and study all these at the same time much easier.
All indicators calculated using the below specific timeframes as input, will always use the color scheme outlined below. This is to get you in habit of recognizing the different timeframes overlaid in top of each other. These can be personalized.
Longer TF analysis.
Yearly - Black
Semi-Annual - Yellow
Quarterly - White
Monthly - Maroon
Weekly - Royal Blue
Daily - Lime
Shorter TF analysis.
4 hour - Fuchsia
1 hour - Orange
30 min - Red
15 min - Brown
10 min - Purple
5 min - Lilac
All color coordination is able to be modified in either the “Inputs” or “Style” section. If you need to make changes, make sure to select “Save as Default” on the bottom right of the settings menu.
Recommended Chart Color Layout
I played around with color coordination a lot. The final product was what worked best for me. I personally use the following chart settings to accent all available TF colors.
-> Click on the settings wheel on your chart. -> Click on “Appearance”.
Background - Solid -> On the top row pick the 6th color from the left.
Vert Grid Lines and Horz Grid Lines -> On the top row pick the 7th color from the left.
You may of course change these and the indicator line colors as you like.
Adding indicator to Chart
-> Open the TradingView “Indicators & Strategies” library, the icon has “ƒx”. -> All premium scripts will be located under “Invite-Only Scripts” -> Click indicator to add to your chart.
MTFT VWAPs Auto Anchored
The Anchored Volume-Weighted Average Price, Anchored VWAP, is a commonly discussed FinTwit tool. I personally found it through Brian Shannon on Twitter. I have seen big FinTwit accounts solely focus on this strategy alone and have seen other big FinTwit accounts mix with their other indicators. I will be providing very basic info to utilize this script; it is up to you to dive deep into learning this strategy. I am not an expert with the tool or a financial advisor. As with all aspects of life, I recommend you research, learn, discern and practice extensively in order to become a master.
The script has the following features.
1. Three user selected time frames auto anchored VWAPS. It will auto anchor to the start of the timeframe. Timeframes(TF) include: Yearly(Y), Semi-annually(S), Quarterly(Q), Monthly(M), Weekly(W), Daily(D), and 4 hour. Image below shows the D candlestick as the active timeframe, the anchored VWAPs for the Year, Quarter, and Month.
2. Auto hide lower timeframe calculations. Auto Hide feature will hide smaller TF calculations when a larger timeframe is selected as the display TF. Example, when the Daily timeframe candlestick selected the Weekly and Daily Anchored VWAPs are hidden because they produce very noisy results. If a lower TF is selected such as the 30 min candlestick, the previously hidden Daily and Weekly Open Anchored VWAPs are now displayed. Notice that this specific indicator calculates different with every different timeframe that is selected. The lower TF calculations are more accurate as they include additional information. Image below shows the 30 min timeframe selected with the Daily, Weekly, and Monthly Open Anchored VWAPs displayed.
3. Auto Anchor using Pivot High/Low locations. Script finds the pivot highs/lows with a user selected look back/forward period. Additionally, as new pivot highs/lows appear you can choose to keep up to 4 each previous pivot high/low anchored VWAPs displayed. Image below has a 40 look back/forward period selected, and 2 past AVWAPs enabled.
You may notice in the above image that there is a gap between the AVWAP plot and the marked pivot point. This is not something that can be avoided as the script has to look forward in order to verify the pivot. The calculation is still correct, this can be verified by manually adding an “Anchored VWAP” drawing and seeing the values align. Image below shows that they match. White lines are the manually added “Anchored VWAP” drawings. If you verify this for yourself, make sure to select the correct input source in the settings of the drawing.
4. Auto Anchored on IPO High/Low. Looks for the first available candlestick in a chart and anchors to the high and low. This is useful with newer companies with recent IPOs.
IMPORTANT NOTE to TradingView admin: One of the lessons I would consider most important in attaining clarity regarding trading, is “TheStrat” by Rob Smith. His lesson on “actionable signals” is something that can be applied to any strategy. For this reason, I am including “MTFT TheStrat Patterns Pro” script in all images that will depict confluence for a better trade selection.
Example using TheStrat Pro MTFT with this indicator.
Look for a “TheStrat actionable signal” or a “TheStrat Reversal signal” on a smaller timeframe that has an instance of this indicator on a larger timeframe calculation that is in range of the candlestick that formed your actionable signal. This means that the indicators plot you are observing must be above the low and below the high of the candlestick that is the actionable signal/reversal signal.
The Image below shows what this would look like with this indicator. The selected candlestick is the 2-day, it shows a 1-3-1 pattern and the Quarter Anchored VWAP in range. This actionable signal could be played in both directions. If the high is breached, you would enter a long position from the high of the inside candlestick. If the low is breached than you would enter a short. For targets you would look at the previous pivots, for this example all targets were hit. Note that the “Entry” and “Targets” line were added manually and are not part of the script. Setups won’t always play out so nice and clean, but given that there is so many stocks and so many signals this is just a thought to improve the quality of the signal as it has extra confluence. If you are interested in learning further, research ‘TheStrat’ by Rob Smith.
Donchian Anchored Vwap + HandoffsIn this script I try to incorporate Brian Shannon's Anchored VWAP hand off system into an automated initial anchoring system using Donchian Highs and Lows.
I have also added an average of all the hand-off vwaps.
Higher values in "Donchain Lookback" will display longer term sentiment and vice versa.
*Credit to trader dysrupt for their 'Anchored VWAP Hand-off' script
Automated Anchored VWAPThis was reasonably easy to put together and I can't find one that does this in the Library and I've been wanting one. Of course, the drawing tool is just fantastic, but sometimes it can be forgotten as new pivots emerge.
What you'll find elsewhere in the Library is a nice variety of fancier methods for determining an anchor point with labels, lines, timestamps and standard deviations.
This is just a simple script to pull the Anchored VWAP off of the most recent pivot and update that as new pivots become defined.
I wanted it to be really portable so it could easily work into other things you're working on while also keeping the chart reasonably clean.
The way this functions is as follows: A new pivot is found and VWAP is calculated from it. At that point the prior aVWAP is no longer tracked and it picks up from the new pivot .
Of course this means that the plot doesn't generate until the pivot is actually confirmed, which in turn means that the plot doesn't reach back to the pivot , it begins based on whatever "right bars" period you end up choosing.
I kind of like it that way, because you have your eyes on the one that matters until the new one matters.
The downside is that it doesn't track old pivots . The old aVWAP might still be in play. But if you track all of the old one's you'll have a 100 lines on your chart and no one wants that.
I recommend when you look back and think the old one is still in play, use the drawing tool to keep it on the chart.
Otherwise, let the script do the work for you.
Hope its helpful. Let me know what you think should be done to make it better.

[TTI] Pinch AVWAPs––––History & Credit
This indicator came from studying Alpha trends and the concept from CMT Brian Shannon
–––––What it does
Upon uploading choose two dates from which the script will calculate Anchored VWAP from both dates. The dates can be easily moved for faster adjustment and re-calculation.
–––––How to use it
If you are trading a breakout methodology like myself, look for the "pinch" of the AVWAPs. Preferably, a bottom AVWAP moving up and a top AVWAP moving down. Choose important dates (this is rather subjective) for the AVWAP dates. These can be important events like Earnings or Divident Announcements. Or places where there is a change of structure of the Supply and Demand dynamic.

Anchored VWAP with Custom Volume IndexNot a regular AVWAP - this one allows you to use up to 39 sources added together as your volume source
This enables you to use many different pairs from many different exchanges when dealing with crypto
OR you can enhance your intermarket analysis charting abilities enabling you to place the AVWAP on multiple symbols on one chart
Hope you enjoy!
NOTE:
All the symbols must have a history that goes back as far as the chosen date!
When placing at a date in the past, ensure all the sources of volume have history going back as far as you have chosen OR the AVWAP will not appear

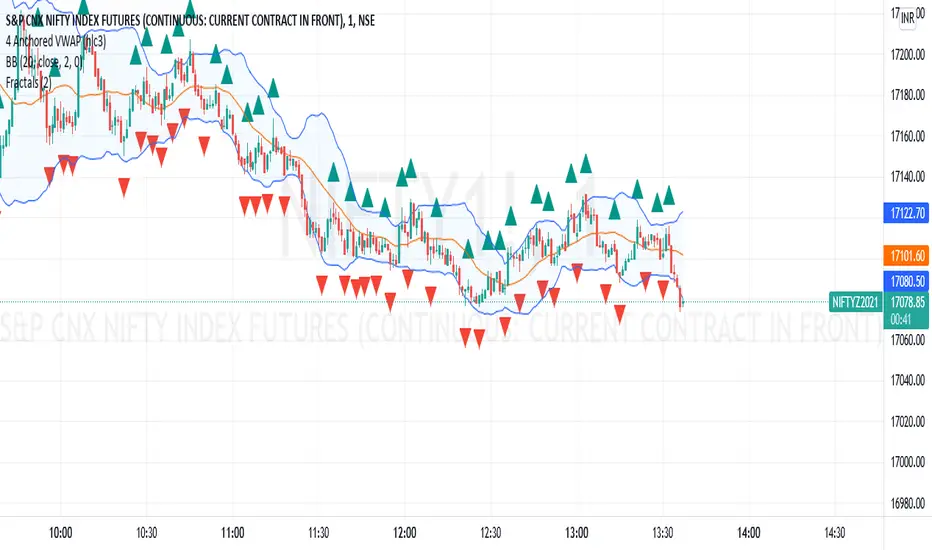
4 Anchored VWAP4 Anchored VWAP all together. This indicaor can be used as dynamic support and resistance.
Just apply and set dates
Anchored VWAPs + DeviationsAnchored VWAPS
*6 anchors to play with
*Pre-defined anchors from pivot points (May need manual adjustment due to timezone difference)
*Drag each anchor right from the screen instead of manually going to the settings>inputs
Deviations:
*Select from which anchor should the deviations start from
*Manually input the desired deviation value/ratio, can be customised
**Tips: To avoid clicking on the AVWAPS to enable the dragging line, just click on the title of the indicator.
***Work in progress

Auto Anchored Volume Weighted Average Price - Custom AVWAP
Based on Brian Shannon's AVWAP - This indicator anchors vwap to the highest high, lowest low and highest volume bar of a user defined lookback period.
In the chart example above on AVAX, the lookback period is set to 90 days
- The blue line depicts AVWAP from the highest bar in in the last 90 dats
- The purple Line is AVWAP from the lowest bar in the last 90 days
- The golden line is AVWAP from the highest volume bar in the last 90 Days
These levels act as a price magnet and strong levels of support and resistance. I use them to identify chart locations for where I want to do business and look for trade setups.
Unlike moving averages, AVWAP will maintain it's chart position no matter the chart resolution. One way to take advantage of this is to wait for price to get to one of these levels, go to lower timeframes and find low risk setups based on your trading strategy.
You can customise the look and feel and which anchors you want displayed. You can use multiple instances with varying lookback periods to display shorter and longer term levels simultaneously

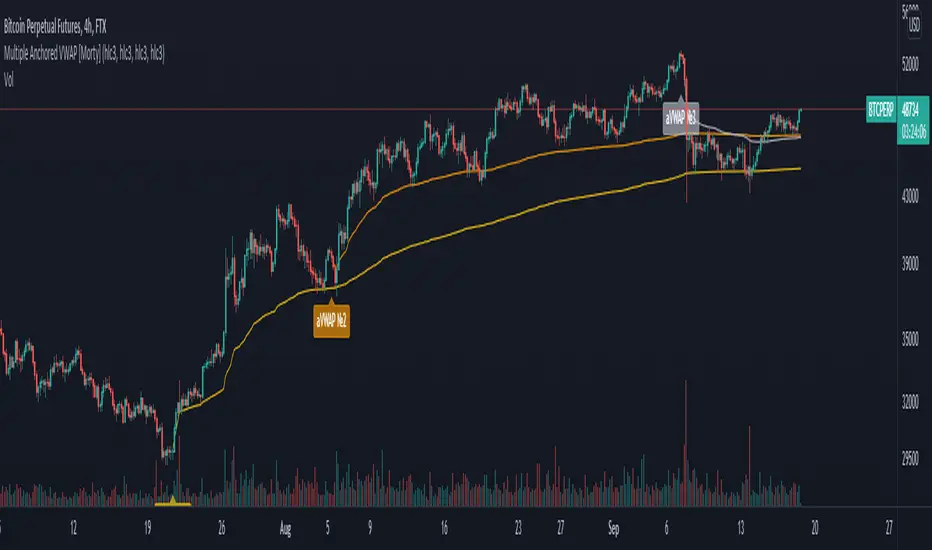
Multiple Anchored VWAP [Morty]The Anchored VWAP (aVWAP) indicator ties VWAP calculations to a specific price bar chosen by the trader. Anchored VWAP allows you to specify the price bar where calculations begin, making it easy to see whether the bulls or bears have been in charge since a very specific point in time. The starting price bar that is chosen generally marks a shift in market psychology, such as a significant high or low, earnings, news, or other announcements. The Anchored VWAP line is charted using price and volume data from that significant event onward.
This indicator plots up to 4 aVWAP lines in the chart.
Features:
- plot up to 4 aVWAP lines
- custom start date of aVWAP
- custom line color
- optional label of starting price bar
- optional custom resolution
----------------------------------------------------
锚定VWAP(aVWAP)指标将VWAP的计算与交易者选择的特定价格柱联系起来。锚定VWAP允许你指定计算开始的价格柱,使你很容易看到自一个非常具体的时间点以来,是牛市还是熊市在起作用。所选择的起始价格条通常标志着市场心理的转变,如一个重要的高点或低点、收益、新闻或其他公告。锚定VWAP线是使用从该重大事件开始的价格和成交量数据绘制的。
该指标在图表中最多绘制了4条aVWAP线。
特色:
- 绘制多达4条aVWAP线
- 自定义aVWAP的开始日期
- 自定义线的颜色
- 可选的起始价格条的标签
- 可选的自定义分辨率
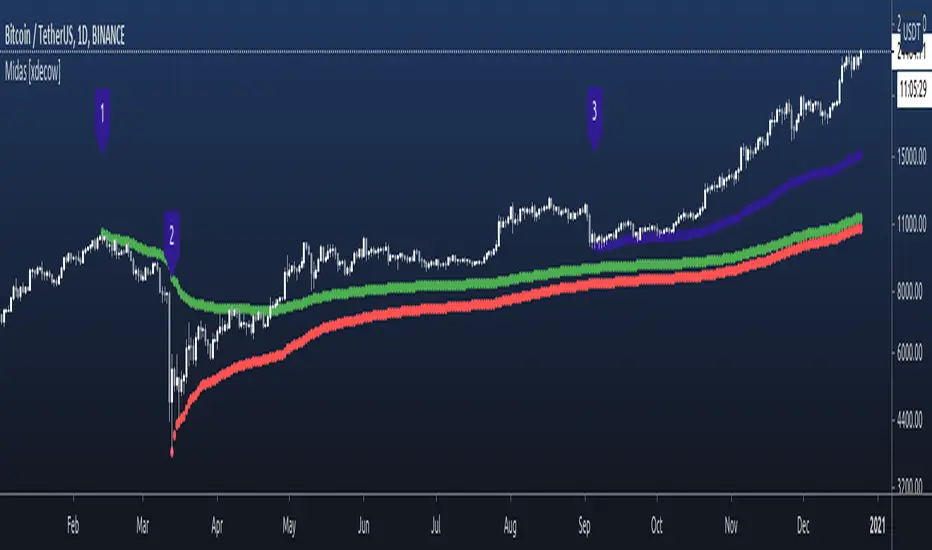
Nubia - Auto Midas Anchored VWAP [xdecow]This indicator looks for the highs and lows using the highest / lowest of 4 different periods. The default values are 17, 72, 305 and 1292 inspired by BO Williams phicube fractals.
The indicator will show anchored vwaps from those 8 dynamic points (4 tops and 4 bottoms).
A true trend is defined when 4 fractals line up without much opposite resistance (only the two smallest opposing vwaps).
When the price is between several vwaps it is a sign of consolidation or pullback. You can use larger timeframes to check for possible targets in large consolidations and pullbacks.

MTF Anchored VWAPAnchored VWAP is all the rage, but it's just one indicator. That being said, it seems like people want to add more than one at a time so why eat into your indicator cap. This script will allow you to configure 5 AVWAPS at a time.
This will not plot if the time chosen is not in market hour s. Note: market hours may be outside of YOUR timeframe. i.e, the market may open at 7:30 your time, but it will not plot until you change it to 9:30.
Enjoy

Midas 6 Anchored VWAP [xdecow]This script plots 6 anchored vwap from the selected bars.
The labels are only to help identify the starting points and can be disabled in the options.
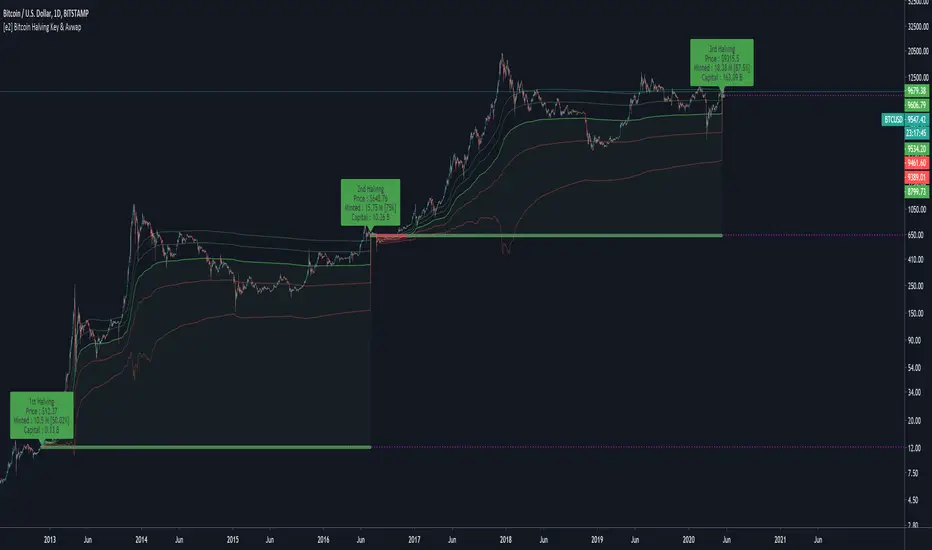
[e2] Bitcoin Halving Key & AvwapThis indicator shows a Key Level Support & Resistance level and VWAP that reset on your choice of the Bitcoin's halving date.
Optional Key Calculation Mode:
- Start with first (2012) or second (2016) halving date.
- Start with first and reset on the second (Halving to halving mode)
- Start with every next halving simultaneously (Halving + halving mode)
Labels show the Market Capitalization, total minted Bitcoins and Bitcoin's close price on the halving's date.
A maximum of 5 bands calculated using a factor of the anchored VWAP's standard deviation can be displayed.
Note
- The script is designed for Bitcoin markets only.
- Estimated 3rd halving, script will be updated when next halving occurs.
[e2] EDS Key & AvwapThis indicator shows a Key Level Support & Resistance level and VWAP that resets on your choice of the stock's Earnings , Dividends or Splits release date.
A maximum of 8 bands calculated using a factor of the anchored VWAP's standard deviation can be displayed.
Note
The script is designed for stock-trading only.
Credits
Inspired by timwest , LazyBear 's Earnings S/R Levels and MichelT 's Earnings, Splits, Dividends scripts.

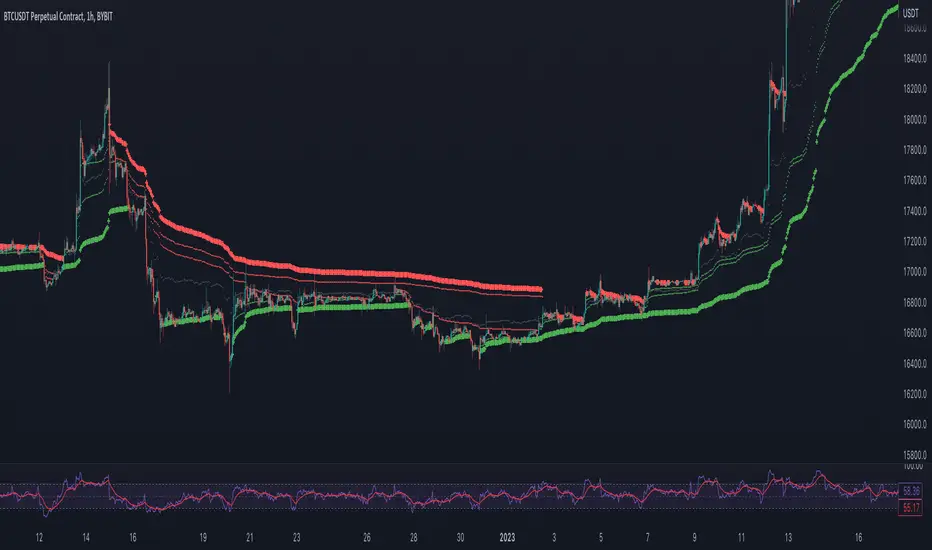
[KICK] Ultimate VWAPsThis indicator provides numerous indicator tools/functions all related to Volume Weighted Price Averages (VWAPs). Specifically the ability to add multiple anchored VWAPs to arbitrary points (highs, lows, significant events such as earnings , flash crashes, etc...) is a very powerful way to see where market participants that were active at those times are in regards those positions relative to current price.
With this indicator you can:
Enable a typical session-based VWAP (resets every session) - does not render line from last candle of session to first candle of new session so as to keep your charts looking a bit neater.
Enable a week-to-date VWAP , month-to-date VWAP , or year-to-date VWAP
Enable an anchored VWAP that can be automatically anchored to the high within the last week (timeframe independent) or to a high within a certain number of candles back, or set to a specific date and time. There is also an "ignore" recent candle filter if using the candle range method for auto-locating the high.
Enable an anchored VWAP that can be automatically anchored to the low within the last week (timeframe independent) or to a low within a certain number of candles back, or set to a specific date and time. There is also an "ignore recent candle" filter if using the candle range method for auto-locating the low.
The week/month/year-to-date VWAP can also be treated as an Ad-Hoc anchored VWAP and have it’s anchor set to an arbitrary date and time.
A support/resistance line can be added in for the last session’s VWAP close.
Z-Score bands can be added (band values configurable) and attached to any of the above VWAPs (Session, AutoHigh, AutoLow, AdHoc/Week/Month/Year). These are calculated using the proper unbiased standard deviation calculation (not the built in PineScript biased stdev function).
(note: not all functionality is shown in the chart above because it would be a mess - all the options for this indicator are not necessarily intended to be used simultaneously on the same chart, though they can be if you really like that sort of thing)
Use the link below to watch a tutorial video, request a trial, or purchase for access.
