Accumulation/Distribution Line (Volume Surge Markers) - TPThis indicator plots a classic Accumulation/Distribution (A/D) Line, built manually from the candle’s close position and volume, then adds circle markers when volume spikes versus the previous bar.
What the A/D Line means (in plain English)
Think of each candle as a “battle” between buyers and sellers:
If the candle closes near the high, that bar is treated as buying pressure (accumulation).
If the candle closes near the low, that bar is treated as selling pressure (distribution).
If it closes near the middle, it’s more neutral.
The script converts that “close location” into a score from -1 to +1, multiplies it by volume, then cumulates it over time.
So the A/D line rises when “buying-style” bars dominate, and falls when “selling-style” bars dominate.
Volume Surge Circles
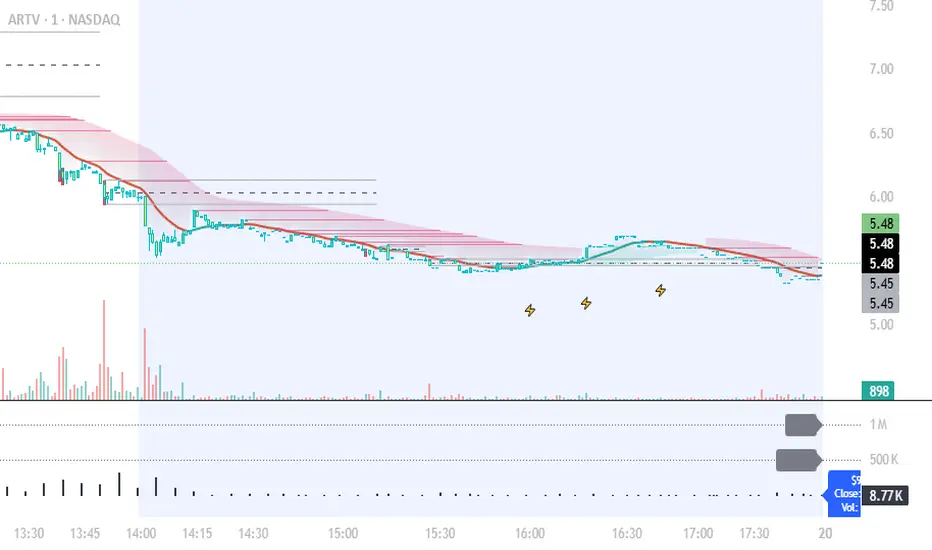
A circle prints when the current bar’s volume is at least 50% higher than the previous bar (default).
This helps you spot moments where participation suddenly increases and can confirm (or warn) about moves.
Best way to use it
This tool is most useful when you overlay it on the price chart (like in the screenshot), so you can quickly compare:
price trend vs A/D trend (divergences),
and where volume surges occur relative to breakouts, pullbacks, or reversals.
Tip: Watch for cases where price keeps rising but the A/D line goes flat or down — that can hint the move is losing real accumulation.
Wskaźnik Pine Script®