OPEN-SOURCE SCRIPT
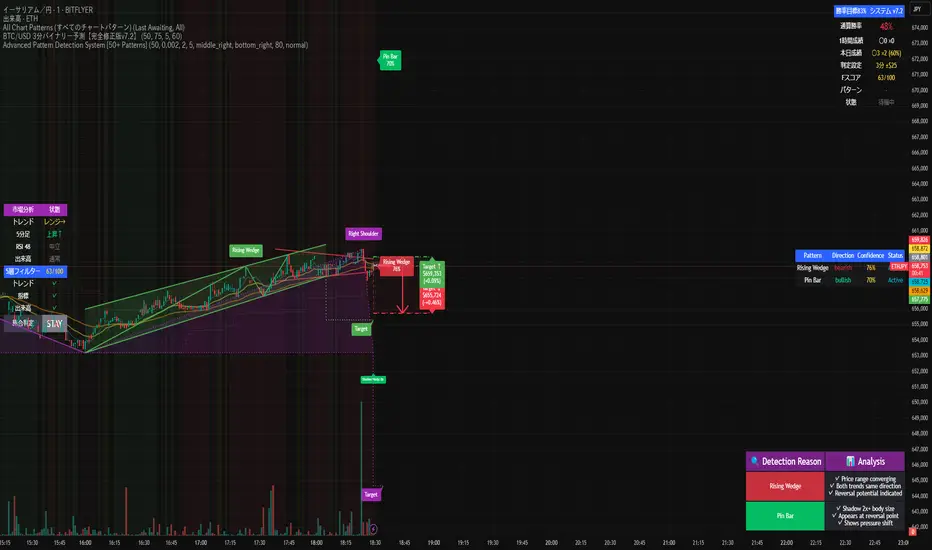
Advanced Pattern Detection System [50+ Patterns]

【Advanced Pattern Detection System - Auto-detects 50+ Chart Patterns】
Introducing the most powerful pattern detection indicator for TradingView!
◆ What is this?
An automated tool that finds and displays over 50 chart patterns on your charts. It detects all the patterns professional traders use - Double Tops, Triangles, Head & Shoulders, and more - all in ONE indicator.
◆ Main Features
・Detects 50+ patterns in real-time
・Shows visual explanation of WHY each pattern was identified
・Automatically calculates theoretical target prices
・Displays confidence levels in % (60-95%)
・Choose panel position from 9 locations
・Works on all timeframes (1min to Monthly)
◆ Detectable Patterns
1. Classic Patterns (Double Top/Bottom, Head & Shoulders, etc.)
2. Triangle Patterns (Ascending, Descending, Symmetrical, Expanding)
3. Continuation Patterns (Flags, Pennants, Wedges, etc.)
4. Harmonic Patterns (Gartley, Butterfly, Bat, etc.)
5. Price Action (Pin Bar, Engulfing, Hammer, etc.)
6. Special Patterns (Cup & Handle, V-formations, etc.)
◆ What Makes It Different
・Not just detection - shows the reasoning behind it
・Auto-draws pivot points and necklines
・Displays target prices with % gain/loss from current price
・Detects multiple patterns simultaneously, sorted by confidence
・Available in both Japanese and English versions
◆ Perfect For
✓ Anyone tired of using multiple indicators
✓ Beginners wanting to learn pattern trading
✓ Traders who don't want to miss entry points
✓ Those looking to improve discretionary trading accuracy
◆ How to Use (Easy 3 Steps)
1. Open TradingView and paste code in Pine Editor
2. Click "Add to Chart"
3. Enable only the patterns you need in settings
◆ Color Meanings
Green → Bullish potential (Buy signal)
Red → Bearish potential (Sell signal)
Yellow → Neutral direction (Wait and see)
◆ Recommended Settings
Scalping: Detection period 20, Sensitivity 0.0025
Day Trading: Detection period 50, Sensitivity 0.002
Swing Trading: Detection period 100, Sensitivity 0.0015
◆ Real Trading Example
"Detects Double Bottom → 85% confidence → Enter on neckline break → Take profit at displayed target price"
This is how you can use it in practice.
◆ Important Notes
・This is an analysis tool, not investment advice
・Always combine with other indicators
・Always set stop losses
・Practice on demo account before live trading
◆ Performance
If running slow, turn OFF unused pattern categories. Reducing max display count to 3 also helps.
◆ Summary
This single tool provides functionality that would normally require multiple paid indicators (worth $100-200 total). It's the ultimate pattern detection system recommended for all traders, from beginners to professionals.
Give it a try if interested! Feel free to ask questions in the comments.
Skrypt open-source
W zgodzie z duchem TradingView twórca tego skryptu udostępnił go jako open-source, aby użytkownicy mogli przejrzeć i zweryfikować jego działanie. Ukłony dla autora. Korzystanie jest bezpłatne, jednak ponowna publikacja kodu podlega naszym Zasadom serwisu.
Wyłączenie odpowiedzialności
Informacje i publikacje nie stanowią i nie powinny być traktowane jako porady finansowe, inwestycyjne, tradingowe ani jakiekolwiek inne rekomendacje dostarczane lub zatwierdzone przez TradingView. Więcej informacji znajduje się w Warunkach użytkowania.