OPEN-SOURCE SCRIPT
GC RSI Columns V2016

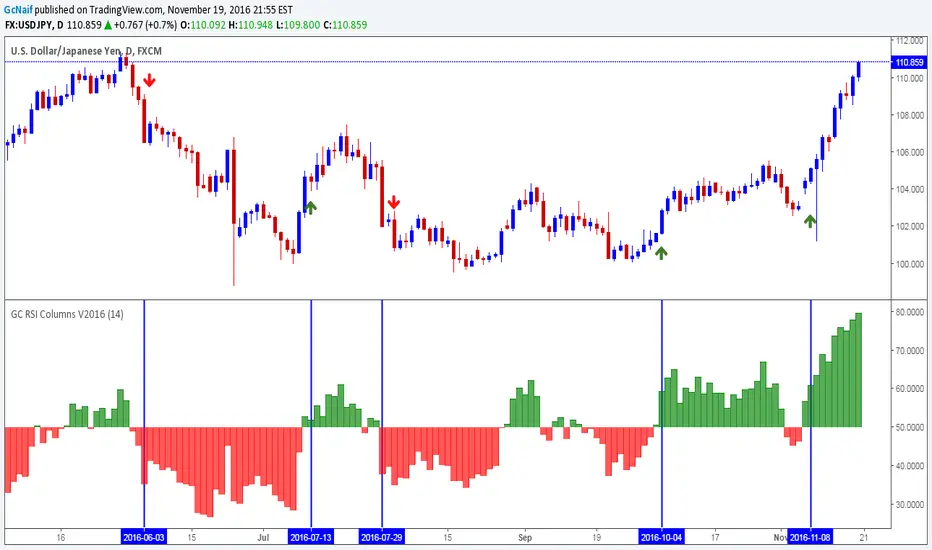
This is a basic RSI indicator but in column format.I had been using this for a while and it gives a nice visual representation of trend change by changing color of the column.
Base line is 50 level. Anything above 50 is buy opportunity and below 50 is sell opportunity . Try it on higher time frames and see the results.
Example on chart above.
Note: i published it on demand. many folks were asking me for this ,since it(column rsi) was not available in public indicators
Base line is 50 level. Anything above 50 is buy opportunity and below 50 is sell opportunity . Try it on higher time frames and see the results.
Example on chart above.
Note: i published it on demand. many folks were asking me for this ,since it(column rsi) was not available in public indicators
Skrypt open-source
W zgodzie z duchem TradingView twórca tego skryptu udostępnił go jako open-source, aby użytkownicy mogli przejrzeć i zweryfikować jego działanie. Ukłony dla autora. Korzystanie jest bezpłatne, jednak ponowna publikacja kodu podlega naszym Zasadom serwisu.
I am a Chart Slave.Thank you TradingView and @nmike.
Wyłączenie odpowiedzialności
Informacje i publikacje nie stanowią i nie powinny być traktowane jako porady finansowe, inwestycyjne, tradingowe ani jakiekolwiek inne rekomendacje dostarczane lub zatwierdzone przez TradingView. Więcej informacji znajduje się w Warunkach użytkowania.