OPEN-SOURCE SCRIPT
Double RSI
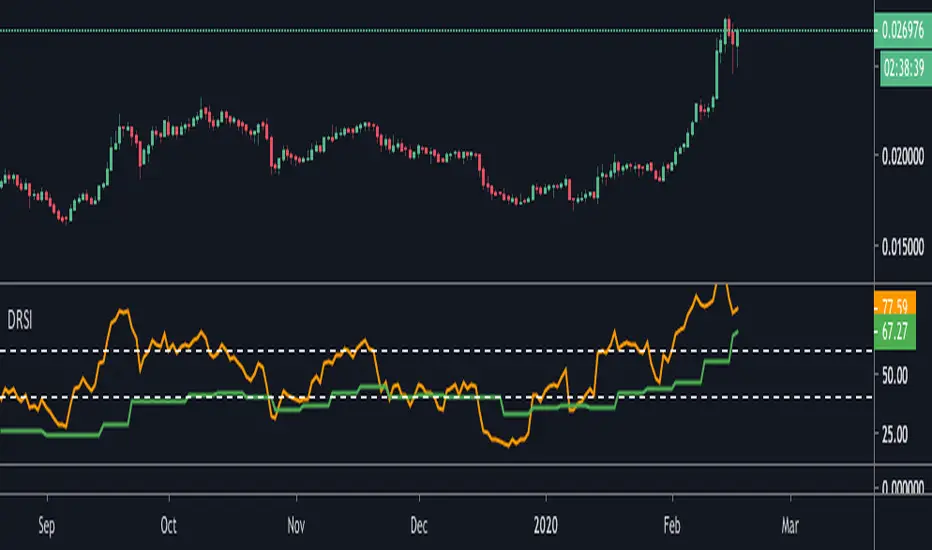
This is double RSI script which plots one time frame higher RSI along with the current time frame i.e
For Weekly chart it display Weekly and Monthly RSI
For Daily chart it display Daily and Weekly RSI
For Intraday chart it display Intraday and Daily RSI.
Usage:
If Daily RSI is above 60 and weekly above 40 and moving up then stock is in a good uptrend look for buying when Daily takes support at 60. Usually First test of Daily produces a good entry for subsequent entries probability decreases.
For Downtrend look for Daily RSI below 40 and weekly below 60.
Skrypt open-source
W zgodzie z duchem TradingView twórca tego skryptu udostępnił go jako open-source, aby użytkownicy mogli przejrzeć i zweryfikować jego działanie. Ukłony dla autora. Korzystanie jest bezpłatne, jednak ponowna publikacja kodu podlega naszym Zasadom serwisu.
Wyłączenie odpowiedzialności
Informacje i publikacje nie stanowią i nie powinny być traktowane jako porady finansowe, inwestycyjne, tradingowe ani jakiekolwiek inne rekomendacje dostarczane lub zatwierdzone przez TradingView. Więcej informacji znajduje się w Warunkach użytkowania.