OPEN-SOURCE SCRIPT
TASC 2023.03 Every Little Bit Helps
█ OVERVIEW
TASC's February 2023 edition of Traders' Tips includes an article titled "Every Little Bit Helps: Averaging The Open And Close To Reduce Noise" by John Ehlers. This code implements the numerical example from this article.
█ CONCEPTS
Using theories from digital signal processing as a starting point, John Ehlers argues that using the average of the open and close as the source time series of an indicator instead of using only the closing price can often lead to noise reduction in the output. This effect especially applies when there is no gap between the current bar's opening and the previous bar's closing prices. This trick can reduce noise in many common indicators such as the RSI, MACD, and Stochastic.
█ CALCULATIONS
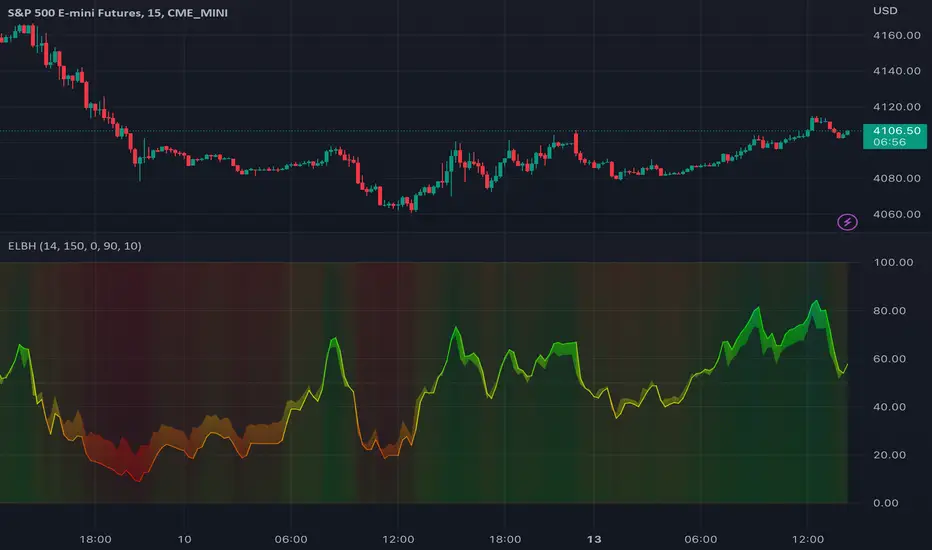
Following the example presented in the original publication, this script illustrates the proposed strategy using the Relative Strength Index (RSI) as a test indicator. It plots two series:
This script demonstrates that using the average of open and close as the calculation source results in a smoother indicator. To visually emphasize the advantage of this proposed trick, the script's color scheme is sensitive to both the RSI value and the difference between the two RSI data streams.
TASC's February 2023 edition of Traders' Tips includes an article titled "Every Little Bit Helps: Averaging The Open And Close To Reduce Noise" by John Ehlers. This code implements the numerical example from this article.
█ CONCEPTS
Using theories from digital signal processing as a starting point, John Ehlers argues that using the average of the open and close as the source time series of an indicator instead of using only the closing price can often lead to noise reduction in the output. This effect especially applies when there is no gap between the current bar's opening and the previous bar's closing prices. This trick can reduce noise in many common indicators such as the RSI, MACD, and Stochastic.
█ CALCULATIONS
Following the example presented in the original publication, this script illustrates the proposed strategy using the Relative Strength Index (RSI) as a test indicator. It plots two series:
- RSI calculated using only closing prices as its source.
- RSI of the same length as the first, but calculated using the average of open and close prices as its source, i.e. (open+close)/2.
This script demonstrates that using the average of open and close as the calculation source results in a smoother indicator. To visually emphasize the advantage of this proposed trick, the script's color scheme is sensitive to both the RSI value and the difference between the two RSI data streams.
Skrypt open-source
W zgodzie z duchem TradingView twórca tego skryptu udostępnił go jako open-source, aby użytkownicy mogli przejrzeć i zweryfikować jego działanie. Ukłony dla autora. Korzystanie jest bezpłatne, jednak ponowna publikacja kodu podlega naszym Zasadom serwisu.
Tools and ideas for all Pine coders: tradingview.com/u/PineCoders/
TASC: traders.com/
TASC: traders.com/
Wyłączenie odpowiedzialności
Informacje i publikacje nie stanowią i nie powinny być traktowane jako porady finansowe, inwestycyjne, tradingowe ani jakiekolwiek inne rekomendacje dostarczane lub zatwierdzone przez TradingView. Więcej informacji znajduje się w Warunkach użytkowania.