PROTECTED SOURCE SCRIPT
Zaktualizowano SMT Divergence [promuckaj]

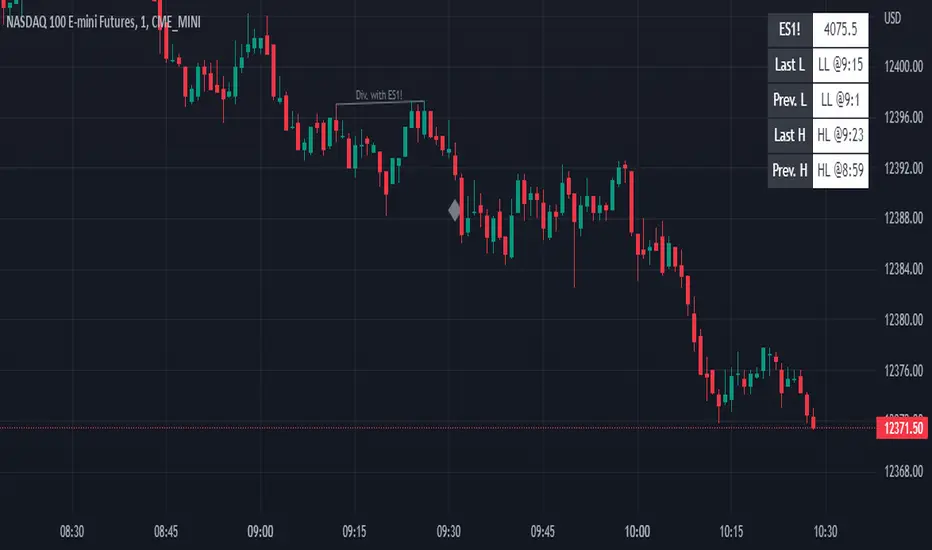
SMT Divergence indicator will track your main symbol on the chart against other one you set, for example you can use it on S&P 500 chart while you set there to track and compare it with Nasdaq, it will search for divergence between them, according to swing points, and print it on the chart for you.
There is option to set custom swing points period, colors, lines, debug info panel that will show you in real time values and times of last two swing highs and lows points that is formed on second symbol you want to track.
You can activate also alerts for bullish and bearish divergences separately, as you wish.
There is option to setup divergence types you want to get:
#1
100% aligned divergences only - means both swing points are aligned at the same bar and time between two assets.
#2
all divergences - means you will get also the rest potential divergences that is not 100% aligned between two assets according to swing points. This means that, while swing points is formed on main symbol, indicator will compare their bars and times to the second symbol and if it looks like divergence you will get it on the chart.
Just to clarify "divergence" between two symbols, it means that for bearish one symbol need to form higher low while the other need to form higher high, and vice versa for bullish, lower low / lower high.
Everyone enjoy !
Informacje o Wersji
Added option to choose last swing points type for each divergence to look, which means now you can set desired last swing highs/lows point to be considered for divergence on main symbol.This can be very useful for those users who want to filter divergence to get only specific one.
Added options include separately settings for High and Low swing points on both type of divergences (bullish/bearish) separately:
Swing High => "none", "HH", "HL"
Swing Low => "none", "LL", "LH"
"none" - means does not matter
"HH" - consider only higher high
"HL" - consider only higher low
"LL" - consider only lower low
"LH" - consider only lower high
One example for bearish:
If indicator is set to track SP vs NQ, while SP is main symbol, if you set to get bearish divergence only if there is formed last swing higher high (HH) point for it, on this way there will be no divergence on SP vs NQ if there is formed HL point. On this way indicator will wait to get only HH on SP while on NQ must be formed HL. There is a lot possibility to do settings on your own way for this, since you can set H and L points separately for each type of divergence.
Everyone enjoy !
Informacje o Wersji
Very useful update !Added option to activate use of reversed chart of second symbol, which is good to track divergences for example between DXY or any other symbol that is going to opposite direction to the main symbol. As a good example this can be very useful to track divergences between EURUSD and DXY.
Everyone enjoy !
Informacje o Wersji
Added option for two more symbols, so now there is option to choose 3 symbols in total to track for their divergences at once, with all the settings including reversed chart for each.Informacje o Wersji
-Added option to set swings period for left/right bars separately.-Added option to change labels size.
Informacje o Wersji
Small fix.Skrypt chroniony
Ten skrypt został opublikowany jako zamknięty kod źródłowy. Można z tego korzystać swobodnie i bez żadnych ograniczeń — więcej informacji znajduje się tutaj.
Wyłączenie odpowiedzialności
Informacje i publikacje nie stanowią i nie powinny być traktowane jako porady finansowe, inwestycyjne, tradingowe ani jakiekolwiek inne rekomendacje dostarczane lub zatwierdzone przez TradingView. Więcej informacji znajduje się w Warunkach użytkowania.
Skrypt chroniony
Ten skrypt został opublikowany jako zamknięty kod źródłowy. Można z tego korzystać swobodnie i bez żadnych ograniczeń — więcej informacji znajduje się tutaj.
Wyłączenie odpowiedzialności
Informacje i publikacje nie stanowią i nie powinny być traktowane jako porady finansowe, inwestycyjne, tradingowe ani jakiekolwiek inne rekomendacje dostarczane lub zatwierdzone przez TradingView. Więcej informacji znajduje się w Warunkach użytkowania.