PROTECTED SOURCE SCRIPT
Zaktualizowano Cilbaga Indikator Tables
General Purpose
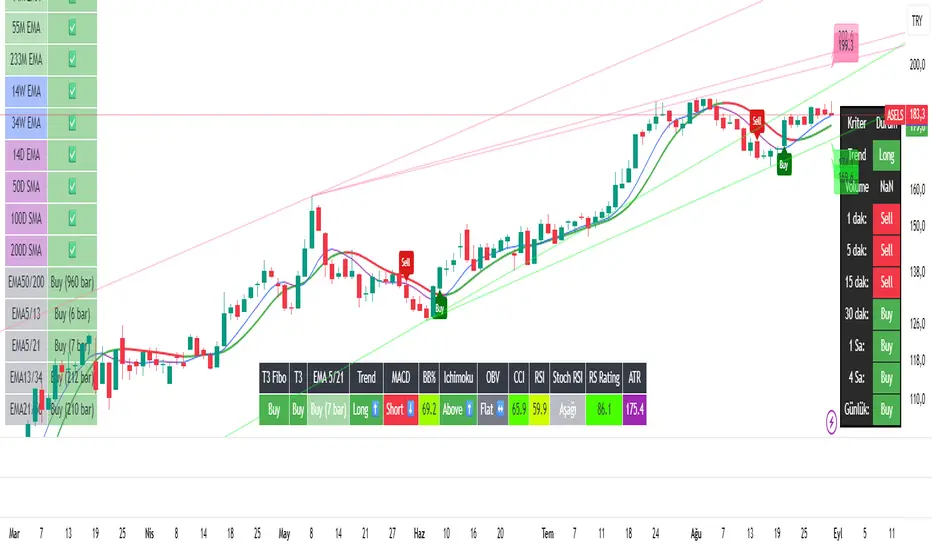
This indicator provides decision support by multidimensionally analyzing the technical information of an asset (stocks, crypto, forex, etc.) with personalized visual charts and signals. It supports both trend tracking and multi-timeframe analysis. Key Features and Functions Multi EMA/SMA Analysis Displays Exponential Moving Averages (EMA) and Simple Moving Averages (SMA) on monthly, weekly, and daily bases.
Indicates whether the price is above or below these averages with / symbols.
Generates signals from crossovers, such as EMA50/200, EMA5/13, and EMA5/21.
Crossover Signals EMA crossovers (e.g., 50 and 200) are labeled as "BUY" or "SELL" signals.
Shows how long ago the crossover occurred (e.g., "5 days ago").
These signals can be displayed as labels on the chart (optional).
T3 Indicator and T3 Fibo The T3 indicator, an advanced smoothing tool for trend tracking, generates BUY/SELL signals based on direction (up/down).
T3 Fibo is an alternative T3 version calculated with different weights (e.g., 0.618 golden ratio).
Both are drawn with colors (green = bullish, red = bearish).
Multi-Timeframe Analysis Displays trend status based on the 144 EMA across different timeframes (1D, 15m, 1H, 4H, daily, etc.).
Provides users with "Long" (buy) or "Short" (sell) signals for short- and long-term trend perspectives.
Technical Indicator Signal Unit (Signal Table)
Combines the status of the following in a table: Trend: 55 EMA and 200 EMA
MACD: Positive or negative?
Ichimoku: Is the price above or below the cloud?
OBV (On-Balance Volume): Is the volume trend upward?
RSI: Overbought/oversold levels
Stoch RSI: Short-term momentum
Bollinger Bands % (BB%): Price position relative to the bands
CCI: Overbought/oversold and momentum
RS Rating: Relative strength compared to a selected index (e.g., BIST:XU100)
ATR(STOP!): Volatility-based support/resistance levels
Visual Presentation
Three customizable tables provide: EMA/SMA Status and Crossovers
Summary Table of All Signals
Multi-Timeframe Trend (EzAlgo)
Users can adjust the content, colors, transparency, and visibility of the tables.
User Customization Options Enable/disable lines, labels, and tables.
Customize visual settings such as color, position, and size.
Select a custom benchmark for RS Rating (e.g., SP500, BIST100).
Adjust T3 parameters (length, volume factor).
Who Is This Indicator For? Ideal for those who rely on technical analysis and trend tracking.
Suitable for day traders and medium- to long-term investors monitoring multiple timeframes.
Acts as a decision-support system for those who want to view signals from multiple indicators in one place.
In Summary:
The "Cilbaga Indicator Tables" is a user-friendly decision-support indicator with multi-timeframe and multi-indicator analysis, supported by visual charts. It combines trend, momentum, and relative strength analyses in one place to inform buy/sell decisions.
Informacje o Wersji
General PurposeThis indicator provides decision support by multidimensionally analyzing the technical information of an asset (stocks, crypto, forex, etc.) with personalized visual charts and signals. It supports both trend tracking and multi-timeframe analysis. Key Features and Functions Multi EMA/SMA Analysis Displays Exponential Moving Averages (EMA) and Simple Moving Averages (SMA) on monthly, weekly, and daily bases.
Indicates whether the price is above or below these averages with / symbols.
Generates signals from crossovers, such as EMA50/200, EMA5/13, and EMA5/21.
Crossover Signals EMA crossovers (e.g., 50 and 200) are labeled as "BUY" or "SELL" signals.
Shows how long ago the crossover occurred (e.g., "5 days ago").
These signals can be displayed as labels on the chart (optional).
T3 Indicator and T3 Fibo The T3 indicator, an advanced smoothing tool for trend tracking, generates BUY/SELL signals based on direction (up/down).
T3 Fibo is an alternative T3 version calculated with different weights (e.g., 0.618 golden ratio).
Both are drawn with colors (green = bullish, red = bearish).
Multi-Timeframe Analysis Displays trend status based on the 144 EMA across different timeframes (1D, 15m, 1H, 4H, daily, etc.).
Provides users with "Long" (buy) or "Short" (sell) signals for short- and long-term trend perspectives.
Technical Indicator Signal Unit (Signal Table)
Combines the status of the following in a table: Trend: 55 EMA and 200 EMA
MACD: Positive or negative?
Ichimoku: Is the price above or below the cloud?
OBV (On-Balance Volume): Is the volume trend upward?
RSI: Overbought/oversold levels
Stoch RSI: Short-term momentum
Bollinger Bands % (BB%): Price position relative to the bands
CCI: Overbought/oversold and momentum
RS Rating: Relative strength compared to a selected index (e.g., BIST:XU100)
ATR(STOP!): Volatility-based support/resistance levels
Visual Presentation
Three customizable tables provide: EMA/SMA Status and Crossovers
Summary Table of All Signals
Multi-Timeframe Trend (EzAlgo)
Users can adjust the content, colors, transparency, and visibility of the tables.
User Customization Options Enable/disable lines, labels, and tables.
Customize visual settings such as color, position, and size.
Select a custom benchmark for RS Rating (e.g., SP500, BIST100).
Adjust T3 parameters (length, volume factor).
Who Is This Indicator For? Ideal for those who rely on technical analysis and trend tracking.
Suitable for day traders and medium- to long-term investors monitoring multiple timeframes.
Acts as a decision-support system for those who want to view signals from multiple indicators in one place.
In Summary:
The "Cilbaga Indicator Tables" is a user-friendly decision-support indicator with multi-timeframe and multi-indicator analysis, supported by visual charts. It combines trend, momentum, and relative strength analyses in one place to inform buy/sell decisions.
evvelsi gün
Sürüm Notları
General Purpose
This indicator provides decision support by multidimensionally analyzing the technical information of an asset (stocks, crypto, forex, etc.) with personalized visual charts and signals. It supports both trend tracking and multi-timeframe analysis. Key Features and Functions Multi EMA/SMA Analysis Displays Exponential Moving Averages (EMA) and Simple Moving Averages (SMA) on monthly, weekly, and daily bases.
Indicates whether the price is above or below these averages with / symbols.
Generates signals from crossovers, such as EMA50/200, EMA5/13, and EMA5/21.
Crossover Signals EMA crossovers (e.g., 50 and 200) are labeled as "BUY" or "SELL" signals.
Shows how long ago the crossover occurred (e.g., "5 days ago").
These signals can be displayed as labels on the chart (optional).
T3 Indicator and T3 Fibo The T3 indicator, an advanced smoothing tool for trend tracking, generates BUY/SELL signals based on direction (up/down).
T3 Fibo is an alternative T3 version calculated with different weights (e.g., 0.618 golden ratio).
Both are drawn with colors (green = bullish, red = bearish).
Multi-Timeframe Analysis Displays trend status based on the 144 EMA across different timeframes (1D, 15m, 1H, 4H, daily, etc.).
Provides users with "Long" (buy) or "Short" (sell) signals for short- and long-term trend perspectives.
Technical Indicator Signal Unit (Signal Table)
Combines the status of the following in a table: Trend: 55 EMA and 200 EMA
MACD: Positive or negative?
Ichimoku: Is the price above or below the cloud?
OBV (On-Balance Volume): Is the volume trend upward?
RSI: Overbought/oversold levels
Stoch RSI: Short-term momentum
Bollinger Bands % (BB%): Price position relative to the bands
CCI: Overbought/oversold and momentum
RS Rating: Relative strength compared to a selected index (e.g., BIST:XU100)
ATR(STOP!): Volatility-based support/resistance levels
Visual Presentation
Three customizable tables provide: EMA/SMA Status and Crossovers
Summary Table of All Signals
Multi-Timeframe Trend (EzAlgo)
Users can adjust the content, colors, transparency, and visibility of the tables.
User Customization Options Enable/disable lines, labels, and tables.
Customize visual settings such as color, position, and size.
Select a custom benchmark for RS Rating (e.g., SP500, BIST100).
Adjust T3 parameters (length, volume factor).
Who Is This Indicator For? Ideal for those who rely on technical analysis and trend tracking.
Suitable for day traders and medium- to long-term investors monitoring multiple timeframes.
Acts as a decision-support system for those who want to view signals from multiple indicators in one place.
In Summary:
The "Cilbaga Indicator Tables" is a user-friendly decision-support indicator with multi-timeframe and multi-indicator analysis, supported by visual charts. It combines trend, momentum, and relative strength analyses in one place to inform buy/sell decisions.
Skrypt chroniony
Ten skrypt został opublikowany jako zamknięty kod źródłowy. Możesz jednak używać go swobodnie i bez żadnych ograniczeń – więcej informacji tutaj.
Wyłączenie odpowiedzialności
Informacje i publikacje przygotowane przez TradingView lub jego użytkowników, prezentowane na tej stronie, nie stanowią rekomendacji ani porad handlowych, inwestycyjnych i finansowych i nie powinny być w ten sposób traktowane ani wykorzystywane. Więcej informacji na ten temat znajdziesz w naszym Regulaminie.