OPEN-SOURCE SCRIPT
Zaktualizowano Futures Correlation Visualizer

OVERVIEW
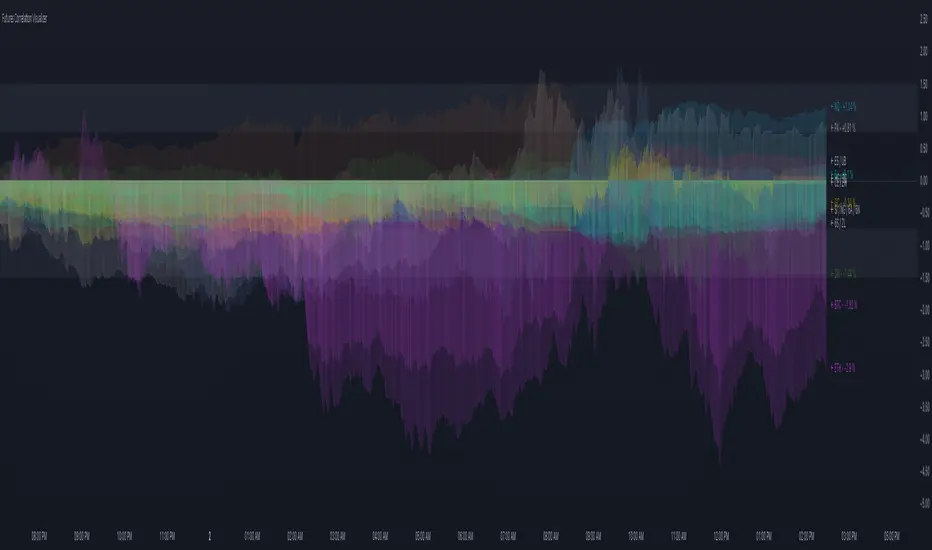
This indicator plots the normalized price changes of commonly traded futures. Visualizing data in this way makes studying and understanding market participation and sentiment easier.
Note:
Only 20 symbols can be plotted. The "request" functions are limited to 40 calls, 1 timeframe counts as a call, and 2 timeframes are used per symbol. Normalized values are derived by dividing the charts timeframe by 1D data. A runtime error will occur when more than 20 symbols are enabled. This limitation is unavoidable.
INPUTS
You can configure:
- Colors and color scheme
- Symbols to plot (most common futures)
- Norm. source (todays open / yesterdays close)
- Measurement type (%, ‱, Δ)
- Label, zone, and zero options
Informacje o Wersji
- Added link to indicator page the top of the code.
- Updated chart
Informacje o Wersji
- Minor code changes.
- Added "Smooth" option for color transitions.
- Converted to Pine Script v6
Informacje o Wersji
- Updated script to align with Pine Script changes: Pine Script recently updated when loop boundaries were checked. Previously, the boundary was established before iterating. Now, the boundary is evaluated on each iteration.
Informacje o Wersji
- Improved logic to be more reliable after partial trading days.
Skrypt open-source
W zgodzie z duchem TradingView twórca tego skryptu udostępnił go jako open-source, aby użytkownicy mogli przejrzeć i zweryfikować jego działanie. Ukłony dla autora. Korzystanie jest bezpłatne, jednak ponowna publikacja kodu podlega naszym Zasadom serwisu.
Discord: discord.gg/bPAPhwUeud
Website: liquid-trader.com
Website: liquid-trader.com
Wyłączenie odpowiedzialności
Informacje i publikacje nie stanowią i nie powinny być traktowane jako porady finansowe, inwestycyjne, tradingowe ani jakiekolwiek inne rekomendacje dostarczane lub zatwierdzone przez TradingView. Więcej informacji znajduje się w Warunkach użytkowania.