OPEN-SOURCE SCRIPT
Zaktualizowano Crypto/Stable Mcap Ratio Normalized
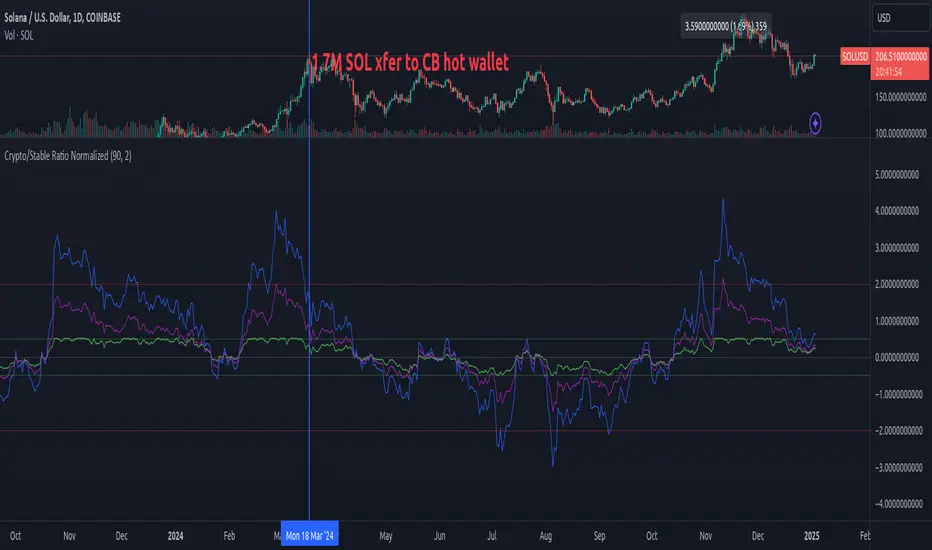
Create a normalized ratio of total crypto market cap to stablecoin supply (USDT + USDC + DAI). Idea is to create a reference point for the total market cap's position, relative to total "dollars" in the crypto ecosystem. It's an imperfect metric, but potentially helpful. V0.1.
This script provides four different normalization methods:
Z-Score Normalization:
Min-Max Normalization:
Percent of All-Time Range:
Bollinger Band Position:
Features:
This script provides four different normalization methods:
Z-Score Normalization:
- Shows how many standard deviations the ratio is from its mean
- Good for identifying extreme values
- Mean-reverting properties
Min-Max Normalization:
- Scales values between 0 and 1
- Good for relative position within recent range
- More sensitive to recent changes
Percent of All-Time Range:
- Shows where current ratio is relative to all-time highs/lows
- Good for historical context
- Less sensitive to recent changes
Bollinger Band Position:
- Similar to z-score but with adjustable sensitivity
- Good for trading signals
- Can be tuned via standard deviation multiplier
Features:
- Adjustable lookback period
- Reference bands for overbought/oversold levels
- Built-in alerts for extreme values
- Color-coded plots for easy visualization
Informacje o Wersji
Create a normalized ratio of total crypto market cap to stablecoin supply (USDT + USDC + DAI). Idea is to create a reference point for the total market cap's position, relative to total "dollars" in the crypto ecosystem. It's an imperfect metric, but potentially helpful. V0.1.This script provides four different normalization methods:
Z-Score Normalization:
- Shows how many standard deviations the ratio is from its mean
- Good for identifying extreme values
- Mean-reverting properties
Min-Max Normalization:
- Scales values between 0 and 1
- Good for relative position within recent range
- More sensitive to recent changes
Percent of All-Time Range:
- Shows where current ratio is relative to all-time highs/lows
- Good for historical context
- Less sensitive to recent changes
Bollinger Band Position:
- Similar to z-score but with adjustable sensitivity
- Good for trading signals
- Can be tuned via standard deviation multiplier
Features:
- Adjustable lookback period
- Reference bands for overbought/oversold levels
- Built-in alerts for extreme values
- Color-coded plots for easy visualization
Skrypt open-source
W zgodzie z duchem TradingView twórca tego skryptu udostępnił go jako open-source, aby użytkownicy mogli przejrzeć i zweryfikować jego działanie. Ukłony dla autora. Korzystanie jest bezpłatne, jednak ponowna publikacja kodu podlega naszym Zasadom serwisu.
Wyłączenie odpowiedzialności
Informacje i publikacje nie stanowią i nie powinny być traktowane jako porady finansowe, inwestycyjne, tradingowe ani jakiekolwiek inne rekomendacje dostarczane lub zatwierdzone przez TradingView. Więcej informacji znajduje się w Warunkach użytkowania.