OPEN-SOURCE SCRIPT
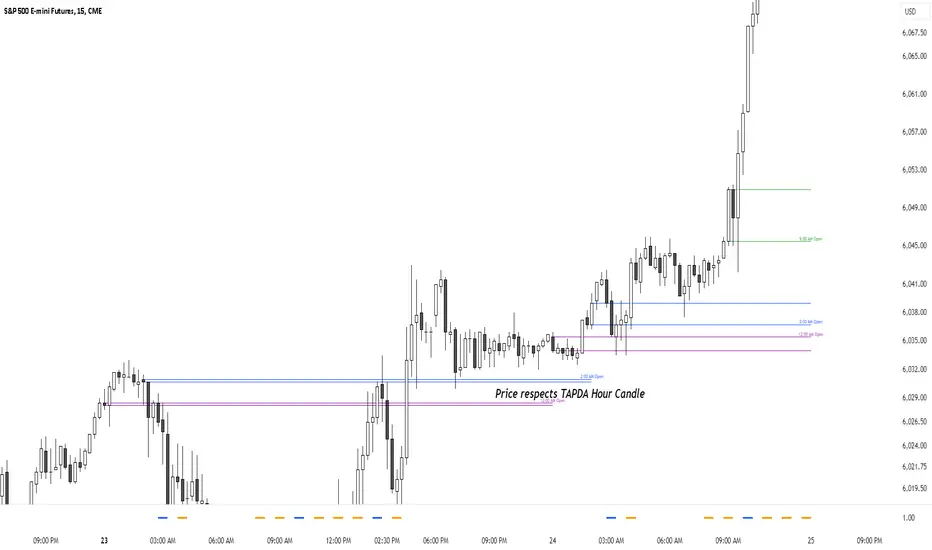
TAPDA Hourly Open Lines (Candle Body Box)

-What is TAPDA?
TAPDA (Time and Price Displacement Analysis) is based on the belief that markets are driven by algorithms that respond to key time-based price levels, such as session opens. Traders who follow TAPDA track these levels to anticipate price movements, reversals, and breakouts, aligning their strategies with the patterns left by these underlying algorithms. By plotting lines at specific hourly opens, the indicator allows traders to visualize where the market may react, providing a structured way to trade alongside the algorithmic flow.
***************
**Sauce Alert** "TAPDA levels essentially act like algorithmic support and resistance" By plotting these hourly opens, the TAPDA Hourly Open Lines indicator helps traders track where algorithms might engage with the market.
***************
-How It Works:
The indicator draws a "candle body box" at selected hours, marking the open and close prices to highlight price ranges at significant times. This creates dynamic zones that reflect market sentiment and structure throughout the day. TAPDA levels are commonly respected by price, making them useful for identifying potential entry points, stop placements, and trend reversals.
-Key Features:
Customizable Hour Levels – Enable or disable specific times to fit your trading approach.
Color & Label Control – Assign unique colors and labels to each hour for better visualization.
Line Extension – Project lines for up to 24 hours into the future to track key levels.
Dynamic Cleanup – Old lines automatically delete to maintain chart clarity.
Manual Time Offset – Adjust for broker or server time zone differences.
-Current Development:
This indicator is still in development, with further updates planned to enhance functionality and customization. If you find this script helpful, feel free to copy the code and stay tuned for new features and improvements!
Skrypt open-source
W zgodzie z duchem TradingView twórca tego skryptu udostępnił go jako open-source, aby użytkownicy mogli przejrzeć i zweryfikować jego działanie. Ukłony dla autora. Korzystanie jest bezpłatne, jednak ponowna publikacja kodu podlega naszym Zasadom serwisu.
Wyłączenie odpowiedzialności
Informacje i publikacje nie stanowią i nie powinny być traktowane jako porady finansowe, inwestycyjne, tradingowe ani jakiekolwiek inne rekomendacje dostarczane lub zatwierdzone przez TradingView. Więcej informacji znajduje się w Warunkach użytkowania.