OPEN-SOURCE SCRIPT
Zaktualizowano EMA Multi Cross
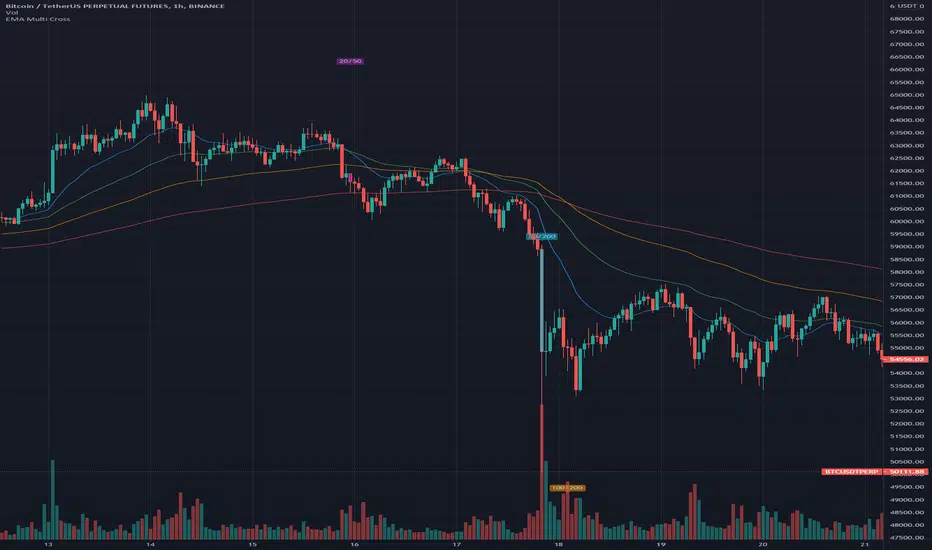
This is just a very simple EMA indicator that shows the 20, 50, 100, and 200 Exponential Moving Averages and plots some shapes when the lines cross from the 20 & 50, the 50 & 200, and the 100 & 200.
I know there are many EMA indicators out there, but I couldn't find one that let me edit the colors, values, and toggle the crossings. Maybe some of you will find usefulness in having some of these extra options too.
I use this occasionally on the Bitcoin 1 hour charts to see how the long-term trend is going.
Here are some ways to read EMA lines:
Slope: A rising moving average generally reflects a rising trend, while a falling moving average points to a falling trend.
Crosses: Seeing when a slower moving average crosses over/under a faster moving average can be an indication of a trend. If a shorter moving average remains above the longer moving average after they cross, the uptrend is considered intact. The trend is seen as down when the shorter moving average is below the longer moving average.
I prefer the slope of the two since crosses can cause some false positives if you are relying on it for trades.
Informacje o Wersji
Added bar coloring as requested.20 crossing with 50 shows a purple candle.
50 crossing with 200 shows an aqua candle.
100 crossing with 200 shows an orange candle.
Skrypt open-source
W zgodzie z duchem TradingView twórca tego skryptu udostępnił go jako open-source, aby użytkownicy mogli przejrzeć i zweryfikować jego działanie. Ukłony dla autora. Korzystanie jest bezpłatne, jednak ponowna publikacja kodu podlega naszym Zasadom serwisu.
Wyłączenie odpowiedzialności
Informacje i publikacje nie stanowią i nie powinny być traktowane jako porady finansowe, inwestycyjne, tradingowe ani jakiekolwiek inne rekomendacje dostarczane lub zatwierdzone przez TradingView. Więcej informacji znajduje się w Warunkach użytkowania.