OPEN-SOURCE SCRIPT
Moving Average Convergence Divergence and Momentum
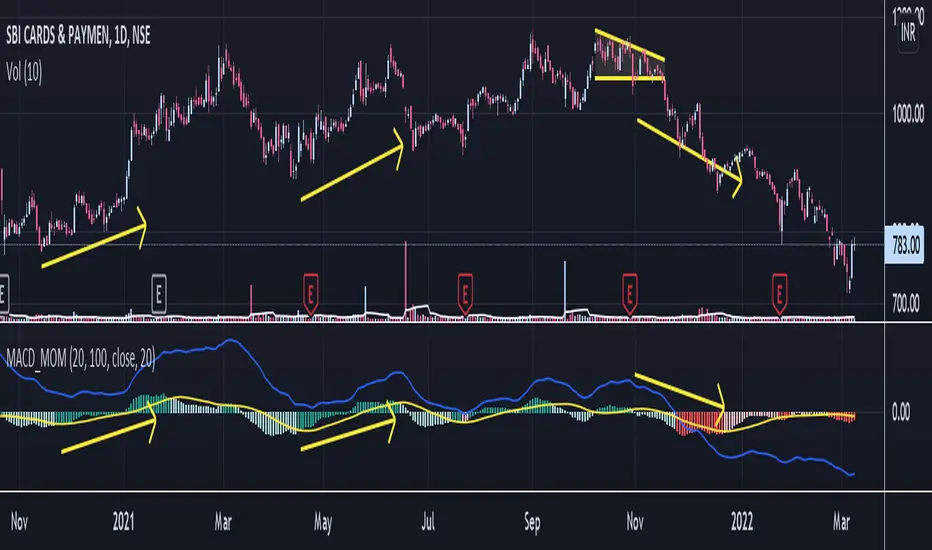
MACD line is difference between 20 EMA and 100 EMA which measures the Longterm trend. If MACD line is above Zero trend is positive. If MACD line is below zero trend is negative. Strategy is classic Buy in uptrend Sell in Downtrend.
To Improve the entry timing MACD histogram is used as Momentum. Histogram is the difference between MACD line and 20 EMA of MACD line. And Hist Momentum is the 20 SMA of histogram.
Advantage of histogram is Smoothness and better reliability than other momentum indicators like RSI which is volatile.
If MACD line is above zero = Trend is positive
and Histogram is above its SMA = Momentum is also positive.
Buy Signal.
If MACD line is above zero = Trend is positive
and Histogram is below its SMA = Trend is positive but Momentum is losing.
Look for Support levels or Break out of support level.
If MACD line is below zero = Trend is Negative
and Histogram is Below its SMA = Momentum is also Negative.
Sell Signal.
If MACD line is Below zero = Trend is Negative
and Histogram is above its SMA = Trend is negative but momentum is improving
Look for Resistance levels or Break out of resistance level.
Skrypt open-source
W zgodzie z duchem TradingView twórca tego skryptu udostępnił go jako open-source, aby użytkownicy mogli przejrzeć i zweryfikować jego działanie. Ukłony dla autora. Korzystanie jest bezpłatne, jednak ponowna publikacja kodu podlega naszym Zasadom serwisu.
Wyłączenie odpowiedzialności
Informacje i publikacje nie stanowią i nie powinny być traktowane jako porady finansowe, inwestycyjne, tradingowe ani jakiekolwiek inne rekomendacje dostarczane lub zatwierdzone przez TradingView. Więcej informacji znajduje się w Warunkach użytkowania.