OPEN-SOURCE SCRIPT
Zaktualizowano Horizontal Lines from Current Price
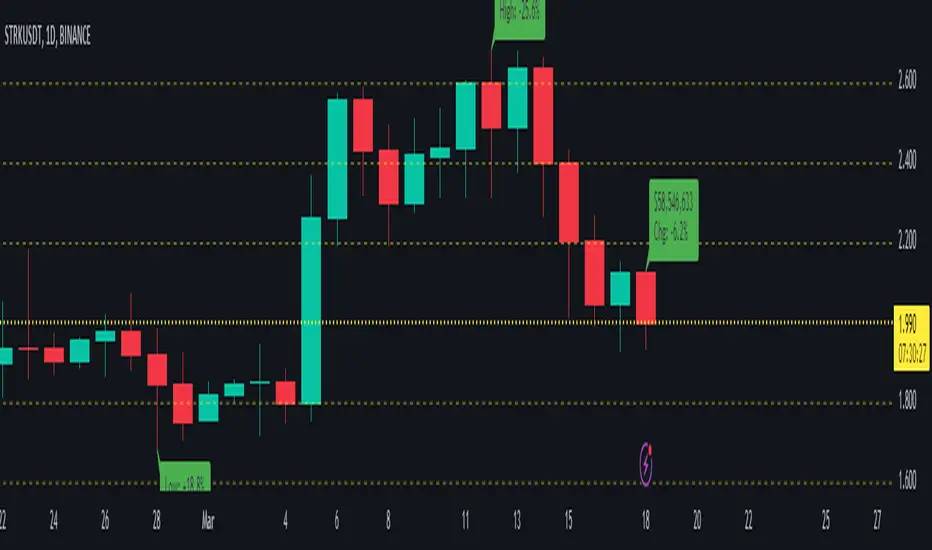
This indicator will help traders track price fluctuations in smaller time frames more conveniently than ever before.
Here's how it works:
Additionally, we also provide volume display (measured in USD) at the current candle position to assist traders in keeping track of market momentum more closely.
Installation guide for indicators:
Here's how it works:
Starting from the current price, the indicator will draw horizontal lines spaced 10% apart.
Now, whenever zooming in or out of the chart, traders can visually determine the level of price volatility more easily.
Additionally, we also provide volume display (measured in USD) at the current candle position to assist traders in keeping track of market momentum more closely.
Installation guide for indicators:
After installing the indicator, make sure that the indicator is merged with the price chart.
Secondly, ensure that the scale bar of the indicator merges with the scale bar of the price chart.
Informacje o Wersji
Update default inputsInformacje o Wersji
Clean source code & InputsInformacje o Wersji
➕ Added the feature to view the highest and lowest price changes of the current bar compared to the previous bars.⚡⚡⚡Informacje o Wersji
Clean source code 🚧🚧🚧Informacje o Wersji
➕ Added the feature to view the changes in the current price bar.⚡⚡⚡Informacje o Wersji
Clean source code 🚧🚧🚧Informacje o Wersji
Update display current price 🚧🚧🚧Informacje o Wersji
Fix bug 🚧🚧🚧Informacje o Wersji
Fix bug 🚧🚧🚧Informacje o Wersji
Fix bug 🚧🚧🚧Informacje o Wersji
Fix bug 🚧🚧🚧Informacje o Wersji
Fix bug 🚧🚧🚧Informacje o Wersji
Fix bug 🚧🚧🚧Informacje o Wersji
Fix bug 🚧🚧🚧Skrypt open-source
W zgodzie z duchem TradingView twórca tego skryptu udostępnił go jako open-source, aby użytkownicy mogli przejrzeć i zweryfikować jego działanie. Ukłony dla autora. Korzystanie jest bezpłatne, jednak ponowna publikacja kodu podlega naszym Zasadom serwisu.
Wyłączenie odpowiedzialności
Informacje i publikacje nie stanowią i nie powinny być traktowane jako porady finansowe, inwestycyjne, tradingowe ani jakiekolwiek inne rekomendacje dostarczane lub zatwierdzone przez TradingView. Więcej informacji znajduje się w Warunkach użytkowania.
Skrypt open-source
W zgodzie z duchem TradingView twórca tego skryptu udostępnił go jako open-source, aby użytkownicy mogli przejrzeć i zweryfikować jego działanie. Ukłony dla autora. Korzystanie jest bezpłatne, jednak ponowna publikacja kodu podlega naszym Zasadom serwisu.
Wyłączenie odpowiedzialności
Informacje i publikacje nie stanowią i nie powinny być traktowane jako porady finansowe, inwestycyjne, tradingowe ani jakiekolwiek inne rekomendacje dostarczane lub zatwierdzone przez TradingView. Więcej informacji znajduje się w Warunkach użytkowania.