OPEN-SOURCE SCRIPT
Yearly VWAP with Z-Score V2
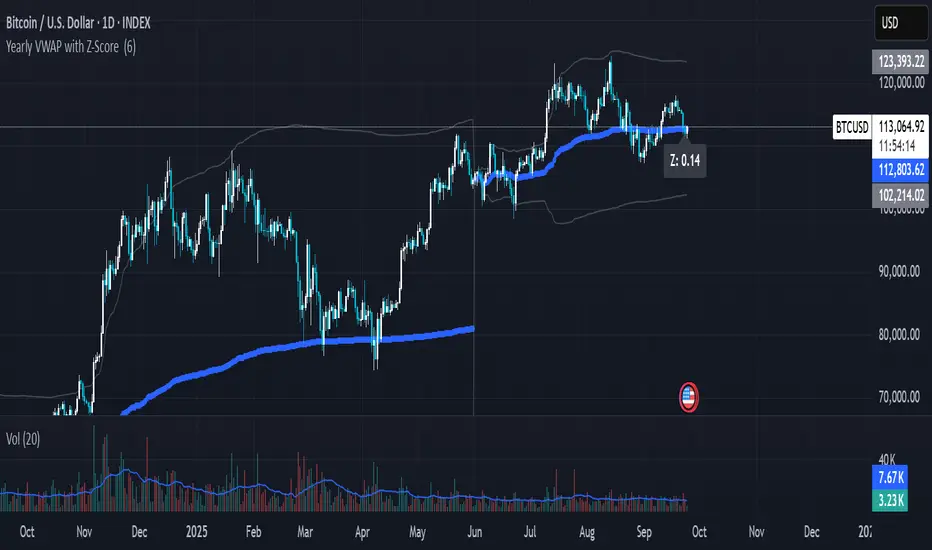
This script extends the traditional Volume Weighted Average Price (VWAP) by applying it to yearly sessions (with a customizable start month) and combining it with a Z-Score framework to standardize price deviations from VWAP.
Features
Yearly VWAP: Automatically resets at the selected month, making it possible to align VWAP with fiscal or seasonal cycles (e.g., June–May).
Volatility-Weighted Bands: Standard deviation is calculated using volume-weighted price variance, creating adaptive upper and lower bands around VWAP.
Z-Score Calculation: Converts price distance from VWAP into standardized scores, ranging from +2.5 to –2.5. This enables statistical interpretation of whether price is trading at fair value, extended, or oversold relative to VWAP.
Custom Session Control: Input allows users to change the yearly anchor month.
On-Chart Display: VWAP and bands are plotted, with a live Z-Score label shown on the latest bar.
How to Use
Fair Value Reference: VWAP reflects the average price weighted by volume over the yearly session — a natural equilibrium point.
Overbought / Oversold Detection: Extreme Z-Score readings (±2 or beyond) highlight when price is stretched relative to VWAP.
Cycle Analysis: Resetting VWAP by custom months allows studying market behavior over fiscal years, seasons, or custom trading cycles.
Part of a Broader Toolkit: This script is not a standalone trading system. It works best when aggregated with other indicators, confluence factors, or a structured strategy.
Originality
Unlike a standard VWAP, this version:
Uses yearly anchoring with custom start month instead of session/day anchoring.
Adds volume-weighted standard deviation bands for statistical context.
Translates distance into a Z-Score scale for objective overbought/oversold assessment.
Positive Z-Score values indicate zones where price is positioned favorably for accumulation or potential buys, while negative values highlight areas more suitable for distribution or profit-taking — always best used in confluence with other tools rather than as a standalone signal
Skrypt open-source
W zgodzie z duchem TradingView twórca tego skryptu udostępnił go jako open-source, aby użytkownicy mogli przejrzeć i zweryfikować jego działanie. Ukłony dla autora. Korzystanie jest bezpłatne, jednak ponowna publikacja kodu podlega naszym Zasadom serwisu.
Wyłączenie odpowiedzialności
Informacje i publikacje nie stanowią i nie powinny być traktowane jako porady finansowe, inwestycyjne, tradingowe ani jakiekolwiek inne rekomendacje dostarczane lub zatwierdzone przez TradingView. Więcej informacji znajduje się w Warunkach użytkowania.