[Beta] Volume Delta in Candle v.1.0
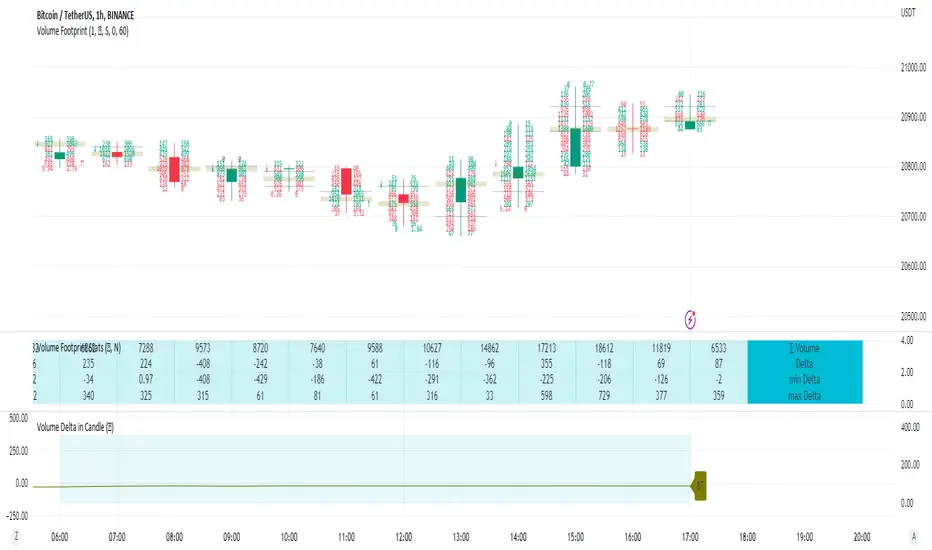
Chart is restarted with start of each new candle.
Script is collecting volume footprint with the precision picked by user. We recomend to use highest possible precision.
Unfortunatelly Trading View has many limitations.
If after adding script nothing is visible with error: "'The study references too many candles in history'" you need to use lower precision - It can be changed in script settings.
This script is a part of a toolkit called "Volume Footprint", containing few more tools:
Volume Footprint - Volume Footprint chart.
Volume Footprint Statistics - Script showing table with basic statistics about Up and Down Volume inside the candle.
Volume Delta - Showing candles of imbalance between Up and Down Volume changes inside candles.
Volume Delta In Candle- Chart showing history of imbalance between Up and Down Volume changes inside current candle.
Volume Cumulative Delta - Showing candles of imbalance changes between UP and Down Volume cumulated in trading time equal to interval.
Volume Cumulative Delta in Interval- Chart showing history of imbalance changes between UP and Down Volume cumulated in trading time equal to interval.
This script can be used by any user. You do not need to have PRO or PREMIUM account to use it.
Script with limited access, contact author to get authorization
User Interface:
Script is drawing a line of values demonstrating how Delta was changing inside current candle.
Current value of Delta is shown in the label on the right side of the chart.
Chart is drawing dynamically and can easiely hit TradingView limitations. If your chart is shorter and ends before vertical line, you can simplify it by turning "Simplify" checkbox in Settings.
Chart also cannot be longer than the source one.
Script settings:
Data precision - One of 6 levels of data precision: ▉▇▆▅▃▁, where ▉ means the highest precision and ▁ the lowest available precision. On 15 minute chart highest precision should be available, but on 1D it will probably hit TradingView limitations and script will not be even launched by the platform with error: "'The study references too many candles in history'". The general recommendation is to use the highest available precision for a given instrument and interval.
Background - Drawing background under chart area.
Line color - Color of data line over the chart.
Simplify drawing - Visualization option that skips some shape detail in exchange for a longer history of value.
Troubleshooting:
In case of any problems, send error details to the author of the script.
Known issues:
"The study references too many candles in history" - Change "Data precision" settings to some lower value.
- Addition precision levels dedicated to 1W and 1M charts.
- Verification with main script feature
- Improved error reporting
Skrypt tylko na zaproszenie
Dostęp do tego skryptu mają wyłącznie użytkownicy zatwierdzeni przez autora. Aby z niego korzystać, należy poprosić o zgodę i ją uzyskać. Zgoda jest zazwyczaj udzielana po dokonaniu płatności. Więcej informacji można znaleźć w instrukcjach autora poniżej lub kontaktując się bezpośrednio z Investor_R.
Należy pamiętać, że ten prywatny skrypt dostępny wyłącznie na zaproszenie nie został sprawdzony przez moderatorów skryptów, a jego zgodność z Zasadami publikacji nie została określona. TradingView NIE zaleca płacenia za skrypt ani korzystania z niego, jeśli nie ma pełnego zaufania do jego autora i nie rozumie się zasad jego działania. Można również znaleźć darmowe, otwartoźródłowe alternatywy w skryptach społeczności.
Instrukcje autora
More details on Website and Youtube.
Wyłączenie odpowiedzialności
Skrypt tylko na zaproszenie
Dostęp do tego skryptu mają wyłącznie użytkownicy zatwierdzeni przez autora. Aby z niego korzystać, należy poprosić o zgodę i ją uzyskać. Zgoda jest zazwyczaj udzielana po dokonaniu płatności. Więcej informacji można znaleźć w instrukcjach autora poniżej lub kontaktując się bezpośrednio z Investor_R.
Należy pamiętać, że ten prywatny skrypt dostępny wyłącznie na zaproszenie nie został sprawdzony przez moderatorów skryptów, a jego zgodność z Zasadami publikacji nie została określona. TradingView NIE zaleca płacenia za skrypt ani korzystania z niego, jeśli nie ma pełnego zaufania do jego autora i nie rozumie się zasad jego działania. Można również znaleźć darmowe, otwartoźródłowe alternatywy w skryptach społeczności.
Instrukcje autora
More details on Website and Youtube.