PROTECTED SOURCE SCRIPT
Key Levels
Key Levels Indicator
Description
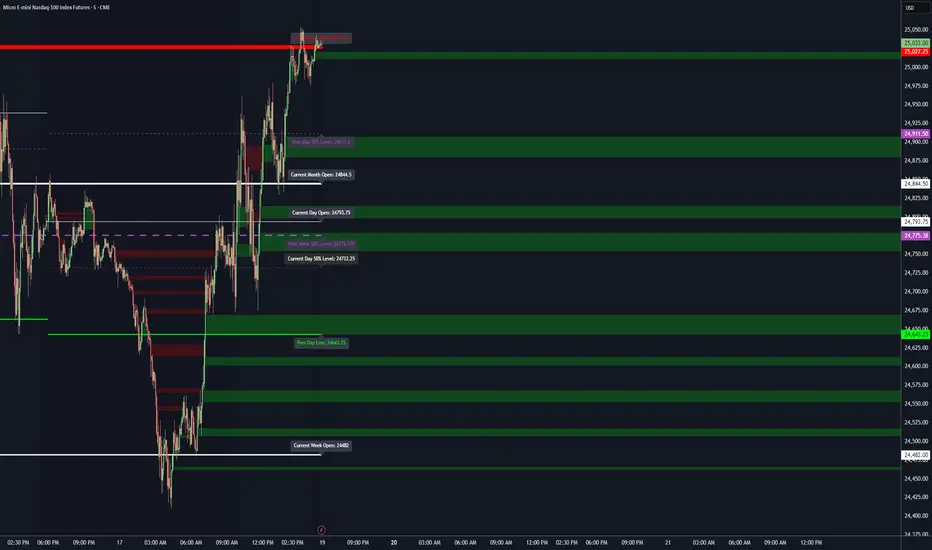
The Key Levels indicator is a powerful tool for traders, displaying major institutional price levels from daily, weekly, and monthly timeframes on your chart. It plots horizontal lines for previous period highs, lows, and midpoints (50% levels), as well as current period opens, helping you identify critical support and resistance zones used by institutional traders. Labels are provided for the most recent levels, positioned at the rightmost bar for easy reference.
Features
Daily Levels: Plots Previous Day High, Previous Day Low, Day Open, and Previous Day 50% Level.
Weekly Levels: Plots Previous Week High, Previous Week Low, Week Open, and Previous Week 50% Level.
Monthly Levels: Plots Previous Month High, Previous Month Low, Month Open, and Previous Month 50% Level.
Customizable Colors: Adjust the color of each line via the settings panel to suit your chart preferences.
Customizable Labels: Enable/disable labels, adjust label size, and change the label background color for optimal visibility.
Clean Visualization: Lines are plotted with breaks at the start of each period, ensuring a clear and uncluttered display.
Settings
Show Labels: Toggle to show or hide all labels (default: enabled).
Label Size: Choose from "tiny," "small," "normal," "large," or "huge" to adjust label text size (default: normal).
Label Background Color: Customize the background color of labels to ensure text visibility (default: black).
Line Colors: Individual color pickers for each level (e.g., Previous Day High, Day Open), allowing full customization of line colors.
Usage
The Key Levels indicator is designed for futures markets, such as S&P 500 futures (ES), Nasdaq futures (NQ), or crude oil futures (CL), where institutional price levels like daily, weekly, and monthly highs, lows, and opens are critical for identifying key support and resistance zones. Apply the indicator to a 1-hour or 15-minute timeframe to capture precise market structure for day trading or swing trading strategies in futures. While optimized for futures, the indicator can be applied to any chart for versatile trading applications. Customize line colors and label settings in the panel to match your chart preferences.
Notes
Labels are shown only for the current day, week, and month to focus on recent price action.
For best visibility, adjust the label background color if text blends into your chart background.
Ideal for traders analyzing major institutional levels for market structure and trading decisions.
Protected script
This script is published as closed-source. However, you can use it freely and without any limitations – learn more here.
njammu123
Disclaimer
The information and publications are not meant to be, and do not constitute, financial, investment, trading, or other types of advice or recommendations supplied or endorsed by T
Description
The Key Levels indicator is a powerful tool for traders, displaying major institutional price levels from daily, weekly, and monthly timeframes on your chart. It plots horizontal lines for previous period highs, lows, and midpoints (50% levels), as well as current period opens, helping you identify critical support and resistance zones used by institutional traders. Labels are provided for the most recent levels, positioned at the rightmost bar for easy reference.
Features
Daily Levels: Plots Previous Day High, Previous Day Low, Day Open, and Previous Day 50% Level.
Weekly Levels: Plots Previous Week High, Previous Week Low, Week Open, and Previous Week 50% Level.
Monthly Levels: Plots Previous Month High, Previous Month Low, Month Open, and Previous Month 50% Level.
Customizable Colors: Adjust the color of each line via the settings panel to suit your chart preferences.
Customizable Labels: Enable/disable labels, adjust label size, and change the label background color for optimal visibility.
Clean Visualization: Lines are plotted with breaks at the start of each period, ensuring a clear and uncluttered display.
Settings
Show Labels: Toggle to show or hide all labels (default: enabled).
Label Size: Choose from "tiny," "small," "normal," "large," or "huge" to adjust label text size (default: normal).
Label Background Color: Customize the background color of labels to ensure text visibility (default: black).
Line Colors: Individual color pickers for each level (e.g., Previous Day High, Day Open), allowing full customization of line colors.
Usage
The Key Levels indicator is designed for futures markets, such as S&P 500 futures (ES), Nasdaq futures (NQ), or crude oil futures (CL), where institutional price levels like daily, weekly, and monthly highs, lows, and opens are critical for identifying key support and resistance zones. Apply the indicator to a 1-hour or 15-minute timeframe to capture precise market structure for day trading or swing trading strategies in futures. While optimized for futures, the indicator can be applied to any chart for versatile trading applications. Customize line colors and label settings in the panel to match your chart preferences.
Notes
Labels are shown only for the current day, week, and month to focus on recent price action.
For best visibility, adjust the label background color if text blends into your chart background.
Ideal for traders analyzing major institutional levels for market structure and trading decisions.
Protected script
This script is published as closed-source. However, you can use it freely and without any limitations – learn more here.
njammu123
Disclaimer
The information and publications are not meant to be, and do not constitute, financial, investment, trading, or other types of advice or recommendations supplied or endorsed by T
Skrypt chroniony
Ten skrypt został opublikowany jako zamknięty kod źródłowy. Można z tego korzystać swobodnie i bez żadnych ograniczeń — więcej informacji znajduje się tutaj.
Wyłączenie odpowiedzialności
Informacje i publikacje nie stanowią i nie powinny być traktowane jako porady finansowe, inwestycyjne, tradingowe ani jakiekolwiek inne rekomendacje dostarczane lub zatwierdzone przez TradingView. Więcej informacji znajduje się w Warunkach użytkowania.