OPEN-SOURCE SCRIPT
BW MFI fixed v6
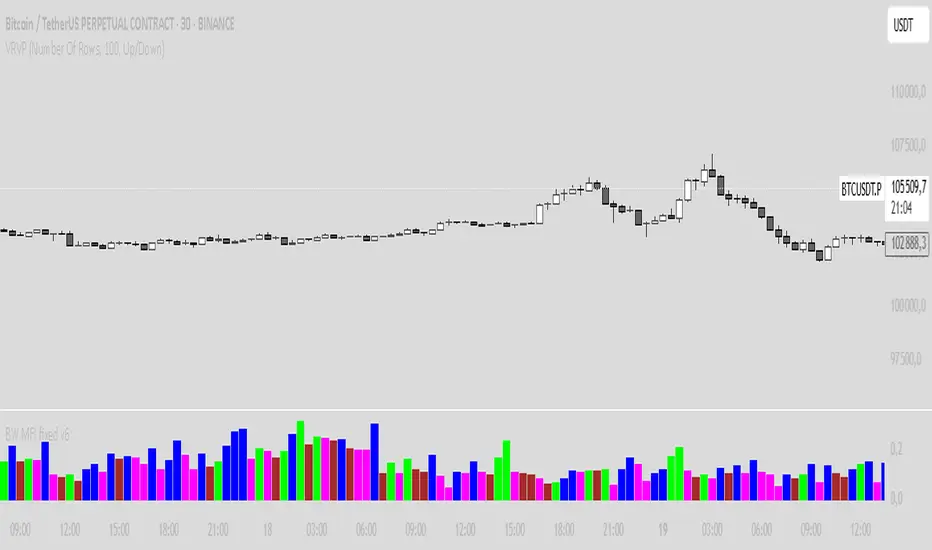
Bill Williams MFI
Sure! Here’s an English description of the indicator you have:
---
### Bill Williams Market Facilitation Index (MFI) — Indicator Description
This indicator implements the **Market Facilitation Index (MFI)** as introduced by Bill Williams. The MFI measures the market's willingness to move the price by comparing the price range to the volume.
---
### How it works:
* **MFI Calculation:**
The MFI is calculated as the difference between the current bar’s high and low prices divided by the volume of that bar:
$$
\text{MFI} = \frac{\text{High} - \text{Low}}{\text{Volume}}
$$
* **Color Coding Logic:**
The indicator compares the current MFI and volume values to their previous values and assigns colors to visualize market conditions according to Bill Williams’ methodology:
| Color | Condition | Market Interpretation |
| ----------- | ------------------ | --------------------------------------------------------------------------------------------- |
| **Green** | MFI ↑ and Volume ↑ | Strong trend continuation or acceleration (increased price movement supported by volume) |
| **Brown** | MFI ↓ and Volume ↓ | Trend weakening or possible pause (both price movement and volume are decreasing) |
| **Blue** | MFI ↑ and Volume ↓ | Possible false breakout or lack of conviction (price moves but volume decreases) |
| **Fuchsia** | MFI ↓ and Volume ↑ | Market indecision or battle between bulls and bears (volume rises but price movement shrinks) |
| **Gray** | None of the above | Neutral or unchanged market condition |
* **Display:**
The indicator plots the MFI values as colored columns on a separate pane below the price chart, providing a visual cue of the market’s behavior.
---
### Purpose:
This tool helps traders identify changes in market momentum and the strength behind price moves, providing insight into when trends might accelerate, weaken, or potentially reverse.
---
If you want, I can help you write a more detailed user guide or trading strategy based on this indicator!
Skrypt open-source
W zgodzie z duchem TradingView twórca tego skryptu udostępnił go jako open-source, aby użytkownicy mogli przejrzeć i zweryfikować jego działanie. Ukłony dla autora. Korzystanie jest bezpłatne, jednak ponowna publikacja kodu podlega naszym Zasadom serwisu.
Wyłączenie odpowiedzialności
Informacje i publikacje nie stanowią i nie powinny być traktowane jako porady finansowe, inwestycyjne, tradingowe ani jakiekolwiek inne rekomendacje dostarczane lub zatwierdzone przez TradingView. Więcej informacji znajduje się w Warunkach użytkowania.