PROTECTED SOURCE SCRIPT
Zaktualizowano Pro Volume Lite
📘 Pro Volume Lite
What it is:
Pro Volume Lite is a tool that helps you quickly figure out:
How much quantity to buy or sell,
Where your risk stands,
How volume and trend strength are behaving,
Plus some quick company fundamentals.
🔹 1. Position Size & Risk Management
✅ Settings
Trade Direction:
Long → Bullish trades only.
Short → Bearish trades only.
Both → Auto-switch depending on whether today’s price change is up or down.
Capital (CP):
Enter your account size (example: 10,00,000).
This is the base for position size calculations.
Risk Mode (R):
Currency → Risk a fixed amount per trade (e.g., $5000).
Percentage → Risk a fixed % of your capital (e.g., 0.5%).
⚡ The script automatically calculates how much money you’re risking per trade based on your choice.
✅ Stop & Quantity Calculations
D (Stop Low %) → How far today’s close is from the day’s low.
DH (Stop High %) → How far close is from the mid-body of today’s candle.
Q (Quantity) → How many shares you can buy/sell if stop = day’s low.
QH (Quantity High) → Quantity if stop = mid-body.
SSL #1, #2, #3 → Standard stop-loss setups (e.g., 0.75%, 1%, 1.25%).
💡 If you enable Lot Size, all quantities are converted into nearest lot multiples (good for futures).
🔹 2. Volume Bar Coloring
Green = Price closed higher than it opened.
Red = Price closed lower than it opened.
Plots on the volume chart so you can see bullish/bearish volume.
🔹 3. Trend Intensity (TI)
Uses two moving averages (fast & slow).
Green dot on top → Trend strongly bullish.
Red dot on top → Trend strongly bearish.
Helps you spot momentum shifts.
🔹 4. Episodic Pivot (EP)
Marks big volume spikes with orange triangles under candles.
Default threshold = 9 million volume.
Shows when institutions may be entering/exiting.
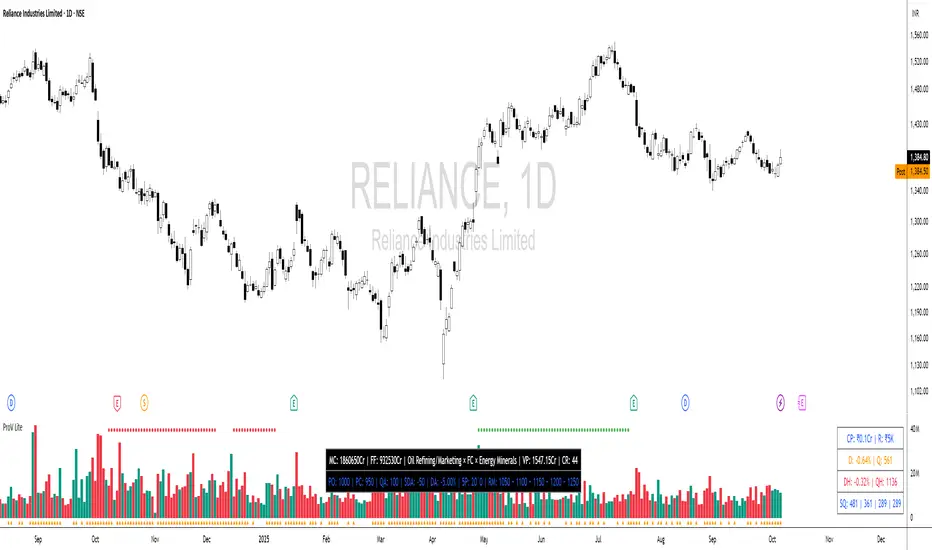
🔹 5. Data Metrics Table
Quick fundamentals shown in a table:
MC (Market Cap): Company’s total market value.
Industry × Sector: Classification for the stock.
FF (Free Float): Value of shares available for public trading.
💡 In INR stocks → values are shown in Crores.
💡 In USD stocks → values shown in raw currency format.
⚡ Bottom Line
Pro Volume Lite helps you:
Size your trades correctly,
Control your risk,
Spot strong volume moves,
Check quick fundamentals,
All inside your TradingView chart.
What it is:
Pro Volume Lite is a tool that helps you quickly figure out:
How much quantity to buy or sell,
Where your risk stands,
How volume and trend strength are behaving,
Plus some quick company fundamentals.
🔹 1. Position Size & Risk Management
✅ Settings
Trade Direction:
Long → Bullish trades only.
Short → Bearish trades only.
Both → Auto-switch depending on whether today’s price change is up or down.
Capital (CP):
Enter your account size (example: 10,00,000).
This is the base for position size calculations.
Risk Mode (R):
Currency → Risk a fixed amount per trade (e.g., $5000).
Percentage → Risk a fixed % of your capital (e.g., 0.5%).
⚡ The script automatically calculates how much money you’re risking per trade based on your choice.
✅ Stop & Quantity Calculations
D (Stop Low %) → How far today’s close is from the day’s low.
DH (Stop High %) → How far close is from the mid-body of today’s candle.
Q (Quantity) → How many shares you can buy/sell if stop = day’s low.
QH (Quantity High) → Quantity if stop = mid-body.
SSL #1, #2, #3 → Standard stop-loss setups (e.g., 0.75%, 1%, 1.25%).
💡 If you enable Lot Size, all quantities are converted into nearest lot multiples (good for futures).
🔹 2. Volume Bar Coloring
Green = Price closed higher than it opened.
Red = Price closed lower than it opened.
Plots on the volume chart so you can see bullish/bearish volume.
🔹 3. Trend Intensity (TI)
Uses two moving averages (fast & slow).
Green dot on top → Trend strongly bullish.
Red dot on top → Trend strongly bearish.
Helps you spot momentum shifts.
🔹 4. Episodic Pivot (EP)
Marks big volume spikes with orange triangles under candles.
Default threshold = 9 million volume.
Shows when institutions may be entering/exiting.
🔹 5. Data Metrics Table
Quick fundamentals shown in a table:
MC (Market Cap): Company’s total market value.
Industry × Sector: Classification for the stock.
FF (Free Float): Value of shares available for public trading.
💡 In INR stocks → values are shown in Crores.
💡 In USD stocks → values shown in raw currency format.
⚡ Bottom Line
Pro Volume Lite helps you:
Size your trades correctly,
Control your risk,
Spot strong volume moves,
Check quick fundamentals,
All inside your TradingView chart.
Informacje o Wersji
Here are the new features added to the updated script, in bullet points:* **Manual Trade Input**: You can now manually enter your **Entry Price** and **Actual Quantity** after you've taken a trade.
* **Precise Stop-Loss Calculation**: Based on your manual entry, the script calculates the **exact stop-loss price** you need to use to stay within your planned risk.
* **"Parts Selling" Calculator**: A new tool helps you scale out of winning trades by showing you how to sell your position in equal, smaller parts.
* **R-Multiple Profit Targets**: The script now automatically calculates and displays multiple price targets based on your initial risk (e.g., where to take profits for a 1R, 2R, 3R gain).
* **"Volume × Price" (Turnover)**: A new metric was added to the data table, showing the total dollar value traded for the current bar.
* **Dedicated Trade Management Row**: A new row was added to the main data table to display all of the above information (your live trade entry, stop-loss, and profit targets) in one convenient place.
Informacje o Wersji
Rearrangement of table cells.Informacje o Wersji
Rearranged the table cells.Informacje o Wersji
$DA & Parts Things removed.Added CR to the indicator.
Informacje o Wersji
Added SQ#4.Remove Default Bar option.
Informacje o Wersji
Added $DA.Informacje o Wersji
Added Parts things with sell into strength.Secondary table orientation also is different.
Optimized for speed.
Informacje o Wersji
Added F&O Status.Moved from manual Lot sizing to auto lot sizing.
Informacje o Wersji
Minor Fix.Informacje o Wersji
Minor Bug Fix. Informacje o Wersji
Changed Default Color Settings.Skrypt chroniony
Ten skrypt został opublikowany jako zamknięty kod źródłowy. Możesz jednak używać go swobodnie i bez żadnych ograniczeń – więcej informacji tutaj.
Wyłączenie odpowiedzialności
Informacje i publikacje przygotowane przez TradingView lub jego użytkowników, prezentowane na tej stronie, nie stanowią rekomendacji ani porad handlowych, inwestycyjnych i finansowych i nie powinny być w ten sposób traktowane ani wykorzystywane. Więcej informacji na ten temat znajdziesz w naszym Regulaminie.
Skrypt chroniony
Ten skrypt został opublikowany jako zamknięty kod źródłowy. Możesz jednak używać go swobodnie i bez żadnych ograniczeń – więcej informacji tutaj.
Wyłączenie odpowiedzialności
Informacje i publikacje przygotowane przez TradingView lub jego użytkowników, prezentowane na tej stronie, nie stanowią rekomendacji ani porad handlowych, inwestycyjnych i finansowych i nie powinny być w ten sposób traktowane ani wykorzystywane. Więcej informacji na ten temat znajdziesz w naszym Regulaminie.