OPEN-SOURCE SCRIPT
Zaktualizowano Pearson Oscillator
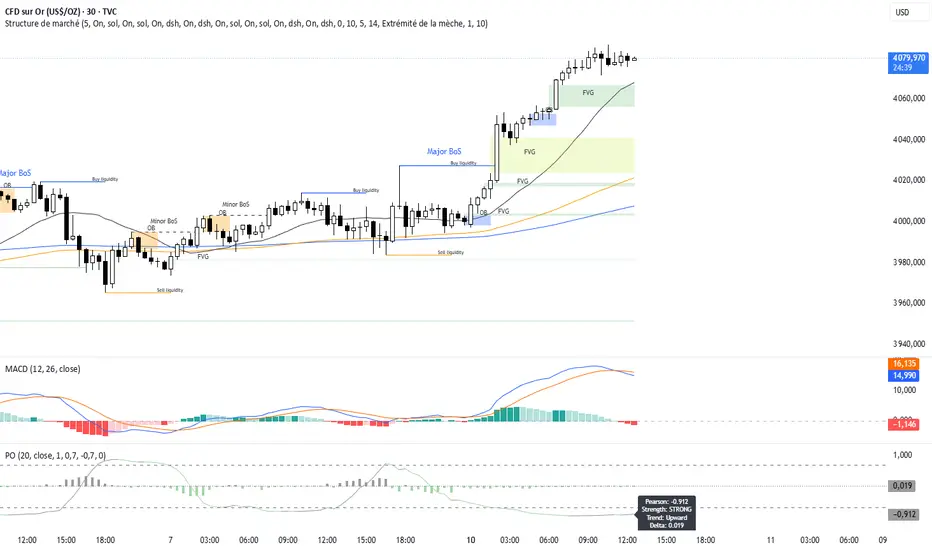
The Pearson Oscillator is a custom TradingView indicator that leverages statistical correlation analysis to gauge the trend strength of a given price series. By calculating the Pearson correlation coefficient between time (as an index) and price over a user-defined period, the indicator provides traders with an insight into how strongly the market is trending or oscillating.
──────────────────────────────
Key Features
- User-Defined Parameters:
– Set the calculation length, price source, and smoothing period.
– Adjust upper and lower threshold levels to suit your trading strategy.
– Customize color settings for increasing, decreasing, and neutral conditions.
- Dynamic Trend Analysis:
– Computes the Pearson correlation coefficient to measure the relationship between time and price.
– Applies a simple moving average to smooth out fluctuations in the coefficient, offering a more stable reading.
- Visual Representation:
– Plots the smoothed Pearson coefficient as a continuous line.
– Displays a histogram showing the variation (first derivative) of the coefficient to highlight changes in trend strength.
– Draws horizontal reference lines at the specified upper and lower thresholds as well as at the zero level for quick visual assessment.
- Alerts and Dynamic Labeling:
– Automatically triggers alerts when the smoothed Pearson coefficient crosses the predefined threshold levels, so you never miss a potential market turning point.
– Generates a dynamic label on the last bar that displays important statistical information, including:
- The current Pearson coefficient (rounded to three decimals).
- A classification of correlation strength (e.g., STRONG, MEDIUM, WEAK, NEUTRAL) based on the absolute value of the coefficient.
- The trend direction (Upward, Downward, or Stable).
- The delta of the coefficient, offering insight into how quickly the trend is evolving.
──────────────────────────────
How It Works
1. Calculation of the Pearson Coefficient:
- A custom function iterates over a specified number of price bars, summing time indices, price values, and their squared and cross-products.
- Using the Pearson correlation formula, it computes a coefficient that ranges between -1 and 1—values close to ±1 indicate a strong trend or linear relationship, while values near 0 suggest a weak or non-existent trend.
2. Smoothing Process:
- The raw Pearson coefficient is then smoothed using a simple moving average (SMA) to reduce noise and provide a clearer view of the underlying trend.
3. Delta (Variation) Computation:
- The script calculates the change (delta) between the current smoothed coefficient and its value on the previous bar.
- This derivative is plotted as a histogram, signaling the speed at which the correlation (and thus the trend) is changing.
4. Visual and Alert Mechanisms:
- The smoothed coefficient and its delta are plotted with colors that dynamically update to reflect increasing or decreasing trends.
- Horizontal lines set at user-defined thresholds help to quickly identify overbought or oversold (or extreme correlation) scenarios.
- Alerts are defined to notify you when the smoothed coefficient crosses these key levels, ensuring timely trade decisions.
5. Dynamic Label:
- At the last bar, a dynamic label is created displaying the current Pearson value, its strength, the direction of the trend, and the delta.
- This quick snapshot helps traders assess the market condition at a glance without diving into detailed analysis.
──────────────────────────────
Why Use the Pearson Oscillator?
This indicator is particularly useful for traders who need a quantitative measure of trend strength that goes beyond traditional moving averages. By integrating statistical correlation directly into market analysis, the Pearson Oscillator helps you:
- Identify periods of strong trending behavior or potential reversals.
- Enhance your risk management through early alerts.
- Visualize the rate of change in market sentiment, enabling more informed entry and exit decisions.
Whether you are a technical analyst or a systematic trader, this indicator provides a robust tool to complement your existing trading toolkit.
──────────────────────────────
The Pearson Oscillator merges statistical insights with technical charting, creating an intuitive yet powerful tool for market analysis. With its adjustable parameters, visual cues, dynamic labeling, and automated alerts, it assists traders in monitoring and responding to evolving market conditions efficiently. This makes it a valuable addition to any TradingView chart, particularly for those looking to quantify the strength and evolution of market trends.
Feel free to adapt the parameters and visual settings to best align the indicator with your trading strategy. Happy trading!
──────────────────────────────
Key Features
- User-Defined Parameters:
– Set the calculation length, price source, and smoothing period.
– Adjust upper and lower threshold levels to suit your trading strategy.
– Customize color settings for increasing, decreasing, and neutral conditions.
- Dynamic Trend Analysis:
– Computes the Pearson correlation coefficient to measure the relationship between time and price.
– Applies a simple moving average to smooth out fluctuations in the coefficient, offering a more stable reading.
- Visual Representation:
– Plots the smoothed Pearson coefficient as a continuous line.
– Displays a histogram showing the variation (first derivative) of the coefficient to highlight changes in trend strength.
– Draws horizontal reference lines at the specified upper and lower thresholds as well as at the zero level for quick visual assessment.
- Alerts and Dynamic Labeling:
– Automatically triggers alerts when the smoothed Pearson coefficient crosses the predefined threshold levels, so you never miss a potential market turning point.
– Generates a dynamic label on the last bar that displays important statistical information, including:
- The current Pearson coefficient (rounded to three decimals).
- A classification of correlation strength (e.g., STRONG, MEDIUM, WEAK, NEUTRAL) based on the absolute value of the coefficient.
- The trend direction (Upward, Downward, or Stable).
- The delta of the coefficient, offering insight into how quickly the trend is evolving.
──────────────────────────────
How It Works
1. Calculation of the Pearson Coefficient:
- A custom function iterates over a specified number of price bars, summing time indices, price values, and their squared and cross-products.
- Using the Pearson correlation formula, it computes a coefficient that ranges between -1 and 1—values close to ±1 indicate a strong trend or linear relationship, while values near 0 suggest a weak or non-existent trend.
2. Smoothing Process:
- The raw Pearson coefficient is then smoothed using a simple moving average (SMA) to reduce noise and provide a clearer view of the underlying trend.
3. Delta (Variation) Computation:
- The script calculates the change (delta) between the current smoothed coefficient and its value on the previous bar.
- This derivative is plotted as a histogram, signaling the speed at which the correlation (and thus the trend) is changing.
4. Visual and Alert Mechanisms:
- The smoothed coefficient and its delta are plotted with colors that dynamically update to reflect increasing or decreasing trends.
- Horizontal lines set at user-defined thresholds help to quickly identify overbought or oversold (or extreme correlation) scenarios.
- Alerts are defined to notify you when the smoothed coefficient crosses these key levels, ensuring timely trade decisions.
5. Dynamic Label:
- At the last bar, a dynamic label is created displaying the current Pearson value, its strength, the direction of the trend, and the delta.
- This quick snapshot helps traders assess the market condition at a glance without diving into detailed analysis.
──────────────────────────────
Why Use the Pearson Oscillator?
This indicator is particularly useful for traders who need a quantitative measure of trend strength that goes beyond traditional moving averages. By integrating statistical correlation directly into market analysis, the Pearson Oscillator helps you:
- Identify periods of strong trending behavior or potential reversals.
- Enhance your risk management through early alerts.
- Visualize the rate of change in market sentiment, enabling more informed entry and exit decisions.
Whether you are a technical analyst or a systematic trader, this indicator provides a robust tool to complement your existing trading toolkit.
──────────────────────────────
The Pearson Oscillator merges statistical insights with technical charting, creating an intuitive yet powerful tool for market analysis. With its adjustable parameters, visual cues, dynamic labeling, and automated alerts, it assists traders in monitoring and responding to evolving market conditions efficiently. This makes it a valuable addition to any TradingView chart, particularly for those looking to quantify the strength and evolution of market trends.
Feel free to adapt the parameters and visual settings to best align the indicator with your trading strategy. Happy trading!
Informacje o Wersji
Modification pour blocageSkrypt open-source
W zgodzie z duchem TradingView twórca tego skryptu udostępnił go jako open-source, aby użytkownicy mogli przejrzeć i zweryfikować jego działanie. Ukłony dla autora. Korzystanie jest bezpłatne, jednak ponowna publikacja kodu podlega naszym Zasadom serwisu.
Wyłączenie odpowiedzialności
Informacje i publikacje nie stanowią i nie powinny być traktowane jako porady finansowe, inwestycyjne, tradingowe ani jakiekolwiek inne rekomendacje dostarczane lub zatwierdzone przez TradingView. Więcej informacji znajduje się w Warunkach użytkowania.
Skrypt open-source
W zgodzie z duchem TradingView twórca tego skryptu udostępnił go jako open-source, aby użytkownicy mogli przejrzeć i zweryfikować jego działanie. Ukłony dla autora. Korzystanie jest bezpłatne, jednak ponowna publikacja kodu podlega naszym Zasadom serwisu.
Wyłączenie odpowiedzialności
Informacje i publikacje nie stanowią i nie powinny być traktowane jako porady finansowe, inwestycyjne, tradingowe ani jakiekolwiek inne rekomendacje dostarczane lub zatwierdzone przez TradingView. Więcej informacji znajduje się w Warunkach użytkowania.