OPEN-SOURCE SCRIPT
ETH Top, Mid and Bottom Cap Bands [jcray]
Modified from Average Cap [aamonkey] and Top Cap [aamonkey].
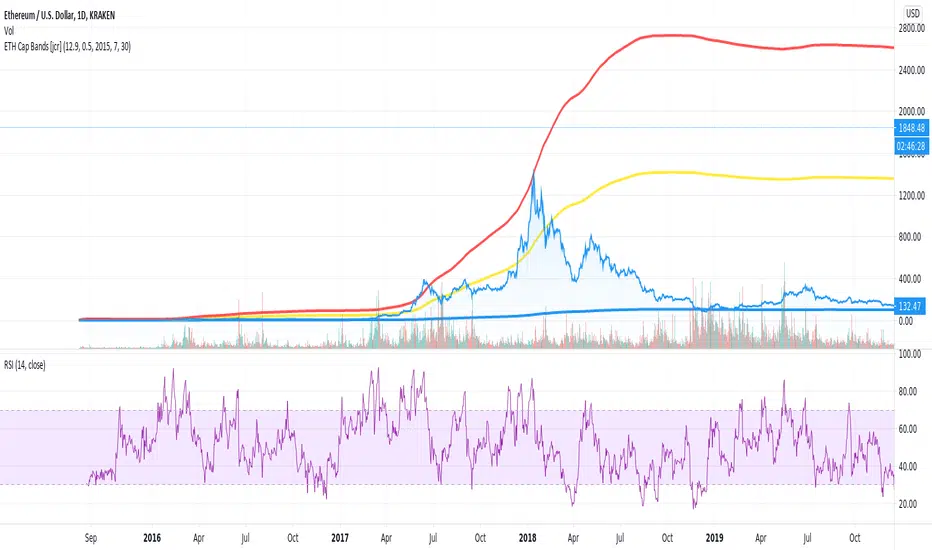
The top cap (red line) can be seen as an absolute market top that may never be significantly exceeded and so is a good indicator to sell a position, or enter a long-term short-sell.
The mid cap (yellow line) can be used as an indicator for market sentiment. Above the mid cap, the market is in a bullish environment, and below it, the market is in a bearish environment.
The bottom cap (blue line) can be seen as an absolute market bottom that may never be fallen short of, and so is a good indicator to enter a long-term buying opportunity, or exit a long-term short-sell.
Skrypt open-source
W zgodzie z duchem TradingView twórca tego skryptu udostępnił go jako open-source, aby użytkownicy mogli przejrzeć i zweryfikować jego działanie. Ukłony dla autora. Korzystanie jest bezpłatne, jednak ponowna publikacja kodu podlega naszym Zasadom serwisu.
Wyłączenie odpowiedzialności
Informacje i publikacje nie stanowią i nie powinny być traktowane jako porady finansowe, inwestycyjne, tradingowe ani jakiekolwiek inne rekomendacje dostarczane lub zatwierdzone przez TradingView. Więcej informacji znajduje się w Warunkach użytkowania.